• Overview
  • Reviews (9)
  • Comments (13)
  • What's new

Enigmera

5

ENIGMERA: The core of the market

The indicator’s code has been completely rewritten. Version 3.0 adds new functionalities and removes bugs that had accumulated since the indicator’s inception.

Introduction
This indicator and trading system is a remarkable approach to the financial markets. ENIGMERA uses the fractal cycles to accurately calculate support and resistance levels. It shows the authentic accumulation phase and gives direction and targets.  A system that works whether we are in a trend or a correction. 

How It Works
Most of the indicator’s functionality is controlled through buttons on the left side of the chart, allowing rapid response to different market conditions.

Buttons

  1. ON/OFF - Shows or hides the entire indicator.
  2. Channel - Activates the support channel, indicating an acceptable range of deviation.
  3. Dev1 (First Deviation) - Indicates price movement within the support deviation, signaling market consolidation or strength accumulation.
  4. Dev2 (Second Deviation) - Shows price movement between deviations, signaling trend formation and direction.
  5. Dev3 (Third Deviation) - Indicates significant trend acceleration and high volatility.
  6. 45deg (45 Degrees) - Shows market pace and movement stability relative to the 45-degree line.
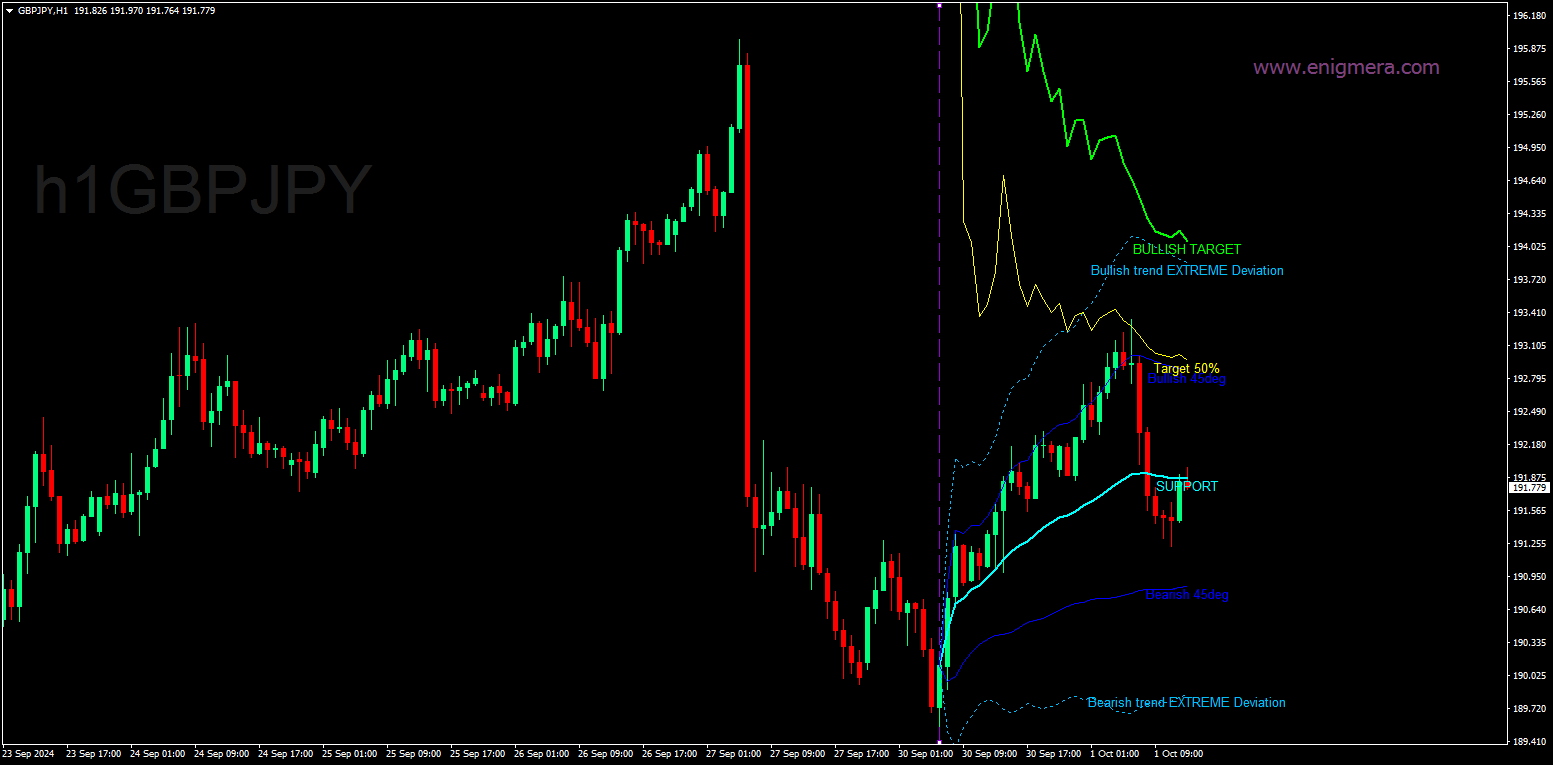
  7. Tgt1/2 (Half Target) - Represents half of the trend’s target line, used in the market’s final phase.
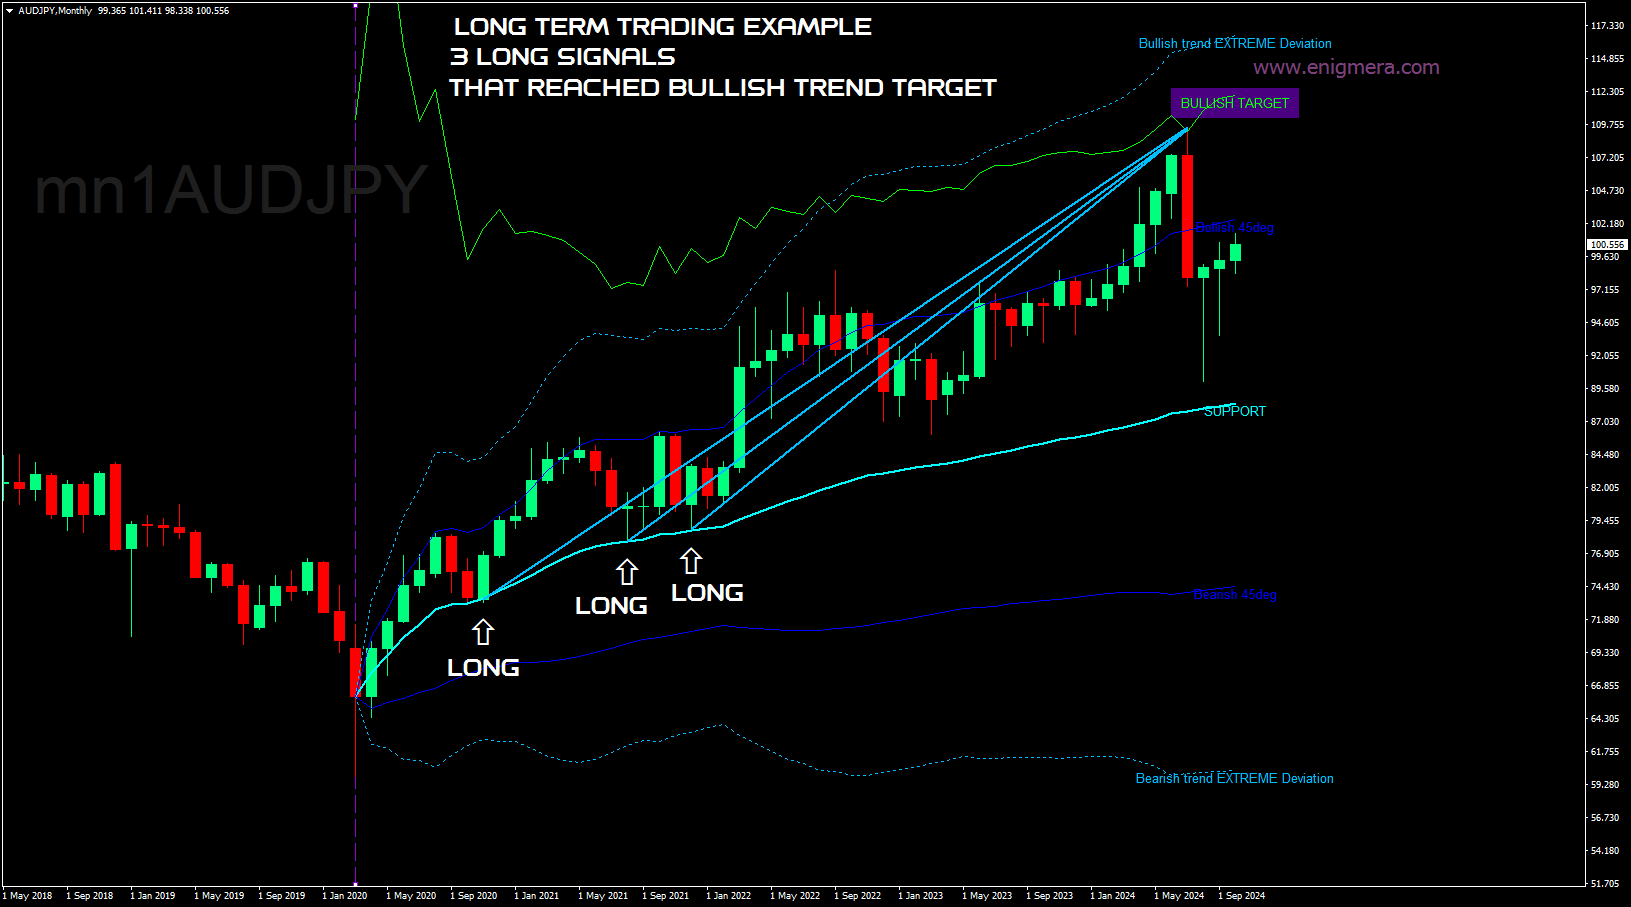
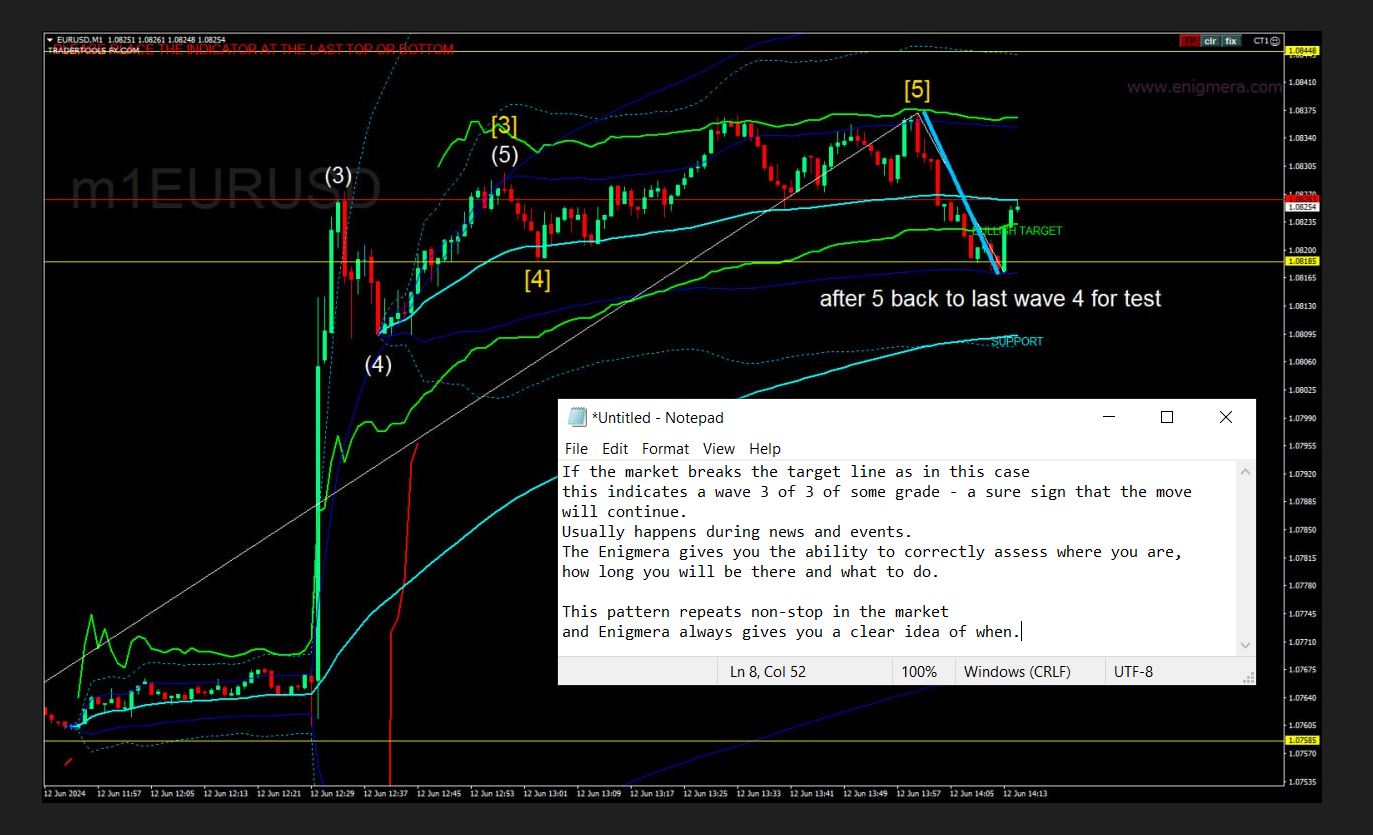
  8. Tgt (Target) - The trend’s target line, indicating levels to close positions.
  9. Vol (Volume) - Displays volume dots on candles to indicate significant changes in market volume.
  10. X - Displays an “X” when the market reaches the target line.
  11. Lbls (Labels) - Shows or hides the labels on the lines.
  12. RandC (Random Colors) - Changes the indicator’s lines and labels to random colors for better visualization.

The system provides a complete picture of the present—unlike typical market indicators that merely extrapolate past data into the present and future. If you’re on support, it’s genuine support; if you’re on resistance, it’s genuine resistance. A broken level indicates a change in trend.

ENIGMERA is designed for financial analysts and consultants who need dependable insights to share with clients, as well as investors who demand the utmost precision and confidence.

It stands out for its optimal precision, enabling traders to evaluate their options with clarity and confidence.

Combining 20 years of trading expertise and knowledge into one comprehensive package, ENIGMERA is both intuitive and user-dependent. Its effectiveness relies on proper configuration by the user to maximize performance.


Recommendations:

  • Currency Pair: All pairs, all markets
  • Timeframe: All timeframes
  • Minimum Deposit: No minimum deposit
  • Account Type: No limitations
  • Brokers: No limitations

This sophisticated indicator is ideal for effective day trading and scalping strategies. Optimize your discretionary trading with Enigmera’s advanced algorithms, suitable for Forex, stocks, indexes, and crypto markets. Designed for MetaTrader 4, MetaTrader 5 and TradingView, Enigmera streamlines stop-loss and risk management in trading.

All the tools you need to become a successful trader. Enigmera works on every market and every timeframe—with no redrawing.
Unlock a world of trading wisdom. 
Are you ready to take your financial decision-making to the ultimate level?


Reviews 9
TANJU2690
474
TANJU2690 2025.03.05 13:37 
 

I have never and ever seen any system like Enıgmera. What ever you want, you can find on it. İt is incredible system. And Cretor of aenıgmera, Mr.Ivan is more and more helpfull to understant of logıc Enigmera. Fistly, I want sent all thankfull to Ivan because he teach me Enıgmera Logıc and also share this marvelous product with market

smso9466eiou
90
smso9466eiou 2025.02.23 15:38 
 

a very good indicator that composes all in one, entry, exit and reverse. Great!

Osazeme Usen
472
Osazeme Usen 2024.12.31 12:38 
 

This is probably the best indicator I have seen in marketplace. Fantastic analysis with phenomenal success rates.

Update: Not great for direction, but fantastic for TP and SL.

Recommended products
Before
Nadiya Mirosh
The Before indicator predicts the most likely short-term price movement based on complex mathematical calculations. Most of the standard indicators commonly used in trading strategies are based on fairly simple calculations. This does not mean that there were no outstanding mathematicians in the world at the time of their creation. It is just that computers did not yet exist in those days, or their power was not enough for the sequential implementation of complex mathematical operations. Nowad
Power Renko MT4
Pierce Vallieres
Power Renko is an indicator which plots Renko bricks underneath the chart using a histogram. You can select the brick size and the timeframe of the Renko bricks as well as whether or not to use the close price or the high/low price of the candles. Renko bricks are based on price alone, not time, therefor the Renko bricks will not be aligned with the chart's time. They are extremely useful for trend trading and many different strategies can be formed from them. Buffers are provided allowing you t
Introduction to Smart Renko The main characteristics of Renko Charting concern price movement. To give you some idea on its working principle, Renko chart is constructed by placing a brick over or below when the price make the movement beyond a predefined range, called brick height. Therefore, naturally one can see clear price movement with less noise than other charting type. Renko charting can provide much clearer trend direction and it helps to identify important support and resistance level
EMACrossRenko
Hong Ling Mu
1 (1)
<LOGIC> The EMA RENKO EA should run in Renko chart to show the best performance. The EA will entry based on 2 EMA line cross. (it is changeable in parameter.) As a result of FT , the best box size for XAUUSD (GOLD) is BOX 60 to 100.  Renko box size should be larger than spread value. Normally 3 times of spread. Please decide your box size with yourself. The EA will place addtional order as Grid if the trend move  to xxx pips from the last order. You can turn on/off in the parameter. The MAC
Bigger chart labels would allow the user to be entirely aware of which chart he/she is on. Each chart window is unique, containing different patterns and economic motives so acknowledging the chart window would be absolutely essential! There are well known Economic Time Zones included in clear view, by choice!    Simple does it! Use your computing mouse scroller, clicking with the right finger on the label, in order to customize the label properties. From there, choose your preferred color, fon
FREE
RSI TrendLine Divergency Message is an indicator for the MetaTrader 4 trading platform. Unlike the original indicator, this three in one version has a system of alerts that inform on market situation changes. It consists of the following signals: when the Main line crosses the levels of extreme zones and 50% level; when the Main line crosses the Trend line in the indicator window; divergence on the last bar. Parameters of levels of extremum, 50-level and divergence are adjustable. Parameters La
MTF Heiken Ashi MA is a multiple timeframe Heiken Ashi & Moving Average indicator. Fully customizable for advanced & unique Heiken Ashi & Moving Average calculations. Key Features Modified appearance and appeal from the traditional using only H eiken Ashi MA bodies. MTF Higher or lower timeframes available making this it great for trends and scalping. There are many settings that can be non-repaint for signals at a new bar and at bar 0. Inputs Timeframe  = PERIOD_CURRENT - timeframe of Moving
FREE
This indicator shows the gaps on the current chart with a rectangle shape and indicates when the gap is filled by closing the shape. Gaps are considered over the shadows. Allows sending alerts by e-mail or push notifications when a gap is found. Parameters SizeGAP - Size of the gap that you want to indicate; HGcolor1 - Color of the gap in an upward movement; HGcolor2 - Color of the gap in a downward movement; HGstyle - The style of rectangle to be drawn; StartCalculationFromBar - How many candl
This is an arrow indicator without a future function,developed based on the most advanced profit trading algorithms.It has the most innovative and advanced dual trend analysis module, as well as the latest and highly effective market trend prediction algorithm.Trends are your friends, and following larger trends can earn the maximum profit in foreign exchange. This indicator helps traders identify current trends and track them. Someone once made a profit of 10 times in a week by relying on it.No
Holy Renko PRO
Bianca Seara
3.5 (2)
About  Holy Renko is a trend identifier capable of identify small and long market movements. This indicator should be use in Renko Charts. VIDEO (information and tips) [HERE] How to install Renko Charts [HERE] Features Developed for Renko Charts Easy to analyze Fast signals Not repaint (when candle close)  Statistics panel Filters false signals Alerts, emails and push notifications  Advantages of Renko Chart Easy to install Easy to analyze Filter out the noise of wicks  Easy identification
This indicator is a great utilities tools for Fibonacci Trader that draw their chart manually. This indicator do not draw any Fibonacci Retracement or Fibonacci Expansion. It is a utilities tool for modifying the Fibonacci level for Fibonacci object manually drawn on the chart. Just draw using the Fibonacci Retracement or other Fibonacci tool in MT4 as per normal. The select the Fibonacci you have just drawn. Make sure you have only 1 object selected. Then open up this Fibonacci Level Management
The Renko indicator is a technical analysis tool used in the forex market to visualize price movements and trends by eliminating market "noise." Unlike traditional candlestick or bar charts, Renko is built based on price changes of a specified number of points, called the "brick size." When the price moves by this amount of points, a new "brick" is added to the chart. This indicator ignores time and volume, focusing exclusively on price changes. The main features of the Renko indicator include:
UTBot with HTS filter
Bartlomiej Tadeusz Tomaja
Advanced UT Bot & HTS Indicator This indicator is an advanced technical analysis tool that combines two methods: UT Bot and HTS (Higher Timeframe Smoothing) , to generate accurate buy and sell signals. 1. Indicator Structure Works within the main chart window and utilizes 11 buffers to store various data points, including arrows (buy/sell signals) and bands from both UT Bot and HTS systems. Uses colored arrows to represent different trading conditions: Blue arrows : Normal buy signals. Red arro
Velas RENKO
Ramon Sobrevals Arce
Immediately plots renko bars in an external/indicator window.  One of the distinctive advantages Renko charts offer is the fact that they are not time dependent. Therefore, the new Renko blocks are only traced when the price moves higher or lower by the specified number of points.  For example, a 10 pip (100 points) Renko chart would plot the blocks when price moves 10 pips higher in an uptrend or 10 pips lower in a downtrend. Renko charts removes "noises" from the Market and i t helps to identi
Attraverso l'indicatore Savius Zone potrai finalmente: Definire delle zone oggettive da attenzionare Ridurre la discrezionalità Filtrare i tuoi pattern operativi Avvalerti di un metodo comprovato Qui di seguito alcune funzioni dell'indicatore Savius Zone: Zone Buy & Sell L’indicatore fornisce delle zone buy e sell ogni giorno dopo l’apertura del mercato cash sui seguenti mercati: DAX, S&P500, Nasdaq, Russel2000, Dow Jones Occasioni giornaliere Savius Zone fornisce occasioni di trading tutti i
Chaos Trader Lite
John Davis
1 (1)
Chaos Trader Lite attempts to use aspects of chaos theory to place trades in the marketplace. This Expert Advisor, in particular, draws upon theories made by Bill Williams. Every version of MetaTrader contains the Bill Williams indicators. I wondered why was he deemed so important as to have his own set of indicators added to MetaTrader with name attribution. Conducting research I found that Bill Williams wrote a book using chaos theory to trade the markets. The Bill Williams indicators are usef
FREE
The indicator displays Renko bars on the chart, uses their data to calculate and display the Bollinger Bands, MACD oscillator and generates buy/sell signals. Renko is a non-trivial price display method, in which a bar within a time interval is shown on the chart only if the price has moved a certain number of points. Renko bars do not depend on a time interval, therefore the indicator works on any timeframe without losing its efficiency. When attached to a chart, the indicator checks for presenc
Rira Renko
Vitor Palmeira Abbehusen
RENKO on Time Chart This indicator is an enhanced Renko, so you can watch the Renko bricks on the chart to understand price movement more clearly the other improvement is automated box size according to ATR (Average True Range) period you can set the ATR number as you want and the box size of Renko changes automatically based on price movement Inputs Mode: Box size is the input to specify the size of the Renko box you want to print on the chart. This input lets you choose the fixed box siz
MASi Three Screens
Aleksey Terentev
5 (2)
MASi Three Screens is based on the trading strategy by Dr. Alexander Elder. This indicator is a collection of algorithms. Algorithms are based on the analysis of charts of several timeframes. You can apply any of the provided algorithms. List of versions of algorithms:     ThreeScreens v1.0 - A simple implementation, with analysis of the MACD line;     ThreeScreens v1.1 - A simple implementation, with analysis of the MACD histogram;     ThreeScreens v1.2 - Combines the first two algorithms in
FREE
Renko, Heiken Ashi, Ticks Bar, Range Bar.    Easy switching, easy setup, all in one window.        Place the Custom Chart indicator and view Renko, Heiken Ashi, Tick bar, Range bar charts in real time at real chart.    Position the offline chart window so that the indicator control panel is visible.    Switch the chart mode by click of a button.    Connect to the output chart any indicator, expert advisor without any restrictions.    No, it doesn't work in the tester.    Yes, you can use an
Identify Take
Oleksii Ferbei
4.5 (2)
Identify Take - trend trading strategy, market noise filtering and all necessary functions built into one tool! The system itself shows in the form of arrows when to buy and when to sell. Uses only one setting parameter. Simple, visual and effective trend detection. The intelligent algorithm of the Identify Take indicator shows the points of a potential market reversal. Most often, a good trend can be seen visually on the price chart. But an experienced trader must clearly understand the curre
Pro Indicator Trader is a professional trading tool with which you can automate/create a trading strategy using the 31 classical Metatrader 4 indicators.  An elegant and intuitive interface allows you to customize your strategy down to the smallest detail and choose whenever the EA should open a buy or sell position. For each entry-trade rule, you can use up to 14 different indicators. The EA is designed for professional traders, therefore it has many advanced functions. The EA records the order
Black Out EA
Jason Thato Hartley
Thank you for visiting us. We would like to introduce our new BLACK OUT EA which comes along with a moving average indicator for better trading This EA open and closes trades for you, no need to stress yourself. You can trade on any broker using any time frame . there are no restrictions!! You can easily increase your Lot size on the EA settings Backtest was done for two months. stay tuned for more !!!
ADM Multiframe
Dmitriy Susloparov
ADM Oscillator Multiframe Unlike the classic indicator " Average Direction Movement index ", this indicator shows directly the difference between the +DI and -DI values. When +DI is greater than -DI results above zero and vice versa. This is more visual and, in addition, allows you to clearly see the interaction of indicator readings for different timeframes. It also uses a proprietary technology that allows you to see different timeframes simultaneously on a single time scale. For example, fo
极大的提升了交易感官,一目了然的走势展示,简洁高效。 极大的突出展示了行情的趋势脉络,跟随时间周期适应变化,替用户交易者研判了行情走势,简洁高效 同时我们还提供了主窗口和副窗口的展现,有需要可以联系我作者本人,感谢支持。 像传统的renko,又不是传统的renko,技术在发展,同样的砖图可以有不一样的绘制和计算展现。 希望可以帮到大家的交易,再次感谢。 极大的提升了交易感官,一目了然的走势展示,简洁高效。 极大的突出展示了行情的趋势脉络,跟随时间周期适应变化,替用户交易者研判了行情走势,简洁高效 同时我们还提供了主窗口和副窗口的展现,有需要可以联系我作者本人,感谢支持。 像传统的renko,又不是传统的renko,技术在发展,同样的砖图可以有不一样的绘制和计算展现。 希望可以帮到大家的交易,再次感谢。
The indicator displays Renko bars on the chart, uses their data to calculate and display the moving average, PriceChannel and generates buy/sell signals. Renko is a non-trivial price display method. Instead of displaying each bar within a time interval, only the bars where the price moved a certain number of points are shown. Renko bars do not depend on a time interval, therefore the indicator works on any timeframe without losing its efficiency. The PriceChannel indicator displays the upper, lo
Candle GAP
Thushara Dissanayake
3 (1)
The Candle GAP indicator is an essential tool for traders utilizing Gap Trading Strategies as it automatically identifies candle gaps for each day of the week. A gap refers to a price level difference between the close and open of two consecutive days. This indicator recognizes four types of gap patterns: Common, Breakaway, Continuation, and Exhaustion. By incorporating this indicator into any chart, traders can validate their signals and enhance their trading decisions. One of the key features
FREE
Renko Smart EA
Salah Eddine Elkouchi
2 (1)
Renko chart Removes a lot of the noise that is normally generated in the normal chart, and gives  a direct picture of the prices that being charged. This removes much of the noise from the candlestick charts and allows Traders to focus on actual market movements. It can also help Traders  trading larger or smaller price movements. For example, if you are using 50 point bricks, it takes a while to form a bullish or bearish brick. This tells Traders of the market that the it is moving, and that t
Hello all The expert works on the intersection of moving averages with a digital method of opening deals With closing deals on a profit of a number of points programmatically With opening deals with the trend and closing some deals together for a profit until all are closed together for a profit The expert works on regular candles. It is possible to experiment on the timing of five minutes, quarter-hour, half-hour or hour parameters: Lot1: Manual Lot Size Auto_Lot: Set true to automatically ca
Median Renko Terminator works best with renko charts if you do not have a renko chart generator I will email it to you for free and give you the correct settings for scalping or to swing trade NON-REPAINT  COMES WITH ALERTS WHEN THERE IS A SIGNAL Conditions to sell: big purple arrow shows you the direction first then you take the small purple arrow to enter the same direction of the purple arrow. Conditions to buy: big white arrow shows you the up direction first then you take small white arrow
Buyers of this product also purchase
Cycle Maestro
Stefano Frisetti
NOTE: CYCLEMAESTRO is distributed only on this website, there are no other distributors. Demo version is for reference only and is not supported. Full versione is perfectly functional and it is supported CYCLEMAESTRO , the first and only indicator of Cyclic Analysis, useful for giving signals of TRADING, BUY, SELL, STOP LOSS, ADDING. Created on the logic of Serghei Istrati and programmed by Stefano Frisetti ; CYCLEMAESTRO is not an indicator like the others, the challenge was to interpret only t
Hit Rate Top Bottom Signal
Martin Alejandro Bamonte
Hit Rate Top Bottom Signal Hit Rate Top Bottom Signal Hit Rate Top Bottom Signal offers a completely innovative approach. It's ideal for those who want to evaluate beforehand how the signal performs with a specific TP-SL and in which PAIRS/TFs it performs best. The Hit Rate Top Bottom Signal strategy is a fundamental tool for any trader and any type of trading because it not only emits precise, non-repainting signals , clearly indicating when and in which direction to trade, but also keeps a det
Bomb Bank Signal
Igor Pereira Calil
5 (1)
Bomb Bank Signal: Your Trusted Indicator for MetaTrader 4 The Bomb Bank Signal is a powerful indicator for MetaTrader 4, designed to identify the most relevant trends in the financial market. If you are looking for a tool that accurately anticipates movements, Bomb Bank is the ally you need. How it Works: This indicator combines three distinct methods – volume analysis, candle closes and symmetrical trend – to detect and signal buying and selling opportunities. Bomb Bank is like a "bomb" whe
This is a mini version(One pair) of Advanced Detector of Trend Reversal and Continuance known as TrueTrendStarM(TTSm25). It is a sensitive and Predictive indicator of Price Trends for Professional traders. ( WEEKEND DISCOUNT 20% OFF !!! )( ATTENTION BUYERS:- PLEASE CONTACT ME FOR HOW BEST TO USE THE INDICATOR FOR MAXIMUM PROFITS )    It detects high odds changes in Price Trend direction long before other indicator detects it. I have been working on it since 2019.    This is possible due to f
Trade Invest Pro
Dmitriy Kashevich
Trade Invest Pro - Boss in the world of cryptocurrency! This indicator is ideal for cryptocurrency trading! Work on Trade Invest Pro took us half a year! But not in vain! Now only accurate signals near support - resistance levels! He showed himself well on timeframes m5 m15 for binary options! Optionally, it can be configured for forex for timeframes m30 and more! Reacts well to news! Doesn't paint! and does not disappear from the schedule! As soon as a red arrow appears, open a deal fo
ZO Trend
Trung Le Hoang
4 (4)
Important!! ZO Trend can't work on MN timeframe. /*--------------------------------------------------------------------------------------------------------------------------------------------------------------------------------------------- ZO Trend an indicator used to search for entry point. With the session candle algorithm on many timeframe, ZO Trend creates an area for traders find good Entry Point. ZO SYSTEM BASIC SETUP :  https://www.youtube.com/watch?v=qdNOXHWozNw ZO TREND User guide : 
This is the indicator for the biggest money.  It's performance is exceptional. Whatever interest there is in the market you will see it.  In almost all cases it will only give you a long term view of the market, but don't be fooled into thinking this is event bound. Nothing like that. It finds where the biggest interest is in the market and shows it to you. Do not forget that the biggest money (interests)  not shown on the market everyday . That's something you haven't encountered.The price is
Dark Sniper
Dmitriy Kashevich
Dark Sniper pointer indicator.  Complete absence of redrawing   The percentage of correct indicator forecasts depends on your settings; the default is period 7 (performed better) The arrow indicates the direction of the next candle and the possible direction of the trend in the future.  Suitable for small timeframes m1 and m5  It is recommended to open transactions from 1 to 2 candles.  The signal appears on the current candle. Open a trade on the next one since the signal is being generat
Hello Dear Trader, Today Im Telling You About The "Golden Scalp System V1 " Metatrader4 Golden Scalp System Scalper with EMA   This is a  Scalper strategy   based on ( Exponential moving average) EMA . Time frame: H1 Pair: EUR/USD, GBP/USD,AUD/USD XAU/USD Platform Mt4   Indicators for Scalper with Ema: 300  EMA (Exponential Moving Average) ; 500 EMA (Expontial Moving Average); Stochastic   (5,3,3)   Long Entry 1) 300  EMA   > 500  EMA . 2) Find significant levels of support. 3) Wait for the c
Magic M2
Tuan Anh Dao
4.5 (8)
------ GOOD LUCK   -----   (Telegram: @MagicBinary) The indicator allows you to trade binary options. T his indicator give high winning ratio with over 20 years of backtesting  The recommended time frame is М1 and the expiration time is 3, 5 minutes. The indicator suitable for Auto and Manual trading. A possible signal is specified as a arrows above/under a candle. You can entry current candle /intrabar or can wait until candle close Arrows are not re-painted Trade sessions: Any/ Rec
Risk Reward ratio indicator for MT4  BING Risk Reward indicator is a powerful, basic, very needed tool for every trader. Clearly visualize Open Price , Stop Loss , and Top Profit levels on your graphs with easy-to-see colors and trendlines. Does BING Risk Reward show alerts? Of course! BING Risk Reward Indicator offers all Alerts available for the MT4 platform(Email, Popups, Sound, and Push). It shows alerts on Open Price , Stop Loss , and Top Profit. That way, besides easily seeing what is go
API TicksVolume mtf -  Volume Analysis for Trading The API TicksVolume mtf indicator is a tool for traders who want tick volume analysis to make trading decisions. Designed for MetaTrader 4 , this multi-timeframe (MTF) indicator provides  tick volume data with color-coded visual cues , helping traders assess volume strength and possible volume direction across different timeframes. Key Features: Multi-Timeframe Analysis: Monitor tick volume from different timeframes in real time for a broader
Automatic, live & interactive picture of all trendlines. Assign push, email and sound alerts to the lines of your choice and be informed about price rollback, breakout, rollback after breakout, number of rollbacks, line expiration by double breakout. Correct, drag or delete the lines and interactively tune the line system. https://youtu.be/EJUo9pYiHFA . Chart examples https: //www.mql5.com/en/users/efficientforex Price Interaction Events All events are effective immediately and only after one
The indicator displays the probable ( Support and resistance ) levels. The indicator draws horizontal and trend levels of support and resistance. The indicator settings: Trends - the mode for displaying trend lines or horizontal lines of support and resistance Yes - display trend lines only No - display horizontal lines only UseResource - use the resources built into the indicator. Yes - use the ZigZag indicator from the resources of the product. No - use a custom ZigZag indicator. HistoryBar -
The indicator of a Professional Trader is an arrow indicator for predicting the direction of price movement. I have been working on this indicator since 2014. You can use this indicator as your main indicator, use its entry signals, and use it as your only indicator to find entry points. About the product: Recommended TF [H4-D1-W1]   . The indicator predicts the direction of the next candle. Fits a variety of tools; Flexibility in settings for different instruments and intervals through the MO
The [GRAFF] III manual trading system is based on multiple MetaTrader (MT4) indicators. Together, the entire PACK of GRAFF III indicators makes an advanced trading tool. The system consists of over 20 different custom-built indicators which have been carefully selected and tested in the long term to produce strong and efficient trading signals. The particular indicators are based on different mathematical formulas, so the entire system is calibrated to remove false signals from its own indicator
This indicator allows you to see the strength of the trend on all timeframes. It can be used for all currency pairs. The indicator can be displayed in the form of a column (from left to right): status buy / sell / strong buy / strong sell, strength of the trend in percentage, pips last candle, body candle now, remaining time, and the timeframe of M1 to MN. Information contained below (from left to right): total trend percent, sell percent, buy percent.
You can fins our other products from link : https://www.mql5.com/en/users/drbastem/seller   Also, you can ask all your questins from email : haskayafx@gmail.com or mobile : +90 530 867 5076 or @MehmetBastem    on telegram application This indicator is used to determine the trend. Standard Osma indicator is used. It has the indicator warning system: beep, e-mail and has three types of alerts, including messages to mobile phone. It shows the best performance on the chart of 5 minutes. When the
You can fins our other products from link : https://www.mql5.com/en/users/drbastem/seller   Also, you can ask all your questins from email : haskayafx@gmail.com or mobile : +90 530 867 5076 or @MehmetBastem    on telegram application This indicator is used to determine the trend. Standard Three Moving Average and ADX indicators are used. It has the indicator warning system (audio, e-mail) and three types of alerts, including messages to mobile phone. It shows the best performance on M5. When
This indicator is used to determine the trend. Standard Three Moving Average and ADX indicators are used. It has the indicator warning system (audio, e-mail) and three types of alerts, including messages to mobile phone. It shows the best performance on M5. When the trend value reaches the value set, the warning system is activated. This indicator works only with Forex symbols. Inputs SoundAlarm = true - Sound Alert Sendmail=true - Send an e-mail in case of a buy or sell signal Sendnotification
You can fins our other products from link : https://www.mql5.com/en/users/drbastem/seller   Also, you can ask all your questins from email : haskayafx@gmail.com or mobile : +90 530 867 5076 or @MehmetBastem    on telegram application This indicator is used to determine the trend. Standard MACD indicator is used. It has the indicator warning system: beep, e-mail and has three types of alerts, including messages to mobile phone. It shows the best performance on the chart of 5 minutes. When the
Smooth price for Monarch MT4
Konstantin Gruzdev
3.67 (3)
The Smooth Price technical indicator is used for plotting a smoothed line as close to the price of the financial instrument as possible, and serves to eliminate its noise components. The indicator is part of the Monarch trading system, but here it is presented as an independent technical analysis tool. The indicator is based on the cluster digital filter , which, unlike the ClusterSMA , is applied directly to the price time series. Smooth Price does not redraw (except the very last, zero bar) an
A simplistic indicator informing a user on RSI divergence by sending messages to mobile device and email. The indicator draws 2 vertical lines, marking two RSI extrema that formed the divergence. You get the alert, open the charts and make a decision. The indicator does not show past divergences, thus when you attach it to a chart for the first time you see nothing. Graphics and alerts will appear as soon as divergences do. Drop it in Tester to see how it works. Parameters: RSIPeriod - number of
ZLevels
Sergio Andres Zuleta Lopez
This indicator is based on Market Profile methodology, which contains the Z-Zone , unlike the latter, allows visualization of multiple time frames on the same graph. This methodology has proven to be very effective for: Reduce the number of windows required to analyze or track a financial asset. Display important resistance areas (ROZ), support (SoZ) and average distribution (PoC) in different periods of time. Define areas to take profits as well locate technical stop loss. Analysis in the devel
Pan PrizMA CD Phase is an analogue of the МetaТrader 5 indicator , and is an option based on the Pan PrizMA indicator. Details . Averaging by a quadric-quartic polynomial increases the smoothness of lines, adds momentum and rhythm. Extrapolation by the sinusoid function near a constant allows adjusting the delay or lead of signals. The value of the phase - wave status parameter (which is close in meaning to the trigonometric phase or the angle of the radius-vector rotation in the trigonometric p
Green Wall Arrows
Daniel Luchinger
1 (1)
The Name Green Wall : Arrows hits a lot of TP, by changing the idea of non using SL as something bad, but instead use Small TP and a lot of free Margin and Patience. Use micro TP and a lot of Free Margin with this indicator on Forex. It also can be used with Binary Options. This strategy is intended to be traded Manually. This Indicator runs on Open Bar, arrows will delete when price are against it. The only Indicator Parameter is Alerts true/false, all the rest is included inside the code. Arro
Golden Monowave
Ahmed Mohamed Ali
Golden Monowave is monowave indicator, the monowave theory is one of Elliott wave approach and one of most complicate and accurate method. Golden Monowave can shortcut many major steps to identify and describe the monowave. It works on any timeframe and with any trading instrument, including currencies, indices, futures, etc. Input Parameters initial_Bars - set the initial number of bars to calculate. wave_color - select the color of the wave. label_color - select the color of labels. temp_labe
Shark Surfer is a new generation indicator applying a well-established trend-following trading. The product is good both for scalping, as well as medium- and long-term trading. Shark Surfer analyzes a selected symbol and shows the recommended market entry, take profit and stop loss levels. Shark Surfer trades on all symbols and timeframes. It also features email and push notifications concerning the new trading signals. The indicator searches for suitable market entry points on an already formed
Ticks Size
Viktor Kolmakov
This indicator displays in a separate window the difference between the number of points which increased the price, and the number of points that decreased the price during the time interval specified in the settings. The time interval for calculation is expressed as the number of bars of the chart the indicator is attached to. This approach allows you to evaluate the movement direction (growth or fall) of the instrument's price, the strength of the movement and the size of the movement in point
More from author
Sense
Ivan Stefanov
5 (2)
SENSE is an automated fusion of  GANN target levels combined with fractal trend support lines. Mighty powerful combination. The system tells us where to open and close our trades. No redrawing.  No more wasting time on complex calculations— SENSE does it all for you. Just insert the indicator. Key Principles: Market is bullish when price is above the white lines - Buy above the white lines, stop below - Green lines are bullish targets Market is bearish when price is below the white lines - S
Imbalance Pro
Ivan Stefanov
5 (3)
The indicator measures the imbalance between bulls and bears over a chosen period and shows a straight line in color between the two points right on your chart. Additionally indicator's window shows how exactly the volume developed in time. If the bulls have more volume than the bears, the line turns green.  If the bears have more volume, it is red. The line also shows the percentage difference in volume. Adjustable alert available.  Using volume imbalance in Forex trading can be a powerful
Meravith
Ivan Stefanov
The indicator analyzes volume from every point and calculates exhaustion market levels for that volume. It consists of three lines: - Bullish volume exhaustion line - Bearish volume exhaustion line - A line indicating the market trend. This line changes color to reflect whether the market is bearish or bullish. You can analyze the market from any starting point you choose. Once a volume exhaustion line is reached, identify a new point from which to start your next analysis. How to use it: Do
GANN Master
Ivan Stefanov
5 (1)
Master GANN’s precise targets are calculated based on his time-tested methods and presented right in front of you. This tool is designed to make trading smoother and more intuitive. By adjusting the white line upwards or the green line downwards, you’ll immediately see the reason GANN's techniques remain influential in the world of trading. GANN’s strategies revolve around predicting market movements with a high degree of accuracy, and this tool brings that power to your fingertips. Whether you’
This is the indicator for the biggest money.  It's performance is exceptional. Whatever interest there is in the market you will see it.  In almost all cases it will only give you a long term view of the market, but don't be fooled into thinking this is event bound. Nothing like that. It finds where the biggest interest is in the market and shows it to you. Do not forget that the biggest money (interests)  not shown on the market everyday . That's something you haven't encountered.The price is
This indicator is based on practical experience.  Insert the date/time of your top/bottom. It calculates the most visited level from top/bottom up to the current moment. It updates automatically with each new candle. You can simultaneously use multiple indicators for different trends and timeframes. The length is always plotted from the beginning of your period to the present. Recommendations: Currency pair: All pairs, all markets Timeframe: All timeframes Minimum deposit : No minimum deposi
FREE
Fifty Pro
Ivan Stefanov
5 (1)
One of the very few indicators that calculate levels solely based on price. The indicator is not affected by time frames, trends, or market cycles. One of the most logical indicators ever made. The FIFTY indicator now comes in an automated version, removing the need for manual level drawing. This version automatically plots daily, weekly, monthly and yearly levels on the chart, ensuring accuracy and saving time. Additionally, buttons are provided for toggling the visibility of these levels, off
Separated Volume
Ivan Stefanov
5 (1)
This indicator effectively separates the tick volume in the forex market into bullish and bearish categories. Additionally, it provides the functionality to calculate and display the sum of bullish and bearish tick volumes for any selected period of your choice. You can easily adjust the period by moving the two blue lines on the chart, allowing for customizable and precise volume analysis tailored to your trading needs. If you find it usefull your reviews will be appreciated! Happy trading!
FREE
Two Snakes
Ivan Stefanov
5 (2)
2 SNAKES  is a first class scalping system. As the entries are quite precise, you are likely to become addicted to this system very quickly.  You have 2 snakes. When you see a candle above or below them that does not touch them - that is your scalping signal. Then buy or sell at the green line or close. If you use a larger time frame, scalping can become trend following. The snakes are calculated precisely in relation to the current state of the market. They ARE NOT moving averages.  You decide
Levelss
Ivan Stefanov
5 (1)
The LEVELSS indicator shows: - Daily bullish and bearish zone. It is visible everyday from 00:00 to 23:59.  - The weekly bullish and bearish zone. It is visible from Monday 0:00 to Friday 23:59 every week. - Specially calculated channel from a specific timeframe that is displayed on all other timeframe. By default, this is the 4-hour timeframe that you can change to whichever other timeframe you wish to trade. It is calculated non-stop. At the top left of the screen there is an indication of t
ENIGMERA: The core of the market Introduction This indicator and trading system is a remarkable approach to the   financial markets . ENIGMERA uses the fractal cycles to accurately calculate support and resistance levels.   It shows the authentic accumulation phase and gives direction and targets.    A system that works whether we are in a trend or a correction.   How It Works Most of the indicator’s functionality is controlled through buttons on the left side of the chart, allowing rapid res
Filter:
TANJU2690
474
TANJU2690 2025.03.05 13:37 
 

I have never and ever seen any system like Enıgmera. What ever you want, you can find on it. İt is incredible system. And Cretor of aenıgmera, Mr.Ivan is more and more helpfull to understant of logıc Enigmera. Fistly, I want sent all thankfull to Ivan because he teach me Enıgmera Logıc and also share this marvelous product with market

smso9466eiou
90
smso9466eiou 2025.02.23 15:38 
 

a very good indicator that composes all in one, entry, exit and reverse. Great!

Ivan Stefanov
2843
Reply from developer Ivan Stefanov 2025.02.23 18:12
Thank you! Wishing you profits!
Rutt Tungkiratichai
1895
Rutt Tungkiratichai 2025.02.01 00:11 
 

This is very good and accurate indicator.

Ivan Stefanov
2843
Reply from developer Ivan Stefanov 2025.02.01 11:30
Thank you for the good words! Brgds / Ivan
Osazeme Usen
472
Osazeme Usen 2024.12.31 12:38 
 

This is probably the best indicator I have seen in marketplace. Fantastic analysis with phenomenal success rates.

Update: Not great for direction, but fantastic for TP and SL.

Ivan Stefanov
2843
Reply from developer Ivan Stefanov 2025.01.02 16:45
Osazeme Usen 2024.12.31 12:38 # EN
This is probably the best indicator I have seen in marketplace. Fantastic analysis with phenomenal success rates. Thank you for the good words! Brgds/Ivan
vincenzo1964
989
vincenzo1964 2024.07.11 15:59 
 

Assolutamente straordinario a cominciare da chi l'ha ideato Ivan, Sono assolutamete felice dell'affito/prova fatto, Enigmera è sorprendente, ti accompagna sempre sul lato giusto della tendenza sino alla fine del percorso. Se poi parliamo del dott. Ivan e della sua disponbilità, se potessi postare gli screenshot e la guida passo passo che mi ha concesso, è commovente e sorprendente. Se volete fare buon trading con giudizio e responsabilità potete tranquillamente perdere qualche giorno del vostro tempo a capire la logica ed il ragionamento che c'è dietro enigmera, solo così sarete sempre dal lato giusto del trend sino alla fine, sopratutto quando ci sono le news ed enigmera già vi sta indicando i livelli di tp da raggiungere. Proprio oggi ero già lon su eurusd e sell su usdchf ed entrambe dopo le notizie chiuse in tp. Consiglio anche l'indicatore Speed, leggetene l'utilizzo, la forza e ciò che vi può indicare, io ci sto lavorando sodo seguito da ivan perchè l'unione di enigmera e speed è devastante, alla fine dell'affitto acquisterò engmera mentre affitterò mensilmente speed (il costo è di 30.00€ mentre l'acquisto è di 3000€), ma il suo potenziale per il trend followhing e immenso, saluti e buon trading a tutti, grazie Ivan...

Irfan
1332
Irfan 2024.06.21 13:44 
 

User didn't leave any comment to the rating

Ivan Stefanov
2843
Reply from developer Ivan Stefanov 2025.01.02 16:46
Irfan 2024.06.21 13:44 # EN
Enigmera gives you an entirely different way of looking at the market. It does not look into the past, what has happened in the past stays in the past it gives you a picture of what is going on in the market right now and gives you logical understanding for trading. The author is so confident about his product the he gave me a full version of the indicator so that I could try it for a week before I decided to buy it. Ivan spent a lot of time chatting with me, educating me how to use the indicator. He is very quick and replies to your questions. I have already seen good results with this indicator and it has increased my confidence. Thank you for the good words, Irfan!
Sajid Iqubal
183
Sajid Iqubal 2024.06.08 21:59 
 

Enigmera is an exceptional trading indicator that has greatly improved my trading performance. Ivan Stefano offers the best support and guidance, always going above and beyond like an elder brother to me. His guidance and the effectiveness of Enigmera make a winning combination. I highly recommend using Enigmera.

eman11
1119
eman11 2023.11.22 20:29 
 

User didn't leave any comment to the rating

Ivan Stefanov
2843
Reply from developer Ivan Stefanov 2025.01.02 16:47
eman11 2023.11.22 20:29 # EN
I was an institutional trader for a decade and rarely write reviews or spend more then 50 or a 100 on any indicator as my trading is well established, but always open to something interesting and new. The author is an intelligent and real trader , per many chats with him, and this indicator compliments well existing trading as is from a unique perpective. The price is not cheap , but it it is a legit and unique system, is as decribed, which can be put to good use particulalry with experienced traders who may best integrate multiple styles and ideas successfully. Great work Ivan. Thank you for the good words, Eman11 / Brgds / Ivan
ebel
1221
ebel 2023.11.22 14:41 
 

This indicator is undoubtedly expensive but I believe it to be the Ferrari of indicators and the only one you will ever need. The video in the overview is self explanatory, take the time to find the setups as described and the R:R can be extremely good. I have only been using the indicator for a week but have found several very profitable trades and feel confident that I can make back more than sufficient each month to cover my 6 monthly rental. The author is extremely responsive and helpful and is starting a telegram group so that we can share prospective setups. I believe the indicator is difficult to get to work in Strategy Tester but the author is open to free trials which demonstrates his trust in the product. I can't post images here but I will post a trade I made this morning in the comments. I can't promise it is the perfect setup as I am still learning but just this one trade covered my monthly rental cost. IMPORTANT - do not try to change to a lower timeframe while the indicator is loaded. The code is incredibly complex and trying to recalculate everything on a lower tf over a significant period will freeze your MT4 installation. You will need to delete the indicator from your MT4, force a shut down, restart and re-install. Once you understand the complexity it is not a problem, just open another chart on a lower tf or delete the indicator, change the tf and put it back on.

UPDATE 23/11

I have just seen that the author has been debarred from selling! I have just paid for 6 months rental and this is a good indicator that is making me money. What to I do after 6 months if I can't renew? And why has this happened, the author is very courteous and helpful.

Reply to review
Version 3.3 2025.04.02
MInor improvement
Version 3.2 2025.03.08
What's new in ver. 3.2?

1. There are two new buttons:

- 2xTgt - Double Target
- 3xTgt - Triple Target

This creates price movement channels that you can trade.


2. The indicator now allows defining deviations for the volume points. By default, the blue point represents two deviations of the average volume, and the purple one represents three. You can currently change them. For example, 1.5 or 1 will give you more points on the chart. You can even use values smaller than 1.

Application: By default, the considered volume deviations are 2 and 3, which represent a significant deviation in volume. If the market is not as volatile, the volume may be more uniform and not have such extreme values. However, the bullish or bearish volume is still larger, even though it might not have such large values. When you reduce the deviations, you will get points on the chart where the volume still shows deviations in one direction or the other, even if the deviations are not as large. This indicates which direction the market is inclined to move.


3. An option has also been added that allows you to reposition the buttons up or down, enabling the indicator to avoid overlapping with other indicators on the chart that may be located in the same place.
Version 3.0 2025.02.19
The indicator has been completely rewritten.

All functions are displayed as buttons on the chart, ensuring quick responsiveness during trading. The right tool at the right moment.
Second and third deviations have been added.
Volume analysis has been added.
A signal when the target line is reached.
Automatic color change of the indicator, resulting in new themes being applied automatically.
Version 2.60 2025.01.12
Version 2.60

In the new version, the indicator automatically assigns the next identifier number. This allows you to add as many indicators as you want to your charts without mixing the buffers of individual indicators, ensuring the indicator's position remains unaffected. Previously, this was done manually.
Version 2.50 2025.01.04
Good new functionality added.

1. First bullish and and first bearish deviation lines

The first deviation line in Enigmerа refers to measuring the deviation of the price from its average value, that is, how much the price has deviated from the support line.
High deviation indicates high volatility, while low deviation indicates stability.

Traders use this information to determine entry and exit points. For example, in high volatility, breakout strategies can be applied, while in low volatility – range trading strategies.
Sensitivity to Anomalies: Single sharp movements can distort the calculation of deviation.

2. Support channel of two additional optional support lines (a bearish and bullish)
Version 2.40 2024.12.26
Two new lines added to Enigmera in ver. 2.4
These are the first bullish and bearish deviations of the support line.

If the price primarily moves between the Enigmera line and its 45 deg lines, the market is in consolidation or sideways movement, which does not indicate a clear trend.

What is the difference between 45 deg line and Single deviation line?
45 deg lines defines the trend. If below non-sustainable, if over strong, if alongside the 45 deg line - sustainable.

Deviation line defines the acceptable distance whithin we consider lack of trend.
Outside the first devition is a trend sign, and it is simply because the market reached a new land.

The first standard deviation often acts as a boundary for normal price fluctuations around this average value.
Version 2.30 2024.10.07
- Bugs removed.
- 50% target line added. Be default is off.
- Non-Enigmera functionality removed.

Generally better performance.
Version 2.24 2024.08.06
More friendly labels.
Version 2.23 2024.06.18
The update is quite important. The convenience is undeniable:

- Just add the indicator to the chart. It is no longer necessary to enter the date and time.
- Putting a top or bottom is done by pulling and dragging the indicator.
- Reestimation of the trend is much more faster.

Enjoy!
Version 2.1 2024.06.09
- Warning when target is reached
- Line labels added. On/Off option
- Warning if indicator is not placed correctly
- Indicator identifier (when using more than one indicator on a graphic)
Version 2.0 2024.06.02
1. Elliott channel added. You can now use any timeframe you wish for the Elliott channel. By default it is 4 hours. This can make your counting easier.
2. Added Auto Fibonacci time zones. This can also facilitate your counting.
3. Auto 50% line added. Significant for any level of movement.
4. There is an option to limit the number of candles the indicator calculates. The default is 377. This number is sufficient to measure most movements. You can change it according to your ideas.
5. The non-response due to mass fractal calculations when going from high to low time frame has been eliminated. No longer a problem.
6. Faster performance by optimising the code.
7. Added options for colours and lines.
8. Added identifier. If you want to use the indicator several times on a chart, it is a good idea to use a new identifier for each instance. This way the indicator will use different buffers for each instance.
9. Some changes to the interface. Target lines have been made bold to make them more important and to attract attention.
Version 1.3 2024.01.05
In the new version following
trend assesment instruments added:

- Angle 45 degrees line
- 45 deg deviation lines