Additional Plot of EMA-200 not showing - MQL5


Hi everyone,

before you throw the handbook on me and send me away, please, I confirm that I have tried and done all the research possible. Maybe I have a simple misunderstanding in my edited code, but I can't figure it out alone.

1.) i took the ALMA Indicator V2 and all I wanted to do is to add the EMA-200. I know I can do that by adding a second indicator into the chart, but I want to further use the EMA-200 inside the code to confirm the trend and create some sort of alerts or Buy and sell Errors when the ALMA Trend changes. I do this to verify a strategy before I move on to creating an EA.

2.) the basic ALMA Indicator works well, but when I try to add the iMA(_symbol, Current_timeframe, 200, ..... ) handle and do all the steps necessary to get the data into an array, the plot does not show.
In fact, it kills both, the alma trend plot and the EMA 200 plot.

3.) I did mend all the copyBuffer errors on my own, so the array sizes etc. all fit.

4.) I checked and most awkwardly the indicator counts from latestbar = index of total_rates-1... and first bar on the left in the chart is obviously array[0]

5.) I did set the ArrayAsSeries(EMALine,FALSE) - as this seemed to work.

6.) I plotted the top right (latest) ALMA and EMA Values on a comment in the left top corner - this ist to verify if actually Data is inside the array.

7.) when removing the Alma and replacing it by the EMA line: nothing happens. It's like as if there was no data to be plotted.

8.) I noticed that also the short-name    PlotIndexSetString(0,PLOT_LABEL,"ALMA_v2["+timeframeToString(TimeFrame)+"]");

   PlotIndexSetString(1,PLOT_LABEL,"EMA_["+IntegerToString(inpEMAPer)+"]");

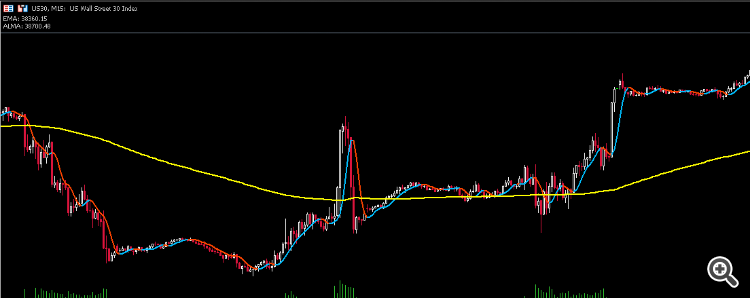
fails. As shown in the screenshot, both plots show the same name. What the heck is happening here?


9.) I don't know where to look for the error. Is it in the top OnInit section by setting the buffers? Or is the error in filling in the data via a ForLoop and byCopyBuffer ?

10.) I highlight the added stuff in yellow

Please help! Or at least could you point me to an indicator that has set this right? I did code indicators in the past, also from the scratch, so I don't really understand why I fail with this one. But obviously reverse-engineering and adding stuff is not easy.

THANK YOU!

//+------------------------------------------------------------------+
//|                                                      ALMA_v2.mq5 |
//|                   ALMA by Arnaud Legoux / Dimitris Kouzis-Loukas |
//|                                             www.arnaudlegoux.com |
//|                         Written by IgorAD,igorad2003@yahoo.co.uk |
//|            http://finance.groups.yahoo.com/group/TrendLaboratory |
//+------------------------------------------------------------------+
#property copyright ""
#property link      ""
#property description "Adapted ALMA Indicator including the EMA-200 2024"

#property indicator_chart_window
#property indicator_buffers 5
#property indicator_plots   2

#property indicator_type1   DRAW_COLOR_LINE
#property indicator_color1  Silver,DeepSkyBlue,OrangeRed
#property indicator_width1  2
#property indicator_label1   "EMA"

#property indicator_type2   DRAW_COLOR_LINE
#property indicator_color2  clrAquamarine
#property indicator_width2  2
#property indicator_style2  STYLE_DASH

input ENUM_TIMEFRAMES      TimeFrame   =     0;
input ENUM_APPLIED_PRICE   Price       = PRICE_CLOSE; //Apply to
input int                  Length      =     9;       //Window Size
input double               Sigma       =   6.0;       //Sigma parameter
input double               Offset      =  0.85;       //Offset of Gaussian distribution (0...1)
input int                  Shift       =     1;       //Shift in Bars
input int                  inpEMAPer   =   200;       //EMA Period
input int                  ColorMode   =     1;       //Color Mode(0-off,1-on)

double  alma[];
double  trend[];
double  price[];
double  EMALine_BUF[];
double  EMALine[];

ENUM_TIMEFRAMES  tf;
int      mtf_handle, Price_handle, barsTotal, ema_handle;
bool     runonce;
double   W[], mtf_alma[1], mtf_trend[1];
//+------------------------------------------------------------------+
//| Custom indicator initialization function                         |
//+------------------------------------------------------------------+
void OnInit()
  {
   if(TimeFrame <= Period())
      tf = Period();
   else
      tf = TimeFrame;
//--- indicator buffers mapping
   SetIndexBuffer(0,alma, INDICATOR_DATA);
   SetIndexBuffer(1,EMALine,INDICATOR_DATA);
   SetIndexBuffer(2,trend, INDICATOR_COLOR_INDEX);
   SetIndexBuffer(3,price,INDICATOR_CALCULATIONS);
   SetIndexBuffer(4,EMALine_BUF,INDICATOR_CALCULATIONS);


//---
   PlotIndexSetInteger(1,PLOT_LINE_COLOR,clrAquamarine);
   PlotIndexSetInteger(1,PLOT_DRAW_TYPE,DRAW_COLOR_LINE);
   PlotIndexSetInteger(1,PLOT_LINE_WIDTH,2);
   PlotIndexSetInteger(1,PLOT_LINE_STYLE,STYLE_DASH);

//---
   PlotIndexSetInteger(0,PLOT_COLOR_INDEXES,3);
   PlotIndexSetInteger(0,PLOT_DRAW_BEGIN,Length+1);
   PlotIndexSetInteger(1,PLOT_DRAW_BEGIN,Length+1);
//---
   PlotIndexSetInteger(0,PLOT_SHIFT,Shift);
   PlotIndexSetInteger(1,PLOT_SHIFT,Shift);
//---
   IndicatorSetInteger(INDICATOR_DIGITS,_Digits);
//---
//   string short_name = "ALMA_v2["+timeframeToString(TimeFrame)+"]("+priceToString(Price)+","+(string)Length+","+(string)Sigma+","+(string)Offset+")";
   string short_name = "ALMA_v2";
   IndicatorSetString(INDICATOR_SHORTNAME,short_name);
   PlotIndexSetString(0,PLOT_LABEL,"ALMA_v2["+timeframeToString(TimeFrame)+"]");
   PlotIndexSetString(1,PLOT_LABEL,"EMA_["+IntegerToString(inpEMAPer)+"]");

//---
   Price_handle = iMA(_Symbol,TimeFrame,1,0,0,Price);
   ema_handle   = iMA(_Symbol,PERIOD_CURRENT,inpEMAPer,0,MODE_EMA,PRICE_CLOSE);


   if(TimeFrame > 0)
      //mtf_handle = iCustom(NULL,TimeFrame,"ALMA_v2",0,Price,Length,Sigma,Offset,Shift,ColorMode);
      mtf_handle=iMA(_Symbol,PERIOD_CURRENT,inpEMAPer*2,0,MODE_EMA,PRICE_CLOSE);  // THATS JUST FOR THE SAKE OF BACKTESTING. the above ICustom works fine, but can't be backtested!
   else
     {
      ArrayResize(W,Length);

      double m = MathFloor(Offset*(Length - 1));
      double s = Length/Sigma;
      double wSum = 0;
      for(int i=0;i < Length;i++)
        {
         W[i] = MathExp(-((i-m)*(i-m))/(2*s*s));
         wSum += W[i];
        }

      for(int i=0;i < Length;i++)
         W[i] = W[i]/wSum;
     }

   barsTotal = iBars(_Symbol, PERIOD_CURRENT);
   ArraySetAsSeries(EMALine_BUF,false);
   ArraySetAsSeries(EMALine,false);

   runonce = false;
   ChartSetString(0, CHART_COMMENT, "");

   Print("ALMA INDICATOR INITIALIZED");
//--- initialization done
  }


//+------------------------------------------------------------------+
//|                                                                  |
//+------------------------------------------------------------------+
void OnDeinit(const int reason)
  {
   if(Price_handle!=INVALID_HANDLE)
      IndicatorRelease(Price_handle);
   if(ema_handle!=INVALID_HANDLE)
      IndicatorRelease(ema_handle);
   ChartSetString(0, CHART_COMMENT, "");

   Print("Indicator \"ALMA\" stopped");

  }


//+------------------------------------------------------------------+
//| Custom indicator iteration function                              |
//+------------------------------------------------------------------+
int OnCalculate(const int rates_total,const int prev_calculated,
                const datetime &Time[],
                const double   &Open[],
                const double   &High[],
                const double   &Low[],
                const double   &Close[],
                const long     &TickVolume[],
                const long     &Volume[],
                const int      &Spread[])
  {
   int x, y, shift, limit, mtflimit, copied = 0;
   datetime mtf_time;


//-- CHECK ON NEW BAR
   int bars = iBars(_Symbol, PERIOD_CURRENT);
   if(barsTotal != bars)
     {
      barsTotal = bars;
      ChartSetString(0, CHART_COMMENT, "EMA: "+DoubleToString(EMALine[rates_total-1],_Digits) + "\n" +
                     "ALMA: " + DoubleToString(alma[rates_total-1],_Digits));


     }//---END CHECK OF NEW BAR done


//--- preliminary calculations
   if(prev_calculated == 0)
     {
      limit  = 0;
      mtflimit = rates_total - 1;
      ArrayInitialize(alma,EMPTY_VALUE);
      ArrayResize(EMALine,mtflimit+1);
      ArrayInitialize(EMALine,EMPTY_VALUE);
     }
   else
     {
      limit = rates_total - 1;
      mtflimit = rates_total - prev_calculated + PeriodSeconds(tf)/PeriodSeconds(Period());
     }
   copied = CopyBuffer(Price_handle,0,Time[rates_total-1],Time[0],price);

   if(copied < 0)
     {
      Print("not all prices copied. Will try on next tick Error =",GetLastError(),", copied =",copied);
      return(0);
     }

   if(CopyBuffer(ema_handle,0,Time[rates_total-1],Time[0],EMALine_BUF) < 0)
      Print("EMA_BUFFER_COPY ERROR: ",GetLastError());


//--- the main loop of calculations
   if(tf > Period())
     {
      ArraySetAsSeries(Time,true);

      for(shift=0,y=0;shift<mtflimit;shift++)
        {
         if(Time[shift] < iTime(NULL,TimeFrame,y))
            y++;
         mtf_time = iTime(NULL,TimeFrame,y);

         copied = CopyBuffer(mtf_handle,0,mtf_time,mtf_time,mtf_alma);
         if(copied <= 0)
            return(0);
         x = rates_total - shift - 1;
         alma[x] = mtf_alma[0];

         if(ColorMode > 0)
           {
            copied = CopyBuffer(mtf_handle,1,mtf_time,mtf_time,mtf_trend);
            if(copied <= 0)
               return(0);
            trend[x] = mtf_trend[0];
           }
         else
            trend[x] = 0;
        }
     }
   else
     {
      for(shift=limit;shift<rates_total;shift++)
        {
         if(shift < Length)
            continue;
         double sum = 0.0;
         for(int i = 0; i < Length; i++)
            sum += price[shift-(Length - 1 - i)]*W[i];

         alma[shift] = sum;

         if(shift < Length + 2)
            continue;

         if(shift > 0)
           {
            if(ColorMode > 0 && alma[shift-1] > 0)
              {
               trend[shift] = trend[shift-1];
               if(alma[shift] > alma[shift-1])
                  trend[shift] = 1;
               if(alma[shift] < alma[shift-1])
                  trend[shift] = 2;
              }
            else
               trend[shift] = 0;
           }
        }
     }
//ArrayReverse(EMALine_BUF,WHOLE_ARRAY);
// I thought, maybe I limit it down to 1000 to save resources, but still no plot
   for(shift=rates_total-1000;shift<rates_total;shift++)
     {
      EMALine[shift] = EMALine_BUF[shift-1];

     }

   if(!runonce)
     {
      Comment("EMA: "+DoubleToString(EMALine[rates_total-1],_Digits) + "\n" +
              "ALMA: " + DoubleToString(alma[rates_total-1],_Digits));

      runonce = true;
     } // -- END RUN ONCE

   return(rates_total);
  }
//+------------------------------------------------------------------+
string timeframeToString(ENUM_TIMEFRAMES TF)
  {
   switch(TF)
     {
      case PERIOD_CURRENT  :
         return("Current");
      case PERIOD_M1       :
         return("M1");
      case PERIOD_M2       :
         return("M2");
      case PERIOD_M3       :
         return("M3");
      case PERIOD_M4       :
         return("M4");
      case PERIOD_M5       :
         return("M5");
      case PERIOD_M6       :
         return("M6");
      case PERIOD_M10      :
         return("M10");
      case PERIOD_M12      :
         return("M12");
      case PERIOD_M15      :
         return("M15");
      case PERIOD_M20      :
         return("M20");
      case PERIOD_M30      :
         return("M30");
      case PERIOD_H1       :
         return("H1");
      case PERIOD_H2       :
         return("H2");
      case PERIOD_H3       :
         return("H3");
      case PERIOD_H4       :
         return("H4");
      case PERIOD_H6       :
         return("H6");
      case PERIOD_H8       :
         return("H8");
      case PERIOD_H12      :
         return("H12");
      case PERIOD_D1       :
         return("D1");
      case PERIOD_W1       :
         return("W1");
      case PERIOD_MN1      :
         return("MN1");
      default              :
         return("Current");
     }
  }

//+------------------------------------------------------------------+
//|                                                                  |
//+------------------------------------------------------------------+
string priceToString(ENUM_APPLIED_PRICE app_price)
  {
   switch(app_price)
     {
      case PRICE_CLOSE   :
         return("Close");
      case PRICE_HIGH    :
         return("High");
      case PRICE_LOW     :
         return("Low");
      case PRICE_MEDIAN  :
         return("Median");
      case PRICE_OPEN    :
         return("Open");
      case PRICE_TYPICAL :
         return("Typical");
      case PRICE_WEIGHTED:
         return("Weighted");
      default            :
         return("");
     }
  }

//+------------------------------------------------------------------+

//+------------------------------------------------------------------+

//+------------------------------------------------------------------+
 

I think I found the source of the problem. 

When you use DRAW_COLOR_LINE, the corresponding color mapping buffer usually has to be the next buffer number in sequence. So I changed the buffer indexes:

SetIndexBuffer(0,alma, INDICATOR_DATA);
SetIndexBuffer(1,trend, INDICATOR_COLOR_INDEX);  
SetIndexBuffer(2,EMALine,INDICATOR_DATA);

SetIndexBuffer(3,price,INDICATOR_CALCULATIONS);
SetIndexBuffer(4,EMALine_BUF,INDICATOR_CALCULATIONS);


Also, if you're only using one color on the 200 EMA then you should rather use DRAW_LINE instead of DRAW_COLOR_LINE, otherwise you'll have to create another color mapping buffer.


Files:
Reason: