Flummoxed: unless you can find a problem with this code, MQL5 has a serious bug
It's always tedious to work with historical datas, as datas are never "perfect". It's about history quality.
For example, if you browse at first bars of a chart (EURUSD/H1), you gonna find 24 * H1 bars replaced by 1 * D1 bar. I suppose there's likely an asynchronism with the terminal drawing H1 bars but bars being not of 1H long.
... consequently, moving average calculated on the basis of those "summed up" bars will be wrong ...
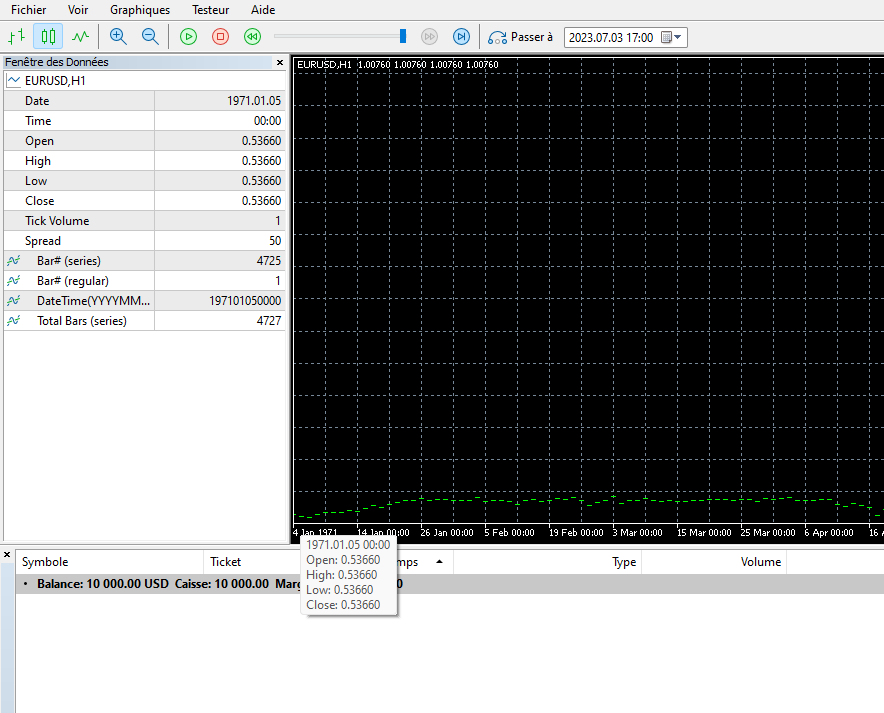
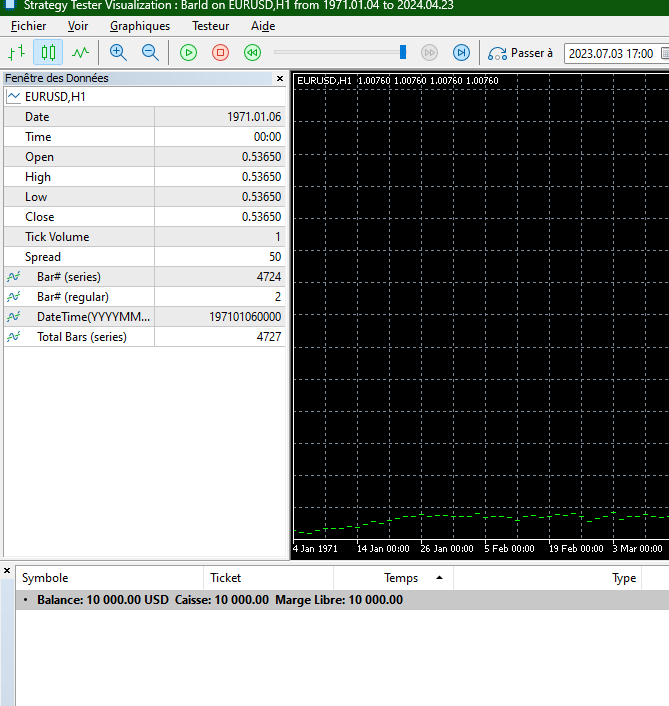
I have a simple indicator that I use a lot in coding and testing, called BarID. Its intent is: for any bar you point to on a chart, to give you both its AsSeries = true and AsSeries = false index values, along with the best I could do to show its date and time, given all that's available are type double data in the Data Window.
All is well at the current end of the chart. The current bar shows as 0 (as series = true) and as rates_total - 1 (as series = false). The (double) bar date and time match the built-in Date and Time of the Data Window.
Cool, it works.
But not at the back end.
I'm testing it on a USDJPY M15 chart.
Hit the Home key to go back to the oldest end of the chart. Everything is initially hunky-dory. The oldest bar shows 0 (as series = false) and rates_total - 1 (as series = true).
Until you move the mouse around.
I suggest moving the mouse cursor completely off the chart and then back, then point at the leftmost bar and see how the readouts have changed. Date and Time match the Data Window's Date and Time, the "Total Bars" is unchanged, the same value as rates_total, since every element in its buffer is set to rates_total. But the "Bar# (series)" and "Bar# (regular)" switched all on their own. The leftmost bar on the chart now shows that magic 99,999 for "Bar# (series)", and 79 or 80 for "Bar# (regular)" (I guess that probably depends on how far beyond 99,999 rates_total is.)
Out of the blue.
Just as an FYI, I've abandoned all the i____ functions, (e.g., iTime(), iBars(), iOpen/High/Low/Close, etc.,) because they return zeroes if you go back further than 99,999 bars. Worthless.
Here's an interesting one:
- Hit the Home key.
- Put your mouse on the leftmost bar.
- Carefully take your hand off the mouse and let it rest undisturbed.
- Hit the End key, taking you to the most recent end of the chart.
- Now, hit the Home key again, with your eyes on the Date Window.
At first, the numbers will be what you'd expect for that leftmost bar.
Then suddenly, spontaneously, its "Bar# (series)" switches to 99,999, the "Bar# (regular)" to 79... and pay special attention to the date.
Before the switcheroo, the date is wrong. As soon as the numbers flip out, the date corrects itself and remains in sync with the Data Window Date and Time.
This shows what I'm encountering in BarID and in another indicator right now (and have in the past, too, which I posted about):
The Data Window shows the oldest bar being 2020.04.20 09:45 (at the moment). But the BarID buffer initially showed it as 2020.04.17 13:45 (which had me chasing my tail in the other indicator I mentioned.) As soon as the index numbers changed, the date buffer corrects itself.
As you can see, the crosshairs are on the leftmost bar, the time legend shows is as 2020.04.20 09:45, agreeing with the data window.
I used the debugger to inspect the buffer, and sure enough, element 0 contains 2020.04.17 13:45.
I have no clue what's going on here.
I'm sure you old-timers who have so much vested in this platform will be positive from the get-go that this is another one of Melnyk's newbie boners. I hope it is. You've got everything you need, I believe, to point my gaff out to me. Otherwise, something's majorly flaky here...
I guess I'm going to put a hard stop limiter in all code from now on, so that I never attempt to deal with series data beyond 99,999 bars. I can see a global variable coming on right now...
int giByndHereShallYeNotGo = 99999;
Wow. Not a peep. So, you guys are flummoxed, too, looks like.
I just did what you said here and tested other stuff. Moved the cursor all around the window and outside it, pressed End and Home lots of times, etc. The first non-series bar [Bar# (regular)] always returns 0 for me. The first series bar [Bar# (series)] also always return 0 (tested on MetaQuotes-Demo server, USD/JPY M15, since 1973). Didn't experienced any bugs/switches here. Considering the amount of bugs you're experiencing, the only thing I can think of is that your metatrader 5/compiler is truly not working properly (a local issue). What're your hardware/system settings?
If you're lacking some storage space, if you don't have enough memory, etc., you may find some bugs. Also, try compiling with no optimization and see if it works.
It's always tedious to work with historical datas, as datas are never "perfect". It's about history quality.
For example, if you browse at first bars of a chart (EURUSD/H1), you gonna find 24 * H1 bars replaced by 1 * D1 bar. I suppose there's likely an asynchronism with the terminal drawing H1 bars but bars being not of 1H long.
... consequently, moving average calculated on the basis of those "summed up" bars will be wrong ...
Thanks for replying. Somehow I overlooked it when I whined (right after your reply, too).
Yeah, I'm learning. First thing I do now is filter out as much garbage as I can before doing anything.
I just did what you said here and tested other stuff. Moved the cursor all around the window and outside it, pressed End and Home lots of times, etc. The first non-series bar [Bar# (regular)] always returns 0 for me. The first series bar [Bar# (series)] also always return 0 (tested on MetaQuotes-Demo server, USD/JPY M15, since 1973). Didn't experienced any bugs/switches here. Considering the amount of bugs you're experiencing, the only thing I can think of is that your metatrader 5/compiler is truly not working properly (a local issue). What're your hardware/system settings?
If you're lacking some storage space, if you don't have enough memory, etc., you may find some bugs. Also, try compiling with no optimization and see if it works.
Interesting. I've already reinstalled the platform to try to eliminate stuff like this.
I'd like to know, if you go back as far as you can, are your charts limited to 100,000 bars? (I.e., index 99,999.)
So, I've already decided to ignore history past the 99,999th element in any series or arrays. So, that eliminates my problems using the i____ functions, since they seem reliable up to that point.
I guess what I need to do for my beloved iBar (so much mental energy spent translating array data from as-is to regular/series indexing, looking in another array for the date that corresponds, relating that to what I see on my chart, etc., I hardly have ergs enough to figure out a question or find a bug, lol) is base it on chart information from the terminal and the chart itself, rather than being lazy and using the OnCalculate argument arrays. Or just ignore everything beyond 99,999 (prolly simpler).
Doesn't fix the problem, whatever it is, but does mean I won't have to confront it anymore.
Thanks for your feedback, and please let me know if your charts are bound to the <= 100,000 bars limitation, too.
The max bars in my charts are limited to 1,000,000. In the tests I made, 634079 bars were loaded in the chart.
Just in case: you're using windows, right? Many bugs can also come if trying to use MT5 in Linux with Wine.

Ya mean I did it to myself?
I must have set that property (if I ever knew it was there, but I have a vague recollection) so long ago I forgot about it.
That still doesn't address my concern about the i___ functions. Let's see if they start working now that I set my chart default to a million like you have.
If they do, that is a STRANGE dependency, indeed. One of those undocumented "features"? lol
Thanks man. I might not be there yet, but making forward progress...
Glad you solved it!! I use i__ functions all the time and never had a problem with them. It might aswell solve this issue.
The max bars in my charts are limited to 1,000,000. In the tests I made, 634079 bars were loaded in the chart.
Just in case: you're using windows, right? Many bugs can also come if trying to use MT5 in Linux with Wine.
Yeah on Windows (always been tempted by Linux, I'll keep that in mind...)
- Free trading apps
- Over 8,000 signals for copying
- Economic news for exploring financial markets
You agree to website policy and terms of use
I have a simple indicator that I use a lot in coding and testing, called BarID. Its intent is: for any bar you point to on a chart, to give you both its AsSeries = true and AsSeries = false index values, along with the best I could do to show its date and time, given all that's available are type double data in the Data Window.
All is well at the current end of the chart. The current bar shows as 0 (as series = true) and as rates_total - 1 (as series = false). The (double) bar date and time match the built-in Date and Time of the Data Window.
Cool, it works.
But not at the back end.
I'm testing it on a USDJPY M15 chart.
Hit the Home key to go back to the oldest end of the chart. Everything is initially hunky-dory. The oldest bar shows 0 (as series = false) and rates_total - 1 (as series = true).
Until you move the mouse around.
I suggest moving the mouse cursor completely off the chart and then back, then point at the leftmost bar and see how the readouts have changed. Date and Time match the Data Window's Date and Time, the "Total Bars" is unchanged, the same value as rates_total, since every element in its buffer is set to rates_total. But the "Bar# (series)" and "Bar# (regular)" switched all on their own. The leftmost bar on the chart now shows that magic 99,999 for "Bar# (series)", and 79 or 80 for "Bar# (regular)" (I guess that probably depends on how far beyond 99,999 rates_total is.)
Out of the blue.
Just as an FYI, I've abandoned all the i____ functions, (e.g., iTime(), iBars(), iOpen/High/Low/Close, etc.,) because they return zeroes if you go back further than 99,999 bars. Worthless.
Here's an interesting one:
At first, the numbers will be what you'd expect for that leftmost bar.
Then suddenly, spontaneously, its "Bar# (series)" switches to 99,999, the "Bar# (regular)" to 79... and pay special attention to the date.
Before the switcheroo, the date is wrong. As soon as the numbers flip out, the date corrects itself and remains in sync with the Data Window Date and Time.
This shows what I'm encountering in BarID and in another indicator right now (and have in the past, too, which I posted about):
The Data Window shows the oldest bar being 2020.04.20 09:45 (at the moment). But the BarID buffer initially showed it as 2020.04.17 13:45 (which had me chasing my tail in the other indicator I mentioned.) As soon as the index numbers changed, the date buffer corrects itself.
As you can see, the crosshairs are on the leftmost bar, the time legend shows is as 2020.04.20 09:45, agreeing with the data window.
I used the debugger to inspect the buffer, and sure enough, element 0 contains 2020.04.17 13:45.
I have no clue what's going on here.
I'm sure you old-timers who have so much vested in this platform will be positive from the get-go that this is another one of Melnyk's newbie boners. I hope it is. You've got everything you need, I believe, to point my gaff out to me. Otherwise, something's majorly flaky here...
I guess I'm going to put a hard stop limiter in all code from now on, so that I never attempt to deal with series data beyond 99,999 bars. I can see a global variable coming on right now...
int giByndHereShallYeNotGo = 99999;