Discussing the article: "Population optimization algorithms: Spiral Dynamics Optimization (SDO) algorithm"
Thanks again for another algorithm!
It would be good to highlight.
I would like to consult with the community.
Other amazing algorithms are waiting for their turn, the comparison table becomes too big for convenient viewing and analysis, I think to exclude the weakest ones from the table, but on the other hand I would not like to lose sight of them.
Also, maybe some other visualisation I could do.
In general, I will be glad to hear your comments and suggestions.
I hope that my articles will serve as a source of ideas and inspiration for traders, help to look at ordinary things with a new, fresh look, as well as help in choosing the appropriate tools in the search of complex interrelationships, help in achieving goals and new impressive successes.
Look at sites where the most successful ways of visualising comparative data have been worked out over the years.
Look at sites where the most successful options for visualising comparative data have been worked out over the years.
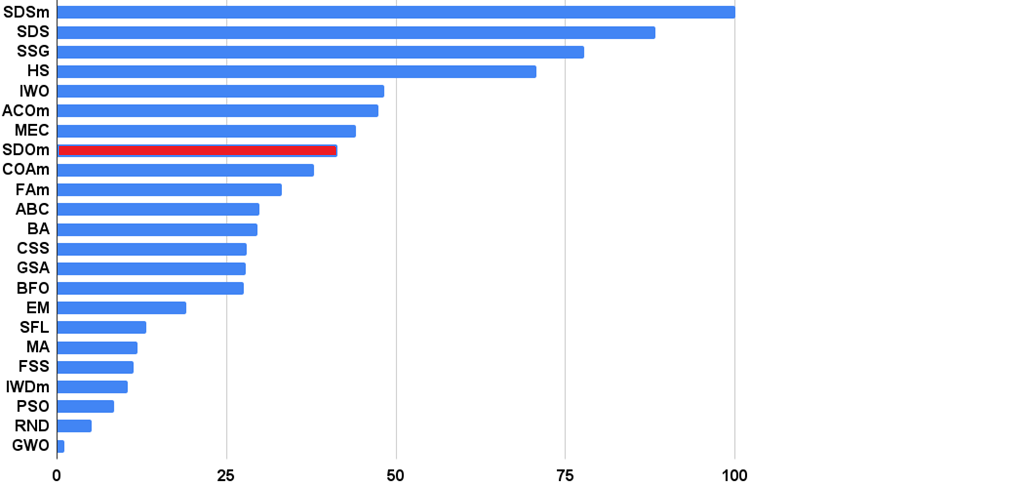
Yes, a bar chart (histogram) is a good way to display what is being compared, no problem with that.
I meant, maybe it is worthwhile to give in addition to the general histogram also separately for each test (and there are 9 of them). A coloured table is good and allows you to clearly identify the specifics of each algo, but it doesn't give you an idea of the extent to which they differ from discipline to discipline.
And, although I only cite honest algorithms (even if some of them were not, they are reworked), there may still be some that can use repeatability in test functions as a "weapon".
I recently came across such an algorithm, the authors used the search for the minimum on the Rastrigin function, but it is absolutely certain that the min glob is in [0,0] (right in the centre of the function definition area), with the resulting imaginary "coolness" of such an algorithm.
That's why I'm working on the idea of revising the testing methodology to get rid of duplication of two-dimensional functions in a multidimensional space and at the same time to preserve the possibility of visualisation of the testing process - and this is a very difficult question as it may seem at first glance.
Andrei, where do you get this
That's a question on your mind.
- Free trading apps
- Over 8,000 signals for copying
- Economic news for exploring financial markets
You agree to website policy and terms of use
Check out the new article: Population optimization algorithms: Spiral Dynamics Optimization (SDO) algorithm.
The article presents an optimization algorithm based on the patterns of constructing spiral trajectories in nature, such as mollusk shells - the spiral dynamics optimization (SDO) algorithm. I have thoroughly revised and modified the algorithm proposed by the authors. The article will consider the necessity of these changes.
Spiral Dynamics Optimization (SDO) is one of the simplest physics algorithms proposed by Tamura and Yasuda in 2011 and developed using the logarithmic spiral phenomenon in nature. The algorithm is simple and has few control parameters. Moreover, the algorithm has high computation speed, local search capability, diversification at an early stage and intensification at a later stage.
There are many spirals available in nature, such as galaxies, auroras, animal horns, tornadoes, seashells, snails, ammonites, chameleon tails or seahorses. Spirals can also be seen in ancient art created by humanity at the dawn of its existence. Over the years, several researchers have made efforts to understand spiral sequences and complexities, and to develop spiral equations and algorithms. A frequently occurring spiral phenomenon in nature is the logarithmic spiral observed in galaxies and tropical cyclones. Discrete logarithmic spiral generation processes were implemented as efficient search behavior in metaheuristics, which inspired the development of a spiral dynamics optimization algorithm.
Patterns called visible spiral sequences found in nature represent plants, trees, waves and many other shapes. Visual patterns in nature can be modeled using chaos theory, fractals, spirals and other mathematical concepts. In some natural patterns, spirals and fractals are closely related. For example, the Fibonacci spiral is a variant of the logarithmic spiral based on the golden ratio and Fibonacci numbers. Since it is logarithmic, the curve looks the same at every scale and can also be considered a fractal.
Author: Andrey Dik