template <typename T>
void f( T& ) {}

// Works only for objects of structures and classes.
template <typename T>
void OnlyObjects( T& )
{
  const T Tmp;

  f((T)Tmp);

  // ....
}

void OnStart()
{
  int i;
  MqlTick Tick;

  OnlyObjects(Tick); // OK
  OnlyObjects(i);    // Error
}
In the article I saw a feature of MQL that I did not know. An example of its use.
It probably belongs to another article ;-) - https://www.mql5.com/en/articles/8028/ - templates were used there, and the example from there was simply moved here ready-made.

- www.mql5.com
Stanislav, thank you for your work!
Why are all four chart types (equi-, renge-, tick- and renko) not combined into one EA? Was there a reason to separate them, or was it just easier to remake something ready-made?
Very good idea. Plus trading from the chart would work inbuilt.
Who should I ping? @Renat Fatkhullin @Slava
Why are all four chart types (equi-, renge-, tick-, and renko) not combined into one EA? Were there reasons to separate them, or was it just easier to remake something ready-made?
Firstly, historically they have been done separately (to start with some things are not mine ;-). Secondly, IMHO each type of chart has its own adherents and they do not overlap much (for example, tick fans are not renko fans, and timeshift is a separate song altogether). Thirdly, they have in common only initialisation, and not completely, because the continuation of generation after restarting should be done differently. There was an idea to put the common in a separate includnik, but taking into account point 2, it is easier for everyone to choose one file without dependencies.
Firstly, historically they have been done separately (to start with some are not my thing ;-). Secondly, IMHO, each type of charts has its own adherents and they do not overlap much (for example, tick fans are not renko fans, and timeshift is a separate song). Thirdly, they have in common only initialisation, and not completely, because the continuation of generation after restarting should be done differently. There was an idea to put the common in a separate includnik, but taking into account point 2, it is easier for everyone to choose one file without dependencies.
Well, they all have the same meaning - to take ticks (or minutes), and build a chart from them without a timeline.
The preparation of history (ideally a one-time one, with continuation after a pause from the right place), generation of new bars, and emulation of ticks are all similar. Only the rules for "new bar" are different.
But I understand the answer, I would also start with adapting a ready-made one, instead of inventing a bicycle.
Funny) and who and where does it position it like that?
My broker's MT5 server can't execute a pending order in 100ms, so how can it be HFT).
Not to mention that pending orders are executed as market orders.
Funny) and who and where is positioning it that way?
My broker's MT5 server can't execute a pending order in 100ms, what's HFT).
Not to mention that pending orders are executed as market orders.
https://www.mql5.com/en/welcome/en-metatrader-5-high-frequency-trading

- www.mql5.com
Renko
To realise renko charts, we use the non-trading RenkoTicks.mq5 Expert Advisor. It generates renko in the form of quotes of a custom instrument by processing real ticks (available in MetaTrader 5 from your broker). The quotes (bars) of the original symbol and the timeframe of the working chart where RenkoTicks is placed do not matter.
An alternative to custom symbols when plotting renko could be an indicator or drawing (using objects or on canvas),but in both cases it would be impossible to apply indicators or scripts on such pseudo-graphics.
Well, why be so categorical. You can draw on the canvas, write the values to the indicator buffer and apply other indicators at the price "Data of the previous indicator". And this is only one of the most primitive variants. There are other more advanced ones.
Well, why so categorical. You can draw on the canvas, write the values to the indicator buffer and apply other indicators at the price "Data of the previous indicator". And this is only one of the most primitive variants. There are other more advanced ones.
This solution does not cover the whole variety of tools used in practice.
This solution does not cover the full variety of tools used in practice.
This solution does not claim to cover the full diversity, but only as a refutation of the statement that there is no possibility to use indicators on a chart with a non-standard bar timing scheme.
I repeat - there are more advanced solutions (though much more complicated), which can already claim to cover "the full diversity".
- Free trading apps
- Over 8,000 signals for copying
- Economic news for exploring financial markets
You agree to website policy and terms of use


New article Custom symbols: Practical basics has been published:
The article is devoted to the programmatic generation of custom symbols which are used to demonstrate some popular methods for displaying quotes. It describes a suggested variant of minimally invasive adaptation of Expert Advisors for trading a real symbol from a derived custom symbol chart. MQL source codes are attached to this article.
Also, the EA allows using the real volume mode for exchange instruments:
The original (a) and the equivolume (b) LKOH chart with the real volume of 10000 per bar, generated by the EqualVolumeBars EA in MetaTrader 5
The timeframe of the symbol on which the EA is running is not important, since either M1 bars or tick history are always used for calculations.
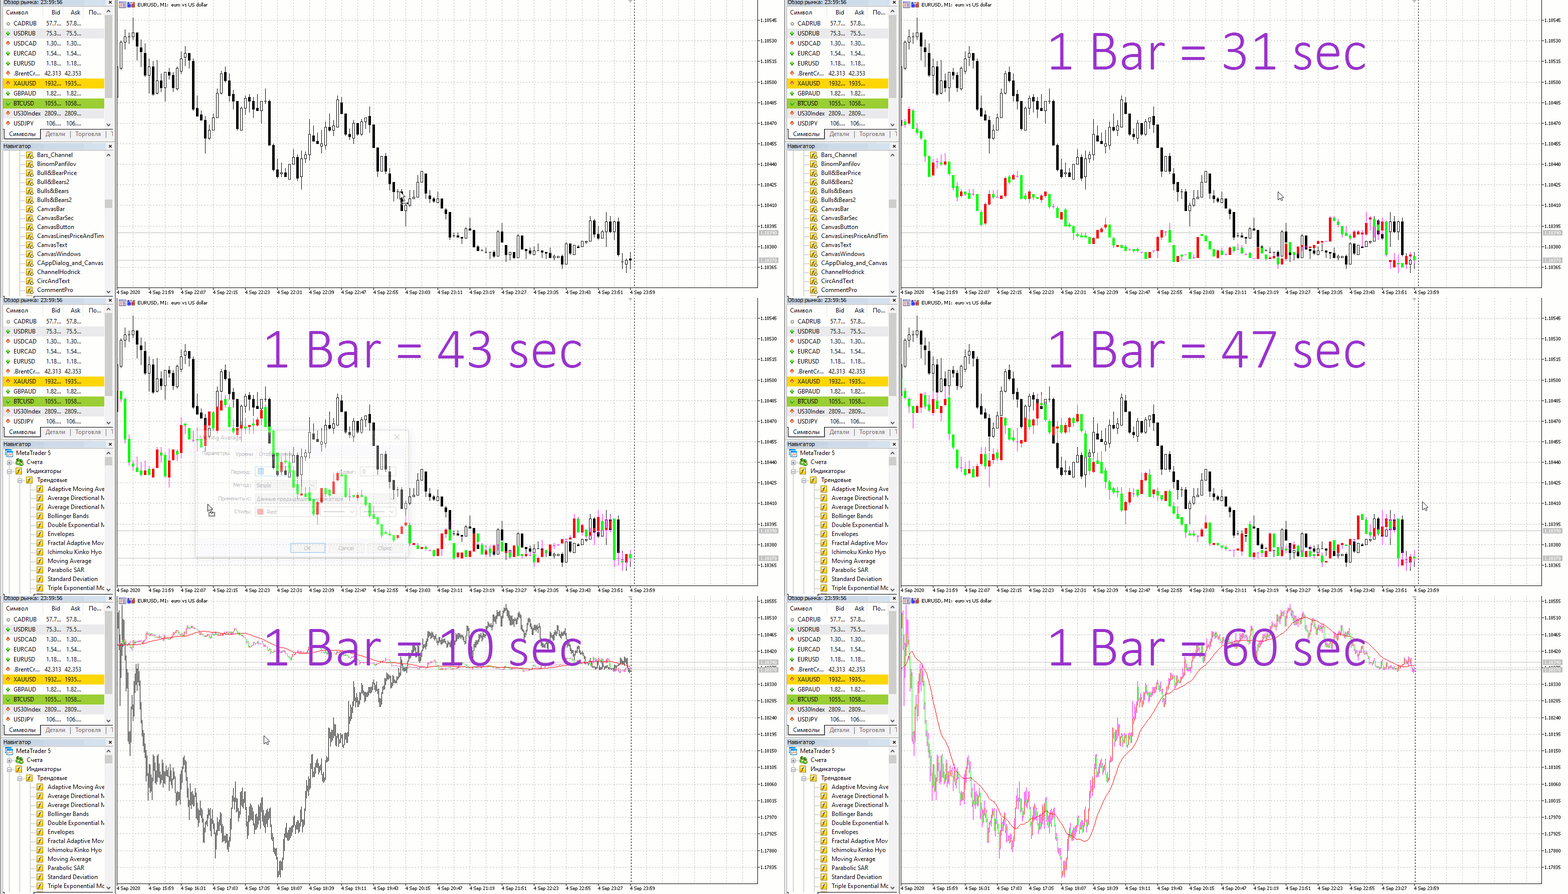
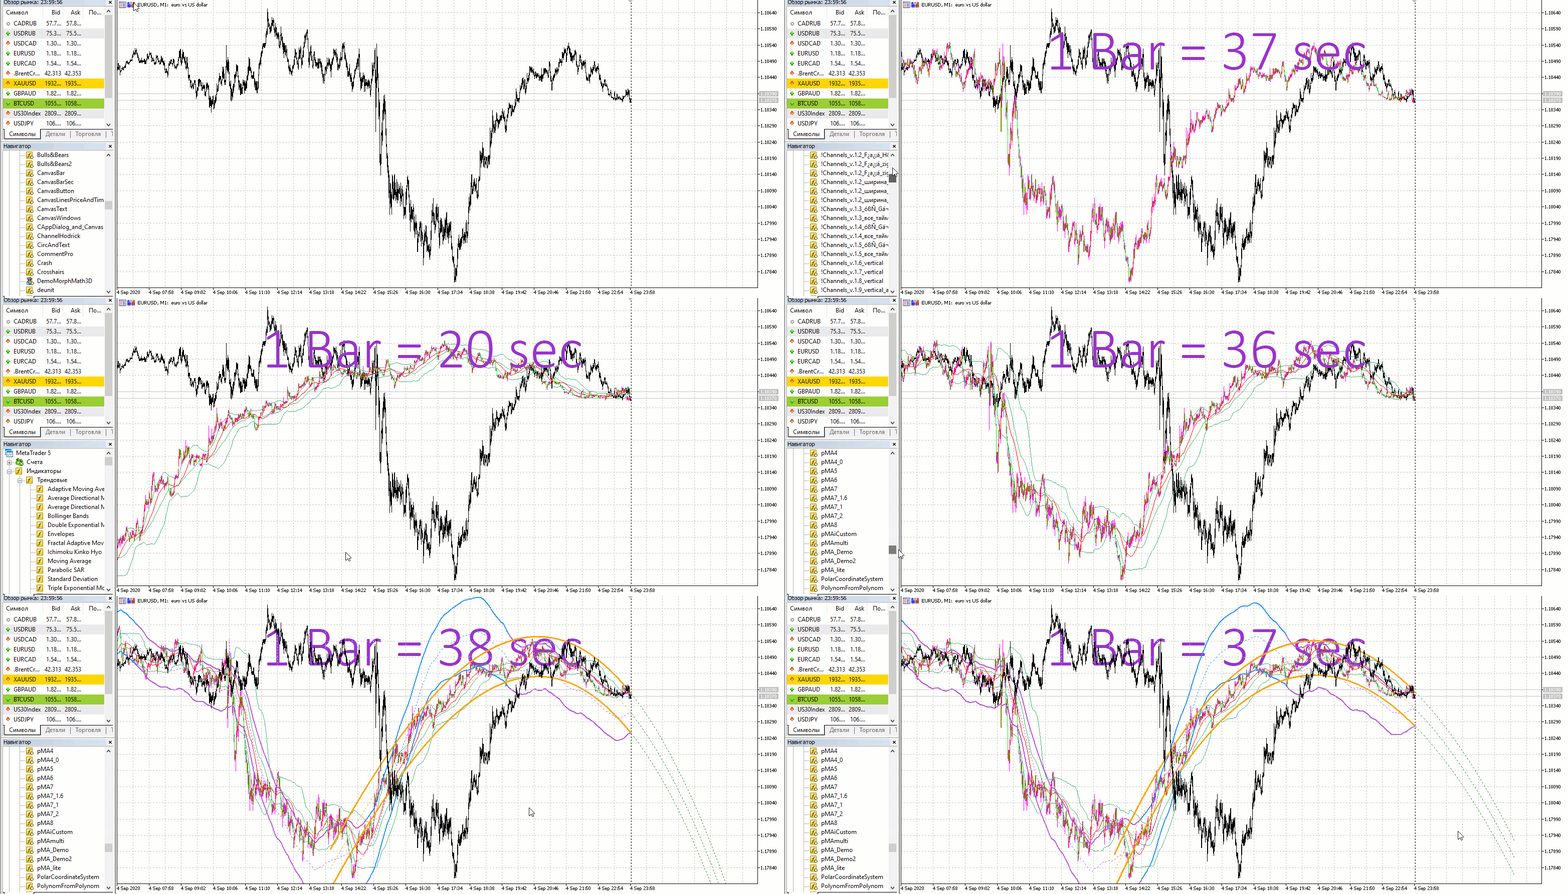
The timeframe of the custom symbol charts must be equal to M1 (the smallest available timeframe in the terminal). Thus, the time of bars, usually closely corresponds to their formation moments. However, during strong market movements, when the number of ticks or the size of volumes forms several bars per minute, the time of the bars will be ahead of real ones. When the market calms down, the time marks of the equivolume bars will return to normal. This platform limitation is probably not particularly critical for equal-volume or equal-range bars, since the very idea of such charts is to unbind them from absolute time.
Author: Stanislav Korotky