Indicators: Force Index (FRC)
thanks for share it.
but u can add in this zerolag and smooth
Introduction
The Force Index is an indicator that uses price and volume to assess
the power behind a move or identify possible turning points. Developed
by Alexander Elder, the Force Index was introduced in his classic book,
Trading for a Living. According to Elder, there are three essential
elements to a stock's price movement: direction, extent and volume. The
Force Index combines all three as an oscillator that fluctuates in
positive and negative territory as the balance of power shifts. The
Force Index can be used to reinforce the overall trend, identify
playable corrections or foreshadow reversals with divergences.
Calculation
Calculation for the one period Force Index is straight forward. Simply subtract the prior close from the current close and multiply by volume. The Force Index for more than one day is simply an exponential moving average of the 1-period Force Index. For example, a 13-Period Force Index is a 13-period EMA of the 1-period Force Index values for the last 13 periods.
Three factors affect Force Index values. First, the Force Index is
positive when the current close is above the prior close. The Force
Index is negative when the current close is below the prior close.
Second, the extent of the move determines the volume multiplier. Bigger
moves warrant larger multipliers that influence the Force Index
accordingly. Small moves produce small multipliers that reduce the
influence. Third, volume plays a key role. A big move on big volume
produces a high Force Index values. Small moves on low volume produce
relatively low Force Index values. The table below shows the Force Index
calculations for Pfizer (PFE). Line 27 marks the biggest move (+84
cents) and the biggest volume (162,619). This combination produces the
biggest Force Index value on the table (136,600).
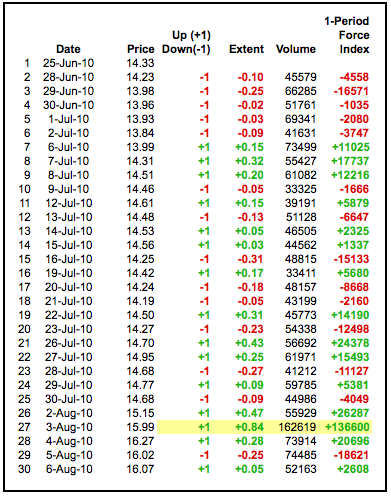
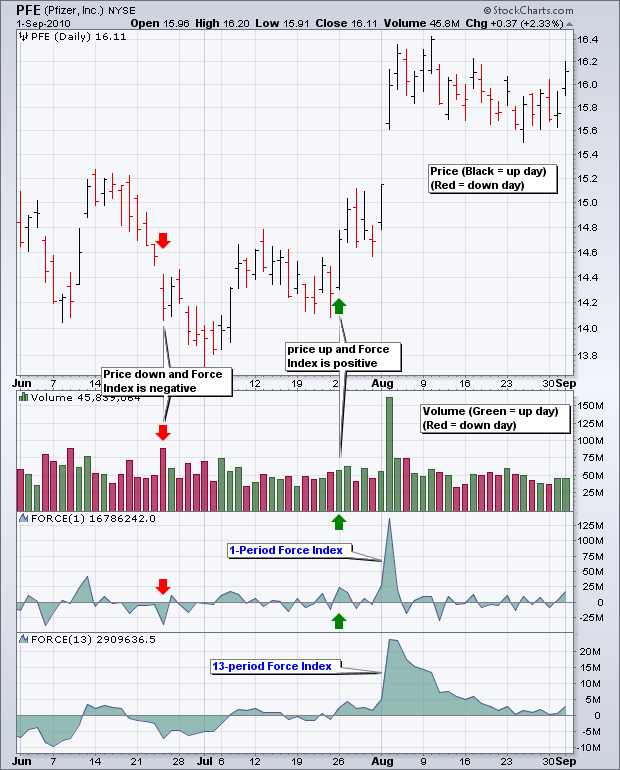
The chart above shows the Force Index in action. Notice how the 1-period
Force Index fluctuates above/below the zero line and looks quite
jagged. Elder recommends smoothing the indicator with a 13-period EMA to
reduce the positive-negative crossovers. Chartists should experiment
with different smoothing periods to determine what best suits their
analytical needs.
Interpretation
As noted above, there are three elements to the Force Index. First, there is either a positive or negative price change. A positive price change signals that buyers were stronger than sellers, while a negative price change signals that sellers were stronger than buyers. Second, there is the extent of the price change, which is simply the current close less the prior close. The "extent" shows us just how far prices moved. A big advance shows strong buying pressure, while a big decline shows strong selling pressure. The third and final element is volume, which, according to Elder, measures commitment. Just how committed are the buyers and sellers? A big advance on heavy volume shows a strong commitment from buyers. Likewise, a big decline on heavy volume shows a strong commitment from sellers. The Force Index quantifies these three elements into one indicator that measures buying and selling pressure.
Trend Identification
The Force Index can be used to reinforce or determine the trend.
The trend in question, short-term, medium-term or long-term, depends on
the Force Index parameters. While the default Force Index parameter is
13, chartists can use a higher number for more smoothing or a lower
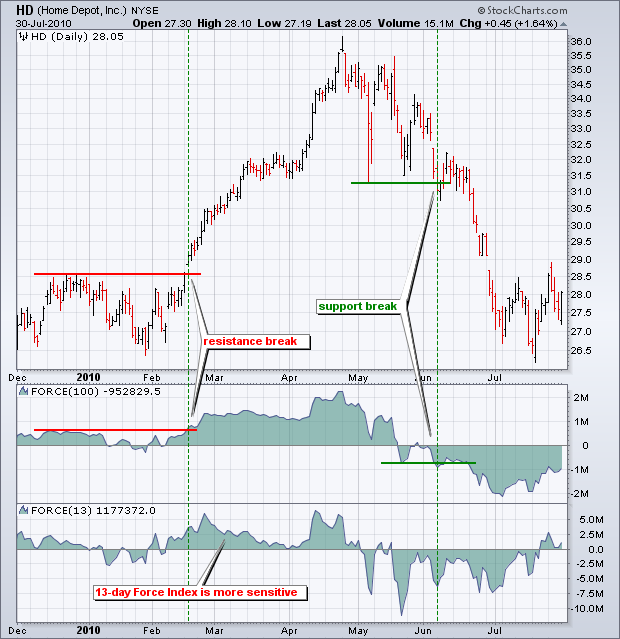
number for less smoothing. The chart below shows Home Depot with a
100-day Force Index and a 13-day Force Index. Notice how the 13-day
Force Index is more volatile and jagged. The 100-day Force Index is
smoother and crosses the zero line fewer times. In this regard, the
100-day Force Index can be used to determine the medium or long-term
trend. Notice how a resistance breakout on the price chart corresponds
to a resistance breakout on the 100-day Force Index. The 100-day Force
Index moved into positive territory and broke resistance in mid
February. The indicator remained positive during the entire uptrend and
turned negative in mid May. The early June support break on the price
chart was confirmed with a support break in the Force Index.
Divergences
Bullish and bearish divergence can alert chartists of a potential trend change. Divergences are classic signals associate with oscillators. A bullish divergence forms when the indicator moves higher as the security moves lower. The indicator is not confirming weakness in price and this can foreshadow a bullish trend reversal. A bearish divergence forms when the indicator moves lower as the security moves higher. Even though the security is moving higher, the indicator shows underlying weakness by moving lower. This discrepancy can foreshadow a bearish trend reversal.
Confirmation is an important part of bullish and bearish divergences.
Even though the divergences signal something is amiss, confirmation from
the indicator or price chart is needed. A bullish divergence can be
confirmed with the Force Index moving into positive territory or a
resistance breakout on the price chart. A bearish divergence can be
confirmed with the Force Index moving into negative territory or a
support break on the price chart. Chartists can also use candlesticks,
moving average crosses, pattern breaks and other forms of technical
analysis for confirmation.
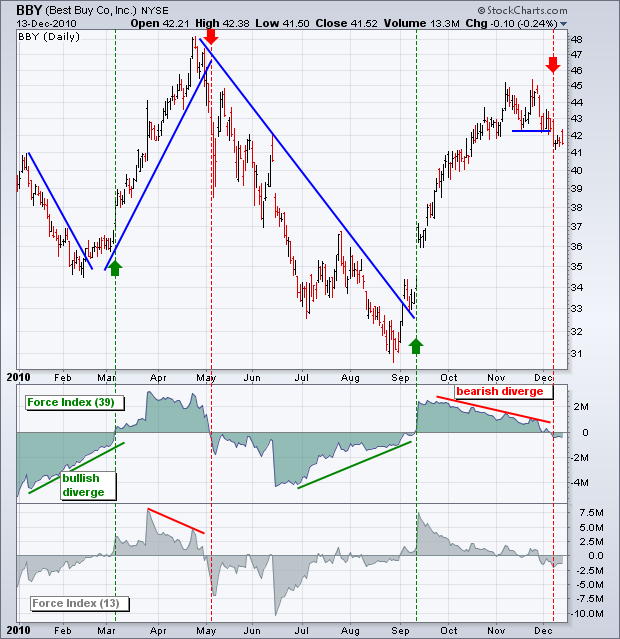
The chart above shows Best Buy (BBY) with the Force Index (39) sporting a series of divergences. The green lines show bullish divergences, while the red lines show bearish divergences. A bullish divergence is confirmed when the Force Index (39) crosses into positive territory (green dotted lines). A bearish divergence is confirmed when the Force Index (39) crosses into negative territory (red dotted lines). Chartists can also use trendline breaks on the price chart for confirmation.
This chart shows two versions of the Force Index. The Force Index (13) captures short-term fluctuations and is more sensitive. The Force Index (39) captures medium-term fluctuations and is smoother. The 39-day Force Index produces fewer zero line crossovers and these crossovers last longer. There is no right or wrong answer for these settings. It depends on trading objectives, time horizon and analytical style.
Identifying Corrections
The Force Index can be used in conjunction with a trend following indicator to identify short-term corrections within that trend. A pullback from overbought levels represents a short-term correction within an uptrend. An oversold bounce represents a short-term correction within a downtrend. Yes, corrections can be up or down, it depends on the direction of the bigger trend. Alexander Elder recommends using a 22-day EMA for trend identification and a 2-day Force Index to identify corrections. The trend is up when the 22-day EMA is moving higher, which means the 2-day Force Index would be used to identify short-term pullbacks for buying. The trend is down when the 22-day EMA is moving lower, which means the 2-day Force Index would be used to identify short-term bounces for selling. This is an aggressive strategy best suiting for active traders. The timeframe can be adjusted by using a longer moving average and timeframe for the Force Index. For example, medium-term traders might experiment with a 100-day EMA and 10-day Force Index.
There are two-schools of thought regarding the correction play. Traders
can either act as soon as the correction is evident or act when there is
evidence the correction has ended. Let's look at an example with the
22-day EMA and 2-day Force Index. Keep in mind that this is designed to
identify very short corrections within a bigger trend. The chart below
shows Texas Instruments (TXN) with the 22-day EMA turning up in mid
September.
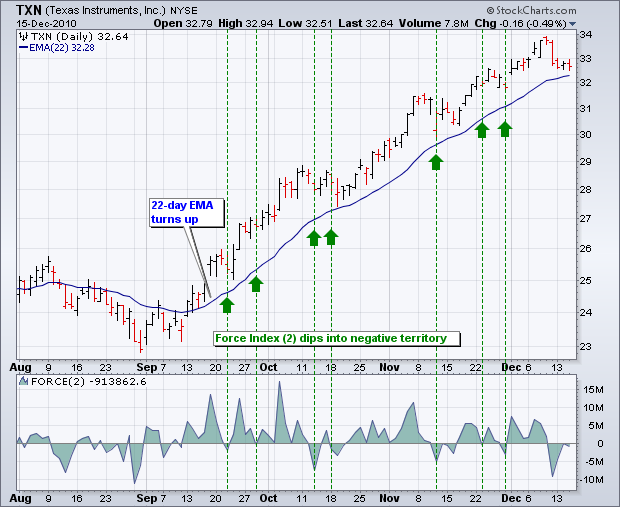
With the 22-day EMA rising, traders are looking for very short-term pullbacks when the 2-day Force Index turns negative. Traders can act when the Force Index turns negative or wait for it to move back into positive territory. Acting when negative may improve the reward-to-risk ratio, but the correction could extend a few more days. Waiting for the Force Index to turn positive again shows some strength that could signal the correction has ended. The green dotted lines show when the 2-day Force Index turns negative.
Conclusions
The Force Index is uses both price and volume to measure buying and selling pressure. The price portion covers the trend, while the volume portion determines the intensity. At its most basic, chartists can use a long-term Force Index to confirm the underlying trend. The bulls have the edge when the 100-day Force Index is positive. The bears have the edge when the 100-day Force Index is negative. Armed with this information, traders can then look for short-term setups in harmony with the larger trend, such as bullish setups in a larger uptrend or bearish setups within a larger downtrend. As with all indicators, traders should use the Force Index in conjunction with other indicators and analysis techniques.
Hello,
This comment caught my attention: " Force Index Calculation is Wrong. I'm 100% Sure! Both MT4 and MT5 Force index Calculation is Wrong. MetaTrader Developers used first the moving average to smooth the current close and previous close instead of "Raw Form" of Force Index: "Current Volume * (Current Close - Previous Close)"..." etc..
This one is worth considering...
Source: https://www.mql5.com/en/forum/266744
- Free trading apps
- Over 8,000 signals for copying
- Economic news for exploring financial markets
You agree to website policy and terms of use
Force Index (FRC):
Force Index technical indicator was developed by Alexander Elder.
This index measures the Bulls Power at each increase, and the Bears Power at each decrease. It connects the basic elements of market information: price trend, its drops, and volumes of transactions. This index can be used as it is, but it is better to approximate it with Moving Average. Approximation using the short moving average (the author proposes to use 2 intervals) contributes to finding the best opportunity to open and close positions. If the approximations is made with long moving average (period 13), the index shows the trends and their changes.
Author: MetaQuotes Software Corp.