Harooki Day Trades
hi
thanks for sharing your system, again I will ask about how about your system performance in a month or more
===================
Can you post the indicators and template you are using,thanks? 
The only indicators I use are: 1) the 30-min opening range and 2) the derivative of the linear regression line. I draw both manually.
I don't use a template. I can't post something that I construct manually.
If I could get the linear regression indicator coded, I would then establish a template that I could post.
Hi Harooki2,
Thanks for sharing your strategy. It's very interesting. I have some experience in programing so I can try to develope an indicator for counting a derivative. Describe how to calculate it.
I include an indicator to determine a range high/low at the begining of London session. You have to set up parameters according to your local broker time.
periodBegin = "08:00"
periodEnd = "08:30"
I hope it can help.
To calculate the derivative:
The Linear Regression Channel tool is inserted into the chart, anchored on the 0800 bar. When the 0805 bar is complete, the tool calculates the slope of the linear regression line (the line in the middle of the channel). If it is down, the number is a minus; if it is up, the number is a plus.
The tool records the data point and the slope. For example, the 0805 bar might be slightly down at -1. The data would be recorded as 1/-1. The 0815 bar might be further down at -8. The data would be recorded as 3/-8, etc.
Each data point is calculated as each bar is complete. The data points would be displayed as a line or histogram (option) in a separate window. The rules I have described in the first post use a 3-period moving average of these data points. However, I started out using the raw numbers (no moving average). It would be best to have the option of either in the indictor.
I should add that we need the ability to move the anchor point of the line, just as you can in the range indicator you sent me. Thanks for that.
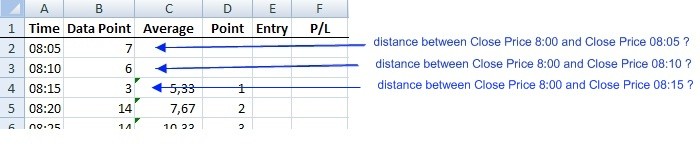
I've made an indicator. It shows the distance in pips between close price of first bar (you can choose time of this bar) and close price of current bar. Tell me if it is useful.
I still don't understand what is the signal for closing a position.
I include now pure version of BreakOut_PANCA_EAGLE__indicator without inscriptions. The previous version come from other strategy.
Cheers
Thank you for the updated range breakout indicator. However, there is still work to do on the LRL (Linear Regression Line) indicator.
Pardon my programming ignorance, but I don't see anything in the code about the linear regression line slope. It appears that you have built the indicator based on price bars; if so, this is wrong.
I have attached my Excel spreadsheet, in which I build this indicator manually every day. Please take a look at it and see if that explains better.
derivative v0.2
Look at this version. What do you think about it ?
I have a question. I've written it in the picture.
I don't know how the slope of the linear regression line is calculated, but it is apparently not calculated as you suggest in your graphic. The numbers on the line in this version you sent me should match the numbers in the Averagecolumn of the spreadsheet I sent you. They don't. So, this version is not depicting the calculations I'm looking for. 
- Free trading apps
- Over 8,000 signals for copying
- Economic news for exploring financial markets
You agree to website policy and terms of use
This is a profitable strategy. My success rate at turning profitable strategies into profitable systems is zero; nevertheless, here are the rules for day trading the EURUSD. I have not traded this methodology on any other pairs.
This is the setup and trigger:
CAUTION:
The market often breaks beyond this range for awhile only to reverse itself (breaking beyond the opposite end of the range) and go substantially in the other direction. This is one of those "fakeouts" that you must endure to trade this strategy.
Therefore, it is important to do the following four things:
Here is how to manage the position, assuming you are Long (opposite for Short):
The Linear Regression Channel tool will be used to keep you calmly in the trade until a real change in direction occurs. You will seldom be stopped out by the trailing stop before this indicator signals an exit. You need not pay any attention to anything else except the trailing stop and the linear regression line to successfully manage this trade. But first, you must construct a derivative of the linear regression line (the channel itself is not important to the strategy).
I have the instructions (not code) for calculating this derivative indicator, but they would be too confusing for now. If anyone is interested in pursuing this, I will post them separately. I currently manage this with an Excel spreadsheet, but I wish I had a custom indicator. There is a custom indicator for the Linear Regression Slope somewhere in this community, but it does not work for my purposes. I'm not a programmer, so I don't know why; but I've tried it, and I know it doesn't work for this strategy.
Nevertheless, a 3-period moving average of the linear regression line's slope keeps you in the trade for substantial moves. It absolves you of worrying about candlestick patterns, Fibonacci retracements, support & resistance lines, etc. Your exit is signaled with a change in direction of this line.
There is a bit more to it, but this is the core of the strategy. I will save further instructions until I see what interest there is in pursuing this.
The methodology trades the UK and US sessions and produces 1-3 trades per day, averaging more than 50 pips daily in the EURUSD.