
Testing patterns that arise when trading currency pair baskets. Part I

Introduction
In the previous articles about applying currency pair baskets in trading, we have examined the trading principle, means of technical analysis and the patterns that can be detected by these means. Of course, it is impossible to follow such methods without confirming certain pattern parameters. For example, we need to clarify specific values the oversold/overbought levels are to be placed on. Here, we will look into the parameters of the detected patterns and try to work out recommendations for traders.
Research tools
For our work, we will use the "combined WPR" we have developed earlier. We have often applied it in the previous article series, and it has proved to be helpful in detecting most patterns.
Increase the WPR period from 14 to 20 in order to slightly smoothen the indicator chart. This will allow you to "straighten" the chart without losing the display quality.
We will conduct studies on three timeframes: D1, H4 and H1. You can obtain results for other periods using the methods described here.
The basic terminology and principles can be found here.
Research pattern
Let's start our studies with the pattern #3 described here. The pattern is quite simple. Its equivalent for a separate currency pair has been well known for a long time. It is applied the following way for trading currency pairs:
A trader receives an entry signal on all currency pairs of a basket if an overbought level is crossed downwards or an oversold one is crossed upwards by the combined WPR after the candle is closed.
Where can we find these oversold/overbought levels? We can easily answer this question for the standard WPR on a separate currency pair:
- Overbought level: - 20%
- Oversold level: - 80%
This gives us a starting point in our research. We will use these data to clarify the location of levels for the combined WPR. The results will be helpful not only when checking the pattern in question, but also in other similar cases. The applied method will be handy as well.
The indicator line should be either above the overbought level or below the oversold one to break through one of them. Let's analyze the history to define the number of potential market entries. We are not going to use indicators at this stage. Instead, we are going to apply the previously developed testIndexZig-Zag1.mq5 and testWPReur.mq5 indicators. In testWPReur.mq5, we simply substitute data according to the basket components. We will slightly simplify the testIndexZig-Zag1.mq5 indicator source code, since we already know the indicator's High and Low (from 100% to -100%):
#property copyright "Copyright 2016, MetaQuotes Software Corp."
#property link      "https://www.mql5.com"
#property version   "1.00"
#property indicator_separate_window
#property indicator_buffers 6
#property indicator_plots   3
//--- plot High
#property indicator_label1  "High"
#property indicator_type1   DRAW_LINE
#property indicator_color1  clrGreen
#property indicator_style1  STYLE_SOLID
#property indicator_width1  1
//--- plot Low
#property indicator_label2  "Low"
#property indicator_type2   DRAW_LINE
#property indicator_color2  clrGreen
#property indicator_style2  STYLE_SOLID
#property indicator_width2  1
//--- plot ZigZag
#property indicator_label3  "ZigZag"
#property indicator_type3   DRAW_SECTION
#property indicator_color3  clrRed
#property indicator_style3  STYLE_SOLID
#property indicator_width3  1
//--- plot Direction
#property indicator_label4  "Direction"
#property indicator_type4   DRAW_LINE
#property indicator_style4  STYLE_SOLID
#property indicator_width4  1
//--- plot LastHighBar
#property indicator_label5  "LastHighBar"
#property indicator_type5   DRAW_LINE
#property indicator_style5  STYLE_SOLID
#property indicator_width5  1
//--- plot LastLowBar
#property indicator_label6  "LastLowBar"
#property indicator_type6   DRAW_LINE
#property indicator_style6  STYLE_SOLID
#property indicator_width6  1

#include <ZigZag\CSorceData.mqh>
#include <ZigZag\CZZDirection.mqh>
#include <ZigZag\CZZDraw.mqh>
//+------------------------------------------------------------------+
//|                                                                  |
//+------------------------------------------------------------------+
enum EDirection
  {
   Dir_NBars=0,
   Dir_CCI=1
  };
//--- input parameters
input EDirection  DirSelect=Dir_NBars;
input int                  CCIPeriod   =  14;
input ENUM_APPLIED_PRICE   CCIPrice    =  PRICE_TYPICAL;
input int                  ZZPeriod=14;

string               name;

CZZDirection*dir;
CZZDraw*zz;

//--- indicator buffers
double         HighBuffer[];
double         LowBuffer[];
double         ZigZagBuffer[];
double         DirectionBuffer[];
double         LastHighBarBuffer[];
double         LastLowBarBuffer[];
//+------------------------------------------------------------------+
//| Custom indicator initialization function                         |
//+------------------------------------------------------------------+
int h;
//+------------------------------------------------------------------+
//|                                                                  |
//+------------------------------------------------------------------+
int OnInit()
  {
   switch(DirSelect)
     {
      case Dir_NBars:
         dir=new CNBars(ZZPeriod);
         break;
      case Dir_CCI:
         dir=new CCCIDir(CCIPeriod,CCIPrice);
         break;
     }
   if(!dir.CheckHandle())
     {
      Alert("Indicator 2 download error");
      return(INIT_FAILED);
     }
   zz=new CSimpleDraw();
//--- indicator buffers mapping
   SetIndexBuffer(0,HighBuffer,INDICATOR_DATA);
   SetIndexBuffer(1,LowBuffer,INDICATOR_DATA);
   SetIndexBuffer(2,ZigZagBuffer,INDICATOR_DATA);
   SetIndexBuffer(3,DirectionBuffer,INDICATOR_CALCULATIONS);
   SetIndexBuffer(4,LastHighBarBuffer,INDICATOR_CALCULATIONS);
   SetIndexBuffer(5,LastLowBarBuffer,INDICATOR_CALCULATIONS);
   name = _Symbol + TimeFrameToShortString(Period()) + ".txt";
   h=FileOpen(name,FILE_CSV|FILE_WRITE|FILE_ANSI,',');
//---
   return(INIT_SUCCEEDED);
  }
//+------------------------------------------------------------------+
//|                                                                  |
//+------------------------------------------------------------------+
void OnDeinit(const int reason)
  {

   if(CheckPointer(dir)==POINTER_DYNAMIC)
     {
      delete(dir);
     }
   if(CheckPointer(zz)==POINTER_DYNAMIC)
     {
      delete(zz);
     }
  }
//+------------------------------------------------------------------+
//| Custom indicator iteration function                              |
//+------------------------------------------------------------------+
int ind=0;
//+------------------------------------------------------------------+
//|                                                                  |
//+------------------------------------------------------------------+
int OnCalculate(const int rates_total,
                const int prev_calculated,
                const int begin,
                const double &price[]
                )
  {
   int start;

   if(prev_calculated==0)
     {
      start=0;
     }
   else
     {
      start=prev_calculated-1;
     }

   for(int i=start;i<rates_total;i++)
     {
      HighBuffer[i]=price[i];
      LowBuffer[i]=price[i];
     }

   int rv;
   rv=dir.Calculate(rates_total,
                    prev_calculated,
                    HighBuffer,
                    LowBuffer,
                    DirectionBuffer);
   if(rv==0)return(0);
   zz.Calculate(rates_total,
                prev_calculated,
                HighBuffer,
                LowBuffer,
                DirectionBuffer,
                LastHighBarBuffer,
                LastLowBarBuffer,
                ZigZagBuffer);

   if(ind<= 10) ind++;
   if(ind == 10)
     {
      double mx=100,mn=-100;
      double lg;
      lg=mx-mn;
      lg/=100;
      double levels[100];
      int    count[100];
      ArrayInitialize(count,0);
      for(int i=1; i<101; i++) levels[i-1]=NormalizeDouble(lg*i + mn,_Digits);
      for(int i=0;i<rates_total;i++)
        {
         if(ZigZagBuffer[i]==0 || ZigZagBuffer[i]==EMPTY_VALUE) continue;
         else
           {
            for(int j=0; j<100; j++)
              {
               if(ZigZagBuffer[i]<levels[j])
                 {
                  count[j]++;
                  break;
                 }
              }
           }
        }
      for(int i=0; i<100; i++)
        {
         FileWrite(h,i,levels[i],count[i]);
        }
      FileClose(h);
      Print("Work complete: ",name);
     }
   return(rates_total);
  }
//+------------------------------------------------------------------+


string TimeFrameToShortString(ENUM_TIMEFRAMES period)
{
   switch (period )
   {
      case PERIOD_M1:  return ("M1");
      case PERIOD_M2:  return ("M2");
      case PERIOD_M3:  return ("M3");
      case PERIOD_M4:  return ("M4");
      case PERIOD_M5:  return ("M5");
      case PERIOD_M6:  return ("M6");
      case PERIOD_M10: return ("M10");
      case PERIOD_M12: return ("M12");
      case PERIOD_M15: return ("M15");
      case PERIOD_M20: return ("M20");
      case PERIOD_M30: return ("M30");
      case PERIOD_H1:  return ("H1");
      case PERIOD_H2:  return ("H2");
      case PERIOD_H3:  return ("H3");
      case PERIOD_H4:  return ("H4");
      case PERIOD_H6:  return ("H6");
      case PERIOD_H8:  return ("H8");
      case PERIOD_H12: return ("H12");
      case PERIOD_D1:  return ("D1");
      case PERIOD_W1:  return ("W1");
      case PERIOD_MN1: return ("MN1");
   }
   return ("");
}
As mentioned earlier, the main code for this indicator was developed and kindly provided to the community by a respected colleague Dmitry Fedoseev in this article. Both mentioned indicators can be found in the test.zip archive attached below. We have the necessary tools, now let's find out the necessary data.
Possible number of trades
The range of the combined WPR varies from -100% to +100%, so for now we will assume that the overbought level is at +60%, while the oversold one is at -60%, which corresponds to the standard value. Let's find out how many times the indicator went beyond the overbought/oversold levels. To do this, we should use the method described here:
- Apply the testIndexZig-Zag1.mq5 indicator to the combined WPR chart (testWPReur.mq5). Our goal is to determine the number of extreme values exceeding the levels of +70% and +80% or -70% and -80%, as in the figure below. Note the problem area marked as a blue rectangle. For now, such extreme values are included into the calculation, although we will sort out such values in the future:
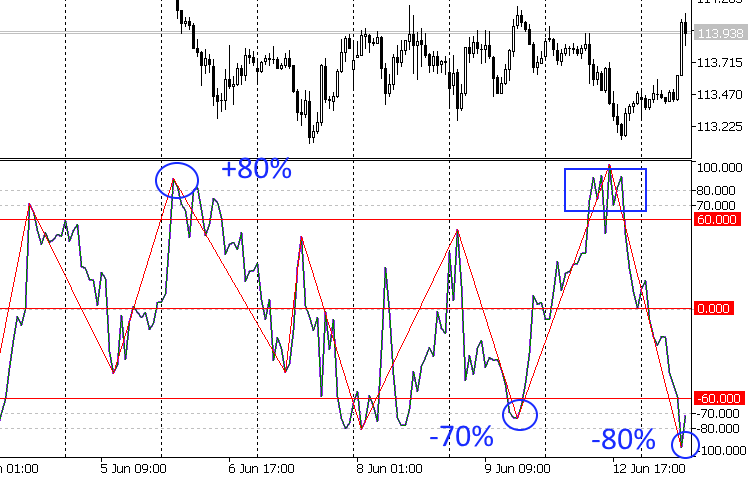
- The applied testIndexZig-Zag1.mq5 indicator divides the testWPReur.mq5 indicator range into the intervals of 1% and defines the number of extreme values falling within each interval. The results are sent to the file. The calculation is repeated for all selected timeframes. After that, we change the data on the basket contents in testWPReur.mq5 and continue our work with the next currency basket.
For more convenience, the obtained data on all baskets and selected timeframes have been arranged as a table. The table fragment concerning the EUR basket is displayed below. Let's clarify the meaning of the table's row and column values:
- Num. — index number.
- Indicator — indicator value in %. For example, the row with the value of -96 means the interval from -96% to -98% of the combined WPR.
- EUR — three columns with the number of extreme values per each selected timeframe. For example, the already mentioned Num.1 row with the combined WPR indicator varying from 96% to 98% defines that the following number of extreme values falling within this interval has been found on history: D1 - zero, H4 and H1 - one at each of the timeframes.
- History Depth — history depth available for calculations.
- Trade count (80%) — total number of possible entries for each timeframes. For example, the EUR basket on H4 offers 83 possible entries, meaning that the combined WPR indicator exceeded the value of 80% or was lower than -80% the specified amount of times.
- Trade count (70%) — same parameter for the combined WPR value at 70%.
- Trade total (80%) — total number of potential entries for all baskets and timeframes for the value of the combined WPR at 80%.
- Trade total (70%) — same for 70%.
| EUR | ---- | ||||
| Num. | Indicator | Timeframe | ---- | ||
| D1 | H4 | H1 | ---- | ||
| 0 | -98 | 2 | 3 | 4 | ---- |
| 1 | -96 | 0 | 1 | 1 | ---- |
| 2 | -94 | 0 | 0 | 1 | ---- |
| 3 | -92 | 0 | 3 | 3 | ---- |
| 4 | -90 | 1 | 4 | 5 | ---- |
| 5 | -88 | 3 | 4 | 10 | ---- |
| 6 | -86 | 1 | 2 | 7 | ---- |
| 7 | -84 | 2 | 8 | 7 | ---- |
| 8 | -82 | 1 | 8 | 21 | ---- |
| 9 | -80 | 4 | 6 | 22 | ---- |
| ---- | ---- | ---- | ---- | ---- | ---- |
| 95 | 92 | 0 | 2 | 6 | ---- |
| 96 | 94 | 0 | 1 | 4 | ---- |
| 97 | 96 | 0 | 0 | 3 | ---- |
| 98 | 98 | 0 | 3 | 0 | ---- |
| 99 | 100 | 0 | 0 | 0 | ---- |
| History Depth | 2000.11.09 | 2005.04.12 | 2006.01.17 | ---- | |
| ---- | |||||
| Trade count (80%) | 25 | 83 | 165 | ---- | |
| Trade count (70%) | 45 | 207 | 449 | ---- | |
| Trade total (80%) | 3793 | ||||
| Trade total (70%) | 7885 | ||||
The table can be found in the attached Pair.zip archive.
The last two table rows contain the search values. This is quite a large number of possible market entries, even taking into account that part of the signals are to be sorted out. Therefore, let's leave the oversold/overbought levels in the same place for now. Keep in mind that all found (and already existing) values are probabilistic in nature and allow corrections.
Pattern form
Let's define the shape of the pattern we need to identify to enter the market.
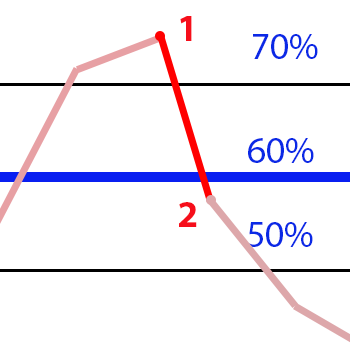
- A trader sells a basket of currency pairs if the combined WPR indicator crosses the overbought level +60% downwards. At the candle closure, the indicator value was not lower than +50%. Decrease of the indicator line should occur from the value not lower than +70%. The second option for this point is + 80% and higher, while for the overbought level, it is +70%.
- The case of buying a basket of currency pairs is symmetric to the described one.
All three patterns highlighted in the above image satisfy these conditions. We receive a clear "beautiful" pattern with numerical values and conditions that can be converted into an algorithm.
This means we need an Expert Advisor.
Expert Advisor for testing the pattern
First, let's deal with buying/selling the basket. In this article, you can find details on trading currency baskets and study the table containing practical advice for each basket. Let's use this table and implement the same principle in the EA code.
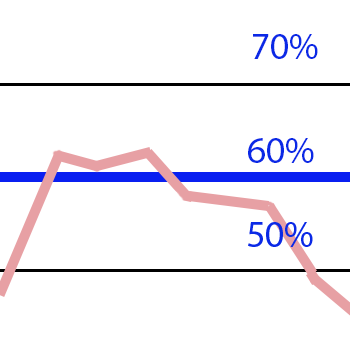
Let's show once again the patterns we are looking for:
| Target pattern |
No pattern |
|
|
Suppose that the oversold/overbought level may shift in the range of 60-70%. Let's check it for the number of trades by the checked pattern, duration of trades, drawdown and potential profitability. We do not require a stable profit from the EA for now. Our goal is to take the first step in clarifying the pattern shape. Therefore, we do not publish standard tester reports since we are not interested in the EA profitability, while the data we need is not included in standard reports. We will focus on displaying the obtained results.
We will start our analysis from the USD currency basket by placing the next EA on EURUSD on the previously chosen timeframes:
//+------------------------------------------------------------------+
//|                                                   testBasket.mq5 |
//|                        Copyright 2017, MetaQuotes Software Corp. |
//|                                             https://www.mql5.com |
//+------------------------------------------------------------------+
#property copyright "Copyright 2017, MetaQuotes Software Corp."
#property link      "https://www.mql5.com"
#property version   "1.00"
//--- input parameters

#include <Trade\\Trade.mqh>


#define LG 7

input int SELLPROFIT =   0;
input int SELL1LIMIT =  70;
input int SELL2FROM  =  60;
input int SELL2TO    =  50;

input int BUYPROFIT  =   0;
input int BUY1LIMIT  = -70;
input int BUY2FROM   = -60;
input int BUY2TO     = -50;

input int WPR=20;
//+------------------------------------------------------------------+
//|                                                                  |
//+------------------------------------------------------------------+
enum BSTATE
  {
   BCLOSE = 0,
   BBUY   = 1,
   BSELL  = 2
  };

string pair[]={"EURUSD","GBPUSD","AUDUSD","NZDUSD","USDCAD","USDCHF","USDJPY"};
bool bDirect[]={false,false,false,false,true,true,true};
datetime TimeParam[3];

double dWpr[3];
ulong  Ticket[LG];
double TradeResult[LG];
double TradeCurrency;
double Drw;
string sLog;

double TradeTotalResult[LG];
double TradeTotalCurrency;
int    iTradeCount;
double mDrw;

int h1[LG];
BSTATE bstate;
//+------------------------------------------------------------------+
//|                                                                  |
//+------------------------------------------------------------------+
double GetValue1(int shift)
  {
   double dBuf[1];
   double res=0.0;
   for(int i=0; i<LG; i++)
     {
      CopyBuffer(h1[i],0,shift,1,dBuf);
      if(bDirect[i]==true)
         res+=dBuf[0];
      else
         res+=-(dBuf[0]+100);
     }//end for (int i = 0; i < iCount; i++)
   res=res/LG;
   return (NormalizeDouble((res + 50) * 2, _Digits) );
  }

//+------------------------------------------------------------------+
//| Expert initialization function                                   |
//+------------------------------------------------------------------+
int lh;
//+------------------------------------------------------------------+
//|                                                                  |
//+------------------------------------------------------------------+
int OnInit()
  {
   EventSetTimer(1);

   for(int i=0; i<LG; i++)
     {
      h1[i]=iWPR(pair[i],0,WPR);
     }
   bstate=BCLOSE;

   ArrayInitialize(TradeTotalResult,0);
   ArrayInitialize(dWpr,EMPTY_VALUE);
   TradeTotalCurrency=0;
   iTradeCount=0;
   mDrw=1000000;

   lh=INVALID_HANDLE;
   string lname = _Symbol + "_" + TimeFrameToShortString(Period() );
   string t1, t = lname;
   int i=0;
   for(;;)
     {
      t+=".html";
      long lg=FileFindFirst(t,t1);
      if(lg==INVALID_HANDLE)
        {
         lh= FileOpen(t,FILE_WRITE | FILE_TXT | FILE_ANSI);
         Print("CREATE ",t);
         break;
        }
      FileFindClose(lg);
      t=lname+"_"+IntegerToString(i++);
     }

   FileWriteString(lh,"<!DOCTYPE html PUBLIC \"-//W3C//DTD XHTML 1.0 Strict//EN\" \"http://www.w3.org/TR/xhtml1/DTD/xhtml1-strict.dtd\">\r\n");
   FileWriteString(lh,"<html xmlns=\"http://www.w3.org/1999/xhtml\">\r\n");
   FileWriteString(lh,"<head>\r\n");
   FileWriteString(lh,"<meta http-equiv=\"Content-Type\" content=\"text/html; charset=utf-8\"/>\r\n");
   FileWriteString(lh,"<title>"+lname+"</title>\r\n");
   FileWriteString(lh,"</head>\r\n<body>\r\n");
   FileWriteString(lh,"<H2>"+_Symbol+" "+TimeFrameToShortString(Period())+"</H2>\r\n");
   FileWriteString(lh,"<H3>Pattern Params:</H3>\r\n");
   FileWriteString(lh,"<table width=\"100%\" cellspacing=\"0\" cellpadding=\"5\">\r\n");
   FileWriteString(lh,"<thead>\r\n<tr>\r\n<th>BUY</th>\r\n<th>SELL</th>\r\n</tr>\r\n</thead>\r\n<tbody>\r\n<tr>\r\n");
   t=StringFormat("Point 1: %d Point 2 from: %d to: %d Close at: %d",BUY1LIMIT,BUY2FROM,BUY2TO,BUYPROFIT);
   FileWriteString(lh,"<td style=\"text-align:center;\">\r\n<ul>\r\n<li>"+t+"</li>\r\n</ul>\r\n</td>\r\n");
   t=StringFormat("Point 1: %d Point 2 from: %d to: %d Close at: %d",SELL1LIMIT,SELL2FROM,SELL2TO,SELLPROFIT);
   FileWriteString(lh,"<td style=\"text-align:center;\">\r\n<ul>\r\n<li>"+t+"</li>\r\n</ul>\r\n</td>\r\n");
   FileWriteString(lh,"</tr>\r\n</tbody>\r\n</table>\r\n");
   FileWriteString(lh,"<H2>"+"Tester Result"+"</H2>\r\n");
   FileWriteString(lh,"<table border=\"1\" width=\"100%\" cellspacing=\"0\" cellpadding=\"5\">\r\n");
   FileWriteString(lh,"<thead>\r\n<th>Num.</th>\r\n<th>Type</th>\r\n<th>WPR(P1/P2)</th>\r\n<th>Time(Begin/End/Length)</th>\r\n<th>Drawdown/<br/>Profit</th>\r\n<th>Pair Profit</th>\r\n</tr>\r\n</thead>\r\n<tbody>\r\n");

   return(INIT_SUCCEEDED);
  }
//+------------------------------------------------------------------+
//|                                                                  |
//+------------------------------------------------------------------+
void PushWpr(double wpr)
  {
   dWpr[2] = dWpr[1]; dWpr[1] = dWpr[0];
   dWpr[0] = wpr;
  }
//+------------------------------------------------------------------+
//| Expert tick function                                             |
//+------------------------------------------------------------------+
void OnTick()
  {

  }
//+------------------------------------------------------------------+
//|                                                                  |
//+------------------------------------------------------------------+
void Stat()
  {

   double d=0;
   for(int i=0; i<LG; i++)
     {
      PositionSelectByTicket(Ticket[i]);
      d+=PositionGetDouble(POSITION_PROFIT);
     }
   if(d<Drw) Drw=d;
   if(Drw<mDrw)
     {
      mDrw=Drw;
      TimeParam[2]=TimeCurrent();
     }
  }
//+------------------------------------------------------------------+
//| Timer function                                                   |
//+------------------------------------------------------------------+
void OnTimer()
  {
   if(bstate!=BCLOSE)
     {
      Stat();
     }
   if(IsNewCandle())
     {
      double res=GetValue1(0);
      PushWpr(res);
      if(dWpr[1]!=EMPTY_VALUE)
        {
         if(bstate==BBUY && (dWpr[0]>=BUYPROFIT ))
           {
            CloseAllPos();
            bstate=BCLOSE;
           }
         if(bstate==BSELL && (dWpr[0]<=SELLPROFIT ))
           {
            CloseAllPos();
            bstate=BCLOSE;
           }
         if(bstate==BCLOSE && dWpr[0]<=SELL2FROM && dWpr[0]>=SELL2TO && dWpr[1]>=SELL1LIMIT)
           {
            EnterSell(0.01);
            bstate=BSELL;
            TimeParam[0]=TimeCurrent();
            TradeCurrency=0;
            Drw=1000000;
            iTradeCount++;
            sLog=StringFormat("<tr>\r\n<td>%d</td>\r\n<td>SELL</td>\r\n<td>%.2f/<br/>%.2f</td>\r\n<td>%s/<br/>",iTradeCount,dWpr[1],dWpr[0],TimeToString(TimeCurrent()));
            return;
           }
         if(bstate==BCLOSE && dWpr[0]>=BUY2FROM && dWpr[0]<=BUY2TO && dWpr[1]<=BUY1LIMIT)
           {
            EnterBuy(0.01);
            bstate=BBUY;
            TimeParam[0]=TimeCurrent();
            TradeCurrency=0;
            Drw=1000000;
            iTradeCount++;
            sLog=StringFormat("<tr>\r\n<td>%d</td>\r\n<td>BUY</td>\r\n<td>%.2f/<br/>%.2f</td>\r\n<td>%s/<br/>",iTradeCount,dWpr[1],dWpr[0],TimeToString(TimeCurrent()));
            return;
           }
        }//if (stc.Pick(1) != EMPTY_VALUE)
     }
  }
//+------------------------------------------------------------------+
//|                                                                  |
//+------------------------------------------------------------------+
void CloseAllPos()
  {

   CTrade Trade;
   Trade.LogLevel(LOG_LEVEL_NO);

   TimeParam[1]=TimeCurrent();
   string p="<td>";
   for(int i=0; i<LG; i++)
     {
      TradeResult[i]=PositionGetDouble(POSITION_PROFIT)+PositionGetDouble(POSITION_SWAP);
      p+=StringFormat("%s = %.2f<br/>",pair[i],TradeResult[i]);
      TradeCurrency       += TradeResult[i];
      TradeTotalResult[i] += TradeResult[i];
      Trade.PositionClose(Ticket[i]);
     }
   p+="</td>\r\n";
   TradeTotalCurrency+=TradeCurrency;
   sLog += StringFormat("%s/<br/>%s</td>\r\n<td>%.2f/<br/>%.2f</td>\r\n",TimeToString(TimeParam[1]), TimeIntervalToStr(TimeParam[0], TimeParam[1]), Drw, TradeCurrency );
   sLog += p;
   FileWriteString(lh,sLog);
  }
//+------------------------------------------------------------------+
//|                                                                  |
//+------------------------------------------------------------------+
void EnterBuy(double lot)
  {

   CTrade Trade;
   Trade.LogLevel(LOG_LEVEL_NO);

   for(int i=0; i<LG; i++)
     {
      if(bDirect[i])
        { //send buy
         Trade.Buy(lot,pair[i]);
         Ticket[i]=Trade.ResultDeal();
        }
      else
        { //send sell
         Trade.Sell(lot,pair[i]);
         Ticket[i]=Trade.ResultDeal();
        }
     }
  }
//+------------------------------------------------------------------+
//|                                                                  |
//+------------------------------------------------------------------+
void EnterSell(double lot)
  {

   CTrade Trade;
   Trade.LogLevel(LOG_LEVEL_NO);

   for(int i=0; i<LG; i++)
     {
      if(bDirect[i])
        { //send sell
         Trade.Sell(lot,pair[i]);
         Ticket[i]=Trade.ResultDeal();
        }
      else
        { //send buy
         Trade.Buy(lot,pair[i]);
         Ticket[i]=Trade.ResultDeal();
        }
     }
  }
//+------------------------------------------------------------------+
//| Expert deinitialization function                                 |
//+------------------------------------------------------------------+
void OnDeinit(const int reason)
  {
//--- destroy timer
   EventKillTimer();

   FileWriteString(lh,"</tbody>\r\n</table>\r\n");
   FileWriteString(lh,"<H2>Total Result</H2>\r\n");
   FileWriteString(lh,"<table border=\"1\" width=\"100%\" cellspacing=\"0\" cellpadding=\"5\">\r\n");
   FileWriteString(lh,"<thead>\r\n<tr>\r\n<th>Deal's<br/>Count</th>\r\n<th>Profit</th>\r\n<th>Max.Drawdown</th>\r\n<th>Pair's Profit</th>\r\n</tr>\r\n</thead>\r\n<tbody>\r\n");
   string p = StringFormat("<tr><td>%d</td>\r\n<td>%.2f</td>\r\n<td>%.2f at<br/>%s</td>\r\n<td>",iTradeCount,TradeTotalCurrency,mDrw,TimeToString(TimeParam[2]));
   for(int i=0; i<LG; i++)
     {
      if(h1[i]!=INVALID_HANDLE) IndicatorRelease(h1[i]);
      p+=StringFormat("%s = %.2f<br/>",pair[i],TradeTotalResult[i]);
     }
   p+="</td>\r\n</tr>\r\n";
   FileWriteString(lh,p);
   FileWriteString(lh,"</tbody>\r\n</table>\r\n");
   FileWrite(lh,"</body>\r\n</html>"); //End log
   FileClose(lh);
  }
//+------------------------------------------------------------------+

bool IsNewCandle()
  {

   static int candle=-1;

   int t1=0;
   switch(_Period)
     {
      case PERIOD_H1:  t1 = Hour();   break;
      case PERIOD_H4:  t1 = Hour4();  break;
      case PERIOD_D1:  t1 = Day();    break;
     }
   if(t1!=candle) {candle=t1; return(true);}
   return (false);
  }
int Hour4(){return((int)Hour()/4);}
//+------------------------------------------------------------------+
//|                                                                  |
//+------------------------------------------------------------------+
int Day()
  {
   MqlDateTime tm;
   TimeCurrent(tm);
   return(tm.day);
  }
//+------------------------------------------------------------------+
//|                                                                  |
//+------------------------------------------------------------------+
int Hour()
  {
   MqlDateTime tm;
   TimeCurrent(tm);
   return(tm.hour);
  }
//+------------------------------------------------------------------+
//|                                                                  |
//+------------------------------------------------------------------+
string TimeIntervalToStr(datetime dt1,datetime dt2)
  {
   string tm;
   if(dt1 >= dt2)   tm = TimeToString(dt1 - dt2);
   else tm = TimeToString(dt2 - dt1,TIME_DATE|TIME_MINUTES|TIME_SECONDS);
   string ta[],ta1[];
   StringSplit(tm,StringGetCharacter(" ",0),ta);
   StringSplit(ta[0],StringGetCharacter(".",0),ta1);
   ta1[0] = IntegerToString( StringToInteger(ta1[0]) - 1970);
   ta1[1] = IntegerToString( StringToInteger(ta1[1]) - 1);
   ta1[2] = IntegerToString( StringToInteger(ta1[2]) - 1);
   return (ta1[0] + "." + ta1[1] + "." + ta1[2] + " " + ta[1]);
  }
//+------------------------------------------------------------------+
//|                                                                  |
//+------------------------------------------------------------------+
string TimeFrameToShortString(ENUM_TIMEFRAMES period)
  {
   switch(period)
     {
      case PERIOD_H1:  return ("H1");
      case PERIOD_H4:  return ("H4");
      case PERIOD_D1:  return ("D1");
     }
   return ("");
  }
//+------------------------------------------------------------------+
The first EA version for testing can be found in the attached testBasket.mq5 file. The algorithm contains nothing special, although much attention is paid to the report forms. Let's clarify the meaning of the EA inputs:
- SELLPROFIT. When the combined WPR indicator reaches this value, close all positions opened for selling the basket. The default value is 0%.
- SELL1LIMIT. This is the minimum value of the combined WPR for point 1 (see the image above) to start identifying the basket selling pattern. The default value is 70%.
- SELL2FROM. Maximum value of the combined WPR for point 2 to identify the basket sell pattern. By default, 60% is an overbought level.
- SELL2TO. Minimum value of the combined WPR for point 2 for the final identification of the basket sell pattern. Default is 50%.
- BUYPROFIT. When the combined WPR indicator reaches this value, close all positions opened for buying the basket. Default is 0%.
- BUY1LIMIT. This is the maximum value of the combined WPR for point 1 to identify the basket buy pattern. The default is -70%.
- BUY2FROM. Minimum value of the combined WPR for point 2 to identify the basket buy pattern. By default, 60% is an oversold level.
- BUY2TO. Maximum value of the combined WPR for point 2 for the final identification of the basket buy pattern. The default is -50%.
- WPR. Period of the WPR standard technical indicator. The default is 20.
Next, test the EA in the Tester starting with January 2016. Selected test date depends on the history quality. We will analyze two patterns forms. The first one has been described above and set by default. The second one is shifted relative to the first one the following way:
- SELLPROFIT. When the combined WPR indicator reaches this value, close all positions opened for selling the basket. This is the value of 0%.
- SELL1LIMIT. This is the minimum value of the combined WPR for point 1 (see the image above) to start identifying the basket selling pattern. This is the value of 80%.
- SELL2FROM. Maximum value of the combined WPR for point 2 to identify the basket sell pattern. This is the value of 70%, overbought level.
- SELL2TO. Minimum value of the combined WPR for point 2 for the final identification of the basket sell pattern. This is the value of 50%.
- BUYPROFIT. When the combined WPR indicator reaches this value, close all positions opened for buying the basket. This is the value of 0%.
- BUY1LIMIT. This is the maximum value of the combined WPR for point 1 to identify the basket buy pattern. This is the value of -80%.
- BUY2FROM. Minimum value of the combined WPR for point 2 to identify the basket buy pattern. This is the value of -70%, oversold level.
- BUY2TO. Maximum value of the combined WPR for point 2 for the final identification of the basket buy pattern. This is the value of -50%.
The result is html reports.
EA report form
The EA reports are easy to comprehend. Let's consider the structure of reports using the EUR basket report as an example.
The first line contains the header with the names of the chart and timeframe the EA has been launched at.
It is followed by the pattern parameters the EA has applied separately to buy and sell baskets: Point 1 — point 1 location: SELL1LIMIT (BUY1LIMIT). Point 2 from: ... to: ... — point 2 location: SELL2FROM (BUY2FROM) and SELL2TO (BUY2TO). Close at — SELLPROFIT (BUYPROFIT) pattern closure point location:
EURUSD H4
Pattern Params:
| BUY | SELL |
|---|---|
|
|
The pattern parameters are followed by the Tester Result table containing data on each trade during the testing period in the following order:
- Num. — index number
- Type — trade type: selling or buying the basket
- WPR(P1/P2) — data of the combined WPR in the Point 1/Point 2 format used to enter the market
- Time(Begin/End/Length) — data on trade time: Market entry time / Exit time / Trade duration
- Drawdown/Profit — maximum drawdown per trade time / final profit. Data in the deposit currency.
- Pair Profit — profit by individual pairs the currency basket consists of. Data in the deposit currency.
Below is the table fragment where we can see that the first trade lasted eight hours and brought the loss of 16.34 USD. In particular, the order on EURUSD was closed with the loss of 2.55 USD:
| Num. | Type | WPR(P1/P2) | Time(Begin/End/Length) | Drawdown/ Profit |
Pair Profit |
|---|---|---|---|---|---|
| 1 | SELL | 86.26/ 67.15 |
2016.03.23 20:00/ 2016.03.24 04:00/ 0.0.0 08:00:00 |
-21.70/ -16.34 |
EURUSD = -2.55 GBPUSD = -1.58 AUDUSD = -2.02 NZDUSD = -3.66 USDCAD = -2.15 USDCHF = -2.97 USDJPY = -1.41 |
The "Total Result" table containing summary data on the testing period in the following order comes last:
- Deal's Count — number of trades for the entire testing period.
- Profit — obtained profit for the entire testing period. Data in the deposit currency.
- Max.Drawdown — maximum drawdown and the moment it was detected. Data in the deposit currency and date.
- Pair's Profit — total profit per each currency pair the basket currency consists of. Data in the deposit currency.
Here is the table directly from the report:
| Deal's Count |
Profit | Max.Drawdown | Pair's Profit |
|---|---|---|---|
| 22 | 189.06 | -52.37 at 2016.05.02 19:53 |
EURUSD = 52.43 GBPUSD = 24.50 AUDUSD = 45.88 NZDUSD = 13.94 USDCAD = 15.73 USDCHF = 12.26 USDJPY = 24.32 |
Obtained reports are attached in DocUSD.zip.
It is noteworthy that transactions on D1 are unexpectedly small. However, there are encouraging signals:
- The EA has shown the positive result on H4 and H1 without any effort from our part.
Although the data is quite limited, we are still able to make preliminary conclusions that can be clarified in the future.
- The pattern is rarely found on the daily timeframe. This trend is most likely to continue on timeframes higher than D1.
- The overbought/oversold level is within the range of 60% — 70% in case of overbought and -60% — -70% in case of oversold. There are no much trades above 70% and below -70%. In this case, point 1 should be above 90% or below -90% to identify the pattern, which is a rare occurrence. Below 60% or above -60%, the point 2 turns out to be near 40% or -40% and approaches the potential flat area. This area is characterized by an even greater volatility of the indicator readings and multiple false entry signals.
Let's finalize the EA and continue with the next currency of the basket — NZD. First, we should make changes in the report form by deducing the "positive drawdown" value. What is the idea behind this concept? The basket is closed according to the indicator readings rather than a certain profit value or specified trading levels. Before the closure, orders within the order basket can be in a drawdown monitored by the EA. These same orders may show significant profit that cannot be fixed since the indicator has not yet reached necessary values for closing. We call this a "positive drawdown" and its maximum values are sent to the report. Now, we know the potential profit and the ability of the basket to move to the positive side.
Let's add this value to the penultimate column of the Tester Result table. The Drawdown/Profit column is now called Drawdown/+Drawdown/Profit. The data from each cell of the column are arranged in the following order: Drawdown/Positive drawdown/Profit. All data are in the deposit currency.
Besides, the maximum positive drawdown is displayed in the Total Result table. Let's introduce an additional penultimate "Max.+Drawdown" column and show the maximum positive drawdown for the entire testing period when the drawdown was fixed.
The source code of the next EA version can be found in the testBasket1.mq5 file attached below.
Obtained NZD basket reports are in the DocNZD.zip archive. The conclusions are as follows:
- Thus, the assumption on the location of the overbought/oversold levels made earlier is confirmed. The NZDUSD_H1_1.html report is added to the archive with the levels close to the possible start of the flat movement with a large number of false entries. The consequences are quite obvious.
- A small number of trades by this pattern on D1 is confirmed.
- The result on H1 is disappointing. We can assume that the timeframe's "noise level" is a sum of all basket currency pairs causing false signals.
Let's conclude our study using the remaining basket currencies: AUD, EUR, GBP, CAD, JPY and CHF. Find the reports on these currencies in the attached Doc.zip archive. It is time to sum up the results.
Results
- The overbought level is actually within the range of 60-70%, while the oversold one is within -60% and -70%. This assumption is confirmed by the obtained reports and the location of the corresponding level on the standard WPR indicator.
- The check has been conducted on three timeframes and all eight baskets. We have analyzed two forms of the overbought/oversold lines' breakthrough pattern:
- Point 1 of the pattern is above 80%. The oversold level is on 70%. Point 2 lies within 70% and 50%. The basket is closed when the indicator ≤ 0%. The form of the pattern for entering the market to sell the basket is shown here. The form of the buy entry is symmetric with a minus sign.
- Point 1 of the pattern is above 70%. The oversold level is at 60%. Point 2 lies between 60% and 50%. The basket is closed when the indicator ≤ 0%. The form of the pattern for entering the market to sell the basket is shown here. The form of the basket buy entry is symmetric with a minus sign.
- I should note once again that there are very few deals on D1, and we will no longer refer to it in this article. Let's use the data from the Total Result tables of all reports to form the summary tables for other timeframes. The table shows the results of the EA's trading in the deposit currency for each currency basket and both pattern forms described in the previous paragraph:
H1 timeframe AUD EUR USD GBP NZD CAD CHF JPY Pattern 1 -590 90 -37 -991 -141 -80 -118 -514 Pattern 2 -259 -67 328 -714 -352 -446 -118 -272 H4 timeframe AUD EUR USD GBP NZD CAD CHF JPY Pattern 1 286 -72 189 -400 104 60 -209 120 Pattern 2 -208 25 40 80 172 10 -69 -176
Let's pay attention to the discouraging results on H1. Probably, this is due to the high "noise" level of currency pairs on this timeframe.
- The results on H4 are more promising. We will pay special attention to this timeframe from now on.
The obtained results do not allow us to choose between two forms of the pattern, so we will have to work with both. The potential of the second form seems greater to me, but it is my subjective opinion. We will make the final decision on that later.
Should we complete our work with H1? Not in the least! As you may remember, we have introduced the "positive drawdown" parameter to the report. Comparing it with the conventional drawdown, we can see the following:
- The initial idea of closing the basket according to the combined WPR readings (when its value reaches zero) is not enough. The issue of limiting losses has not been resolved either. Since we deal with a basket of orders, it would be logical to assign a stop loss in the deposit currency and trail the profit in the deposit currency as well. This would prevent us from suffering instant losses while in profit and, on the other hand, allow us to limit potential losses in a reasonable way. Such a method can lead to a positive result on H1 and increase profitability on H4. This is not part of our plans for now, but the proposed technical solution may be useful in the future.
Conclusion
The first stage of pattern testing is complete. The obtained results require serious consideration. In our upcoming work, we are going to focus our attention on sorting out signals, as well as analyze additional signals from other known patterns. This will allow us to obtain new information, as well as gradually refine the already obtained data.
Programs used in the article:
| # | Name |
Type |
Description |
|---|---|---|---|
| 1 | Pair.zip | Archive |
The results of calculating the number of possible trades for all basket currencies by three selected timeframes. |
| 2 |
testBasket.mq5 | Expert Advisor |
Expert Advisor for testing. |
| 3 |
DocUSD.zip | Archive | Html reports concerning the testBasket.mq5 EA operation with USD basket. |
| 4 | DocNZD.zip | Archive | Html reports concerning the testBasket1.mq5 EA operation with NZD basket. |
| 5 |
testBasket1.mq5 | Expert Advisor | EA for testing - next version. |
| 6 | Doc.zip | Archive |
Html reports concerning the testBasket1.mq5 EA operation with other baskets. |
| 7 | test.zip |
Archive | Archive with the testIndexZig-Zag1.mq5 and testWPReur.mq5 indicators. |
Translated from Russian by MetaQuotes Ltd.
Original article: https://www.mql5.com/ru/articles/3339
 Universal Expert Advisor: Accessing Symbol Properties (Part 8)
 Graphical Interfaces XI: Rendered controls (build 14.2)
- Free trading apps
- Over 8,000 signals for copying
- Economic news for exploring financial markets
You agree to website policy and terms of use