
Naive Bayes classifier for signals of a set of indicators
Whether we like it or not, statistics plays a significant role in trading. Starting with the fundamental news full of figures and ending with trade reports or test reports, we cannot do away without statistical indicators. At the same time, the thesis on applicability of statistics in making trade decisions remains one of the most controversial topics. Is the market random, are the quotes stationary, is the probabilistic approach to their analysis applicable? This can be argued indefinitely. It is easy to find materials and discussions with various points of view, strictly scientific calculations and impressive charts on the Internet, as well as on the mql5.com site. However, traders are usually interested in the application aspect — how it all works in practice, in the trading terminal. This article is an attempt to demonstrate a pragmatic approach to the probabilistic model of making trading decisions using a set of technical indicators. Minimum of theory, maximum of practice.
The idea is to assess the potential of various indicators from the perspective of the probability theory and to test the ability of the indicator committee to increase the trading system's win rate percentage.
This will require creating a framework for processing the signals of arbitrary indicators and a simple expert on its basis for testing.
It is suggested to include the standard indicators as working indicators, although the framework will allow including and analyzing other custom indicators as well.
But before designing and implementing the algorithms, a little theory is still necessary.
Introduction to the conditional probability model
The title of the article mentions a naive Bayes classifier. It is based on the famous Bayes' formula, which will be briefly considered here. It is named "naive" because of the necessary assumption about the independence of the random variables described by the formula. The independence of the indicators will be discussed later, but for now — the formula itself.
![]() (1)
(1)
- P(H) is the a priori probability, known from the history of observations, the probability of the state H;
- P(E) is the total probability of event E with all the existing hypotheses taken into account, several of which are usually present (it should be noted that the hypotheses must be disjoint, i.e. there can be only one state of the system at a time; links are provided for those who want to delve into the theory);
- P(E|H) is the occurrence probability of the event E when the hypothesis (state) H is true;
- P(H|E) is the a posteriori probability of the hypothesis (state) H when observing the event E.
Consider a simple trading system as an example. Such states of the market as upward movement (buy), downward movement (sell) and sideways fluctuations (wait) are usually taken as hypotheses H. The signals of indicators that describe the probable market state are used as events E.
For signals of a specific indicator, it is easy to calculate the probabilities from the right side of the formula (1) for the available history, and later find out the most probable state of the market P(H|E).
However, the calculation requires a more distinct definition of the hypothesis and the methodology for collecting statistics, which will be used as the basis for obtaining the probabilities.
First of all, suppose that the trading is performed by bars (not by ticks). The efficiency of trading can be evaluated by the amount of profit, profit factor or other characteristics. But for the sake of simplicity, we will use the ratio of winning to losing market entries. This directly connects the evaluation of the system to the probability of successful trades (signals used).
We will also limit ourselves to a trading system with no take profit and stop loss levels, without stop loss trailing and changes in the lot size. All these parameters could be introduced to the model, but they would significantly complicate the calculation of probabilities, turning them into multidimensional distributions. The only parameter of the trading system will be the position holding time in bars. In other words, once a market entry is made in a direction selected using the indicators, exit is performed automatically after a predetermined time. This approach is good in that it emphasizes the correctness or falsity of the hypothesis on growth or fall of the quotes. This way the hypothesis is tested in its pure form, without safeguards and cushions.
To crown the topic of simplifications, we will make two more radical moves.
It was mentioned above that "buy", "sell" and "wait" are usually taken as the trading hypotheses. Omitting "wait" would significantly reduce the calculations without losing the generality of the exposition. It may seem that such simplifications would negatively affect the applicability of the obtained result, and it is partly so. However, if you pay attention to the amount of material still left to be read even with such simplifications, then, you might agree that it would be good to get a working model first, and supplement it with details later, gradually. Those who want to build more complex models taking the probability densities into consideration can find the corresponding works on the Internet (including in English, such as Reasoning Methods for Merging Financial Technical Indicators, where a hybrid probabilistic decision-making system is described).
Finally, the second and concluding radical move is the combination of the "buy" and "sell" states into one, but with a universal meaning — "market entry". Differently directed signals of an indicator are generally used symmetrically, in a similar manner. For example, overbought state according to the indicator becomes a sell signal, while oversold state — a buy signal.
In other words, hypothesis H is now a successful market entry in either of two directions (buy or sell).
Under these conditions, the probabilities in the right side of the formula (1) can be calculated on the selected quotes history as follows.
![]()
Since it is possible to make a successful entry on any bar — one of the directions becomes profitable (the spread is neglected here, because D1 is selected as the working timeframe, as described in more detail below).
P(E) = number of bars with indicator signals / total number of bars
P(E|H) = the number of bars with indicator signals that match the profitable trading direction / total number of bars
The probability of that the selected indicator's signal points at the conditions for opening a successful trade can be calculated on history using a formula obtained after the simplification.
![]() (2)
(2)
where Nok is the number of correct signals, and Ntotal is the total number of signals.
The framework for calculating this probability for any indicator will be implemented a little later. As we will see, this probability is usually close to 0.5, and it is necessary to do certain research in order to find the conditions where it stably exceeds 0.5. However, indicators with a large value are rare. For standard indicators, which will be studied primarily, this probability varies in the range of 0.51-0.55. It is clear that such values are too small and are more likely to "break even" rather than steadily increase the deposit.
To solve this problem, it is necessary to use multiple indicators instead of one. In itself, this decision is not new, it is used by most traders. But probability theory allows conducting a quantitative analysis of the indicators' efficiency in different combinations and evaluate the potential effect.
Formula (1) for the case of three indicators (A, B, C) will look as follows:
![]() (3)
(3)
It should be brought to a form that is convenient for algorithmic calculation. Fortunately, Bayes' theory is applied in many industries, and, therefore, it is possible to find a ready-made recipe for our case.
In particular, there is such a filed as Naive Bayes spam filtering. There is no need to study it thoroughly. Only the basic concepts are relevant. A document (for example, an email message) is marked spam if it contains certain characteristic words. The general occurrence of words in the language and the probability of finding them in spam are known. Similarly, we know the general probabilities of indicator signals and the percentage of their "hits". In other words, to make the spam processing theory fully fit into our probabilistic trading theory, it is sufficient to replace the "spam" hypothesis with "successful trade", and the "word" event with "indicator's signal".
Then formula (3) can be expanded through the probabilities of individual indicators in the following way (see the calculations above):
![]() (4)
(4)
Computations of P(H|A), P(H|B), P(H|C) are performed according to formula (2) for each indicator separately.
Of course, it is easy to extend formula (4) to any number of indicators when necessary. In order to get the idea of how the number of indicators affects the probability of a correct trade decision, suppose that all indicators have the same probability value:
![]()
Then formula (4) becomes:
![]() (5)
(5)
where N is the number of indicators.
The graph of this function for various values of N is shown in Figure 1.
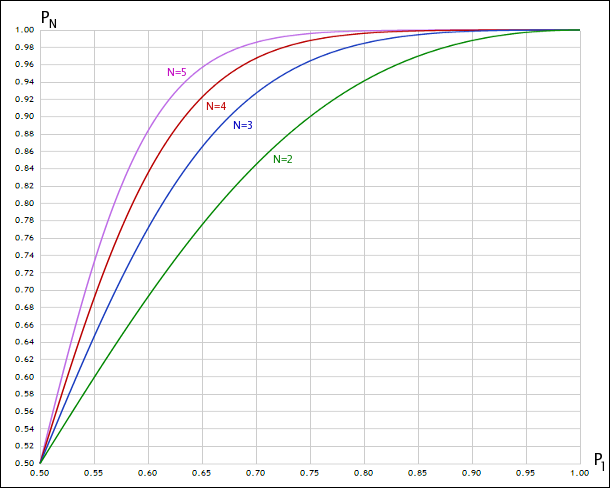
Fig. 1. Appearance of joint probability with different numbers of random variables
Thus, at p = 0.51, we get P(3) = 0.53, which is unimpressive; but at p = 0.55, P(3) = 0.65, which is a noticeable improvement.
Independence of indicators
The formulas considered above are based on the assumption of independence of the analyzed random processes, which are the indicator signals in this case. But is this condition met?
Obviously, certain indicators, including many from the standard ones, have a lot in common. As a visual illustration, Figure 2 shows some of the built-in indicators.
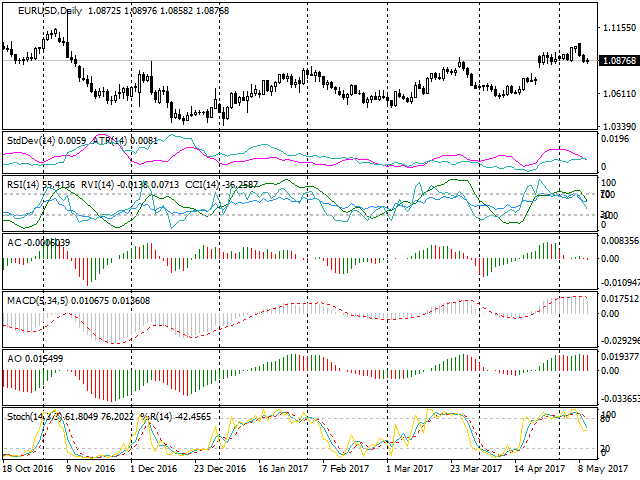
Fig. 2. Groups of similar standard indicators
It is easy to see that the Stochastic and WPR indicators for the same period, overlaid on each other in the last window almost repeat each other. This is not surprising, since their formulas are arithmetically equivalent.
A little higher in the screenshot, the MACD and Awesome Oscillator indicators are identical, corrected for the moving average type. In addition, since both are plotted based on moving averages (MA), they cannot be called independent of the MA themselves.
RSI, RVI, CCI are also strongly correlated. It should be noted that practically all standard oscillators are similar, the correlation coefficients will be close to 1.
There is also a notable coincidence among the volatility indicators, ATR and StdDev in particular.
All this should be considered when forming a set of indicators for the trading system, as the real effect of committee of dependent indicators will be much lower than the expected theoretical one in practice.
By the way, the same situation occurs when training neural networks. Traders often use them to try to process the data from many voluntaristically selected indicators. However, feeding dependent vectors as inputs significantly reduces the effectiveness of training, since the computing power of the network is wasted. The volume of analyzed data may seem large, but the information contained in them is duplicated, meaningless.
A strict approach to this problem requires calculating the correlation between the indicators and forming sets with the least pairwise values. This is a separate and large area of research. Those interested can find related articles on the Internet. Here, we will follow the general ideas based on the above observations. For example, one of the sets may look like this: Stochastic, ATR, AC (Acceleration/Deceleration) or WPR, Bollinger Bands, Momentum.
It should be noted here that the Acceleration/Deceleration (AC) indicator is essentially a derivative of the oscillator. Why is it suitable for inclusion in the group?
Let us represent a series of quotes (or an oscillator derived from them) in a simplified form as periodic oscillations, for example, cosine or sine. The derivatives of these functions are equal to:
![]() (6)
(6)
![]()
Correlations of these functions and their derivatives are zero.
![]() (7)
(7)
![]()
Therefore, the use of the first derivative of an indicator is generally a good candidate for consideration as an additional independent indicator.
The second derivative, on the other hand, is a questionable candidate in such oscillatory processes, because the chances of getting a replica of the original signal are high.
To summarize the discussion about the independence of the indicators, it makes sense to dwell on whether the copies of the indicator, calculated with different periods, can be considered independent.
It can be assumed that the answer depends on the ratio of the periods. A slight difference obviously preserves the dependence of the indicators, and, therefore, a noticeable difference is required. This is in part consistent with classical methods, such as the Elder's triple screen method, where timeframes that usually differ by at least 5 times are equivalent to analyzing indicators with different time periods.
It should be noted that in the considered system, not the indicator values should in fact be the independent variables, but the trade signals directly generated by them. However, for most indicators of the same type (for example, oscillators) the principles of trade signal generation are similar. Therefore, strong or weak dependence of the time series is equivalent to strong or weak dependence of the signals.
Design
So, we have dealt with the theory and are now ready to get down to what and how to code.
Statistics of the indicators' trade signals will be collected in a special expert. For the expert to be able to trade based on the values of arbitrary indicators, it is necessary to implement a framework (essentially, an mqh header file), which gets the description of the used indicators and signal generation methods on their basis via the input parameters. For instance, there should be an option to set two moving averages of different periods in the settings, and generate buy and sell signals when the fast MA crosses the slower MA up and down, respectively.
The EA will have an explicit control of the bar opening and will trade at the Open prices only. This is not a real expert, but a tool for calculating the probabilities and testing the hypotheses. It is important for the check to pass quickly, because there are infinitely many options for indicator sets.
D1 will be used as the default working timeframe. Of course, nothing stops you from performing analysis on any other timeframe. However, D1 is the least susceptible to random noise, and the analysis of the regularities existing for several years meets the specificity of the probabilistic approach the most. In addition, spread can usually be neglected for strategies trading on D1, which nullifies the dismissal of the intermediate "wait" state of the system. For intraday trading, however, such an assumption could not be made, and it would be necessary to calculate the probability of a greater number of hypotheses.
As mentioned earlier, the EA will open positions based on indicator signals and close them after a predetermined amount of time. For this purpose, a corresponding input parameter is introduced. Its default value is 5 days. This is a characteristic period for the D1 timeframe, it is used in many researches on trading that also use D1.
The EA and the framework will be cross-platform, that is, you will be able to compile and run them both in MetaTrader 4 and MetaTrader 5. This feature will be provided by the publicly available wrapper header files, which allow using the MQL API MetaTrader 4 in the MetaTrader 5 environment. Moreover, conditional compilation will be used in some cases: specific parts of the codes will be wrapped in the #ifdef __MQL4__ and #ifdef __MQL5__ preprocessor directives.
Implementation in MQL
The framework for indicators
Overview of the framework for processing indicator signals will start with consideration of the indicator types that will be needed. The most obvious enumeration includes all built-in indicators, as well as the iCustom item for custom indicators. The enumeration will be required for selecting the indicators via the input parameters of the framework.
enum IndicatorType
{
  iCustom,

  iAC,
  iAD,
  tADX_period_price,
  tAlligator_jawP_jawS_teethP_teethS_lipsP_lipsS_method_price,
  iAO,
  iATR_period,
  tBands_period_deviation_shift_price,
  iBearsPower_period_price,
  iBullsPower_period_price,
  iBWMFI,
  iCCI_period_price,
  iDeMarker_period,
  tEnvelopes_period_method_shift_price_deviation,
  iForce_period_method_price,
  dFractals,
  dGator_jawP_jawS_teethP_teethS_lipsP_lipsS_method_price,
  fIchimoku_tenkan_kijun_senkou,
  iMomentum_period_price,
  iMFI_period,
  iMA_period_shift_method_price,
  dMACD_fast_slow_signal_price,
  iOBV_price,
  iOsMA_fast_slow_signal_price,
  iRSI_period_price,
  dRVI_period,
  iSAR_step_maximum,
  iStdDev_period_shift_method_price,
  dStochastic_K_D_slowing_method_price,
  iWPR_period

};
Name of each built-in indicator contains a suffix with information on the parameters of the indicator itself. The first character of an element indicates the number of available buffers, for example: i — one buffer, d — two, t — three. All this is just a hint for the user. If he specifies an incorrect number of parameters or an index of nonexistent buffer, the framework will output an error to the log.
Naturally, for each indicator, it is necessary to specify not only its type in the input parameters, but also the actual parameters as a string, the buffer number and the bar number to start reading the data.
The indicator values are to be used for generating signals. Theoretically, there can be any number of different signals, but the main variations will be brought together in another enumeration.
enum SignalCondition
{
  Disabled,
  NotEmptyIndicatorX,
  SignOfValueIndicatorX,
  IndicatorXcrossesIndicatorY,
  IndicatorXcrossesLevelX,
  IndicatorXrelatesToIndicatorY,
  IndicatorXrelatesToLevelX
};
Thus, signals can be formed if:
- the indicator value is not empty;
- the indicator value has the required sign (positive or negative);
- the indicator crosses another indicator (it should be noted here that when describing the signal, it is necessary to provide the ability to set 2 indicators);
- the indicator crosses a certain level (here it becomes evident that there must be a field for entering the level);
- the indicator is positioned in the required manner relative to another indicator (for example, above or below);
- the indicator is positioned in the required manner relative to a given level;
The first element — 'Disabled' — allows disabling any condition for generating signals. We will provide several identical groups of input parameters for describing the signals, and each signal will be disabled by default.
It is easy to guess from the names of the previous enumeration's items that it is necessary to somehow set the required sign of values and position of lines relative to each other. Another enumeration will be added for this purpose.
enum UpZeroDown
{
  EqualOrNone,
  UpSideOrAboveOrPositve,
  DownSideOrBelowOrNegative,
  NotEqual
};
EqualOrNone allows checking for:
- empty value in combination with SignOfValueIndicatorX
- being equal to a level in combination with IndicatorXrelatesToLevelX
UpSideOrAboveOrPositve allows checking for:
- upward crossing with IndicatorXcrossesIndicatorY
- value being positive with SignOfValueIndicatorX
- upward crossing of a level with IndicatorXcrossesLevelX
- growth of indicator values on consecutive bars with IndicatorXrelatesToIndicatorY, if X and Y are the same indicator
- position of X being above Y with IndicatorXrelatesToIndicatorY, if X and Y are different indicators
- position of an indicator being above a level with IndicatorXrelatesToLevelX
DownSideOrBelowOrNegative allows checking for:
- downward crossing with IndicatorXcrossesIndicatorY
- value being negative with SignOfValueIndicatorX
- downward crossing of a level with IndicatorXcrossesLevelX
- fall of indicator values on consecutive bars with IndicatorXrelatesToIndicatorY, if X and Y are the same indicator
- position of X being below Y with IndicatorXrelatesToIndicatorY, if X and Y are different indicators
- position of an indicator being below a level with IndicatorXrelatesToLevelX
NotEqual allows checking for:
- being not equal to a level (value) with IndicatorXrelatesToLevelX
When a signal is triggered, it must be processed. To do this, let us define a special enumeration.
enum SignalType
{
  Alert,
  Buy,
  Sell,
  CloseBuy,
  CloseSell,
  CloseAll,
  BuyAndCloseSell,
  SellAndCloseBuy,
  ModifyStopLoss,
  ModifyTakeProfit,
  ProceedToNextCondition
};
Here are the main actions for signal processing: message output, buying, selling, closing all open orders (buy, sell or both), position reversal from sell to buy, position reversal from buy to sell, modification of stop loss or take profit levels, and also transition to the next condition (signal) check. The last point allows chaining the signal checks (for example, checking if the main buffer crossed the signal line, and if so, checking if it happened above or below a certain level).
It can be seen that the list of actions does not contain the placement of pending orders. This is left outside the scope of this work. Those interested can expand the framework.
With all these enumerations available, it is possible to describe certain groups of attributes, which are used for setting the working indicators. One group looks like the following:
input IndicatorType Indicator1Selector = iCustom; // ·     Selector
input string Indicator1Name = ""; // ·     Name
input string Parameter1List = "" /*1.0,value:t,value:t*/; // ·     Parameters
input string Indicator1Buffer = ""; // ·     Buffer
input int Indicator1Bar = 1; // ·     Bar
The Indicator1Name parameter is designed for setting the name of the custom indicator, when Indicator1Selector is set to iCustom.
The Parameter1List parameter allows setting the indicator parameters as a comma-separated string. The type of each input parameter will be detected automatically, for example: 11.0 — double, 11 — int, 2015.01.01 20:00 — datetime, true/false — bool, "text" — string. Certain parameters (such as types of moving averages or price types) can be set not by a number, but by a string without quotes (sma, ema, smma, lwma, close, open, high, low, median, typical, weighted, lowhigh, closeclose).
Indicator1Buffer is the number or name of a buffer without quotes. Supported buffer names: main, signal, upper, lower, jaw, teeth, lips, tenkan, kijun, senkouA, senkouB, chikou, +di, -di.
Indicator1Bar — number of the bar, default is 1.
Once all indicators are defined, they can be used as a basis for forming signals, i.e. conditions for triggering events. Each signal is defined by a group of input parameters.
input string __SIGNAL_A = "";
input SignalCondition ConditionA = Disabled; // ·     Condition A
input string IndicatorA1 = ""; // ·     Indicator X for signal A
input string IndicatorA2 = ""; // ·     Indicator Y for signal A
input double LevelA1 = 0; // ·     Level X for signal A
input double LevelA2 = 0; // ·     Level Y for signal A
input UpZeroDown DirectionA = EqualOrNone; // ·     Direction or sign A
input SignalType ExecutionA = Alert; // ·     Action A
It is possible to set an identifier for each signal in the __SIGNAL_ parameter.
'Condition' selects the condition for checking the signal. Next, set one or two indicators and one or two values of levels to be used (the second level is reserved for the future and will not be used in this experiment). Indicators in the 'Indicator' parameters are either the indicator number from the corresponding group of attributes, or an indicator prototype in the form of:
indicatorName@buffer(param1,param2,...)[bar]
This entry format enables determining the used indicator quickly, without its detailed description using the attribute group. For example,
iMA@0(1,0,sma,high)[1]
returns the High values, with the bar number 1 taken at each current bar of working expert (the most recent complete bar, for which the final High price is known).
Thus, indicators can be set both in dedicated groups of attributes (for subsequent reference by number from signals), and directly in the signals in the 'Indicator' parameter (X or Y). The first method is convenient when the same indicator is to be used in different signals or as X and Y inside one signal.
The 'Direction' parameter specifies the direction or sign of the value for triggering a condition. When the signal is triggered, the corresponding action is performed according to 'Execution'.
Next come the examples of determining indicators and signals on their basis.
It is currently defined in the framework that an indicator may not have more than 20 parameters, the maximum number of dedicated groups with indicator attributes is 6 (but as it was said earlier, indicators can be additionally set directly in the signal), and 6 signals at most. All this can be changed in the source code. The IndicatN.mqh file is attached at the end of the article.
This file additionally implements several classes that contain all the logic for parsing the indicator parameters, calling them, checking the conditions and returning the check results to the calling code (which is the expert).
In particular, to pass the instructions on the need to perform a certain action from the SignalType enumeration considered above, a simple public TradeSignals is used, which contains Boolean field corresponding to the enumeration items:
class TradeSignals
{
  public:
    bool alert;
    bool buy;
    bool sell;
    bool buyExit;
    bool sellExit;
    bool ModifySL;
    bool ModifyTP;

    int index;
    double value;

    string message;

    TradeSignals(): alert(false), buy(false), sell(false), buyExit(false), sellExit(false), ModifySL(false), ModifyTP(false), value(EMPTY_VALUE), message(""){}
};
When the required conditions are met, the fields are set to true. For example, if the CloseAll action is selected, the buyExit and sellExit flags are set in the TradeSignals object.
The 'index' field contains the serial number of the triggered condition.
The 'value' field can be used to pass a custom value, for example: a new stop loss level obtained from the indicator values.
Finally, the 'message' field contains a message for the user, describing the situation.
The details on implementation of all classes can be found in the source code. It uses the auxiliary fmtprnt2.mqh (formatted output to the log) and RubbArray.mqh ("rubber" array) header files, which are also attached.
The IndicatN.mqh framework header file should be included in the expert code using the #include directive. As a result, once compiled, the group of input parameters with the indicator attributes can be seen in the EA's settings dialog:
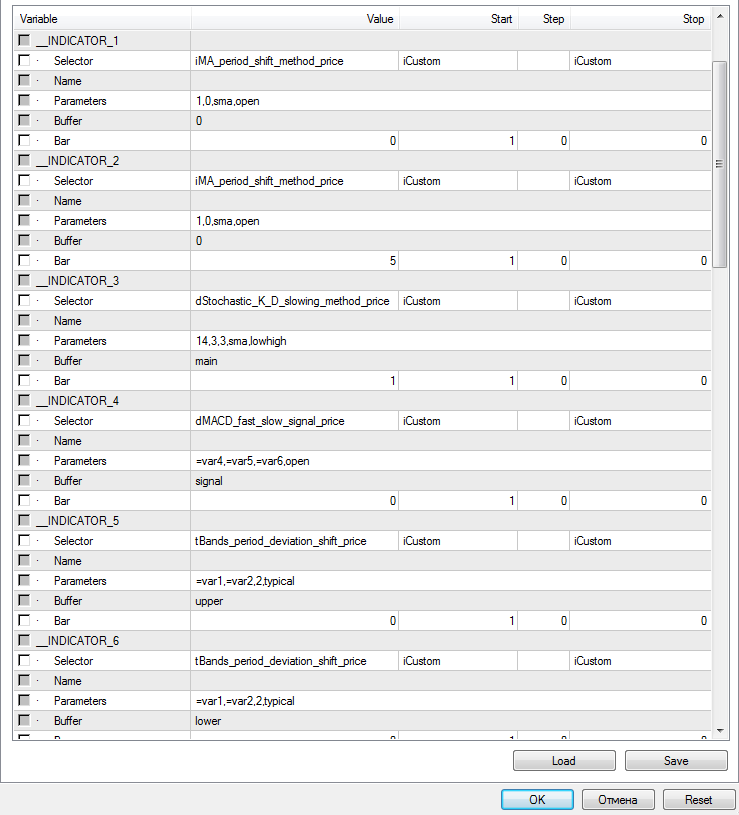
Fig. 3. Indicator settings
and with signal definitions:
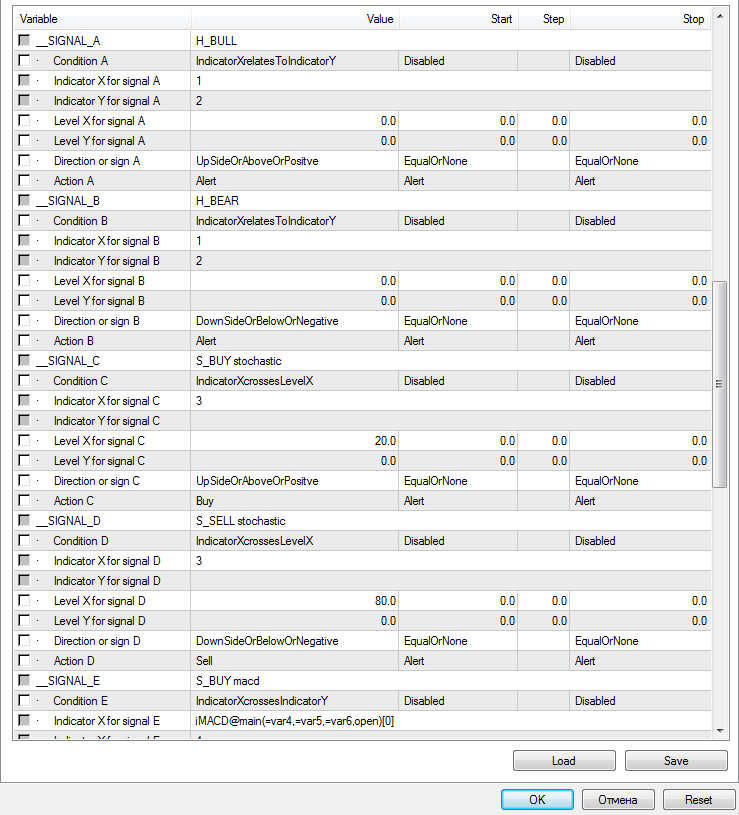
Fig. 4. Trade signal settings
The screenshots show already preset values. They will be considered in more detail once we move on to the concept of the EA and start configuring specific trading strategies. It should also be noted here that, when setting the indicator attributes, it is possible to replace any numerical parameters with expressions of type =var1, =var2 and so on up to 9. They refer to the framework's special input parameters with the same names (var1, var2, etc.), designed for optimization. For example, an entry:
iMACD@main(=var4,=var5,=var6,open)[0]
means that the parameters of the fast, slow and signal moving averages of MACD can be optimized via the var4, var5 and var6 input parameters, respectively. And even with the optimization disabled, during a single test run, the values of the corresponding attributes of an indicator will be read from the specified input parameters of the framework.
Test ExpertTo facilitate the coding, let us move all the trade functions to a special class and arrange it as a separate Expert0.mqh header file. Since quite simple trading systems are to be tested, the class allows only opening and closing positions.
Thus, all routine operations with indicators and those related to trading are moved to header files.
#include <IndicatN.mqh>
#include <Expert0.mqh>
The indstats.mq4 file itself will have only a few lines of code and simple logic.
Since the EA is supposed to compile and work in MetaTrader 5 after changing its extension to mq5, let us add header files providing the transition of the codes to a new environment.
#ifdef __MQL5__
  #include <MarketMQL4.mqh>
  #include <ind4to5.mqh>
  #include <mt4orders.mqh>
#endif
Now, see the input parameters of the expert.
input int ConsistentSignalNumber = 1;
input int Magic = 0;
input float Lot = 0.01f;
input int TradeDuration = 1;
'Magic' and 'Lot' are required for creating an Expert object from the Expert0.mqh file.
Expert e(Magic, Lot);
The ConsistentSignalNumber parameter will contain the number of trade signals to be combined in order to increase the robustness.
The TradeDuration parameter sets the number of bars to hold an open position. As it was mention before, trades will be opened according to signals and exited after 5 bars, i.e. days, because the D1 timeframe is used.
The OnInit event handler will initialize the indicator framework.
int OnInit()
{
  return IndicatN::handleInit();
}
The OnTick handler will provide the control over the opening of the bar.
void OnTick()
{
  static datetime lastBar;

  if(lastBar != Time[0])
  {
    const RubbArray<TradeSignals> *ts = IndicatN::handleStart();
    ...
    lastBar = Time[0];
  }
}
During the formation of a new bar, check all indicators and related conditions, by calling the indicator framework again. This results in an array of triggered signals — the TradeSignals objects.
Now it is time to discuss the accumulation of statistics.
Once met, each condition (event) of the framework generates a signal with the 'alert' flag by default. This will be used for counting the number of signals from the indicators, as well as the number of fulfilled states of the system, i.e. the cases (bars) when buying or selling would be successful.
To calculate the statistics, we will describe the arrays.
int bars = 0; // total count of bars/samples
int bull = 0, bear = 0; // number of bars/samples per trade type
int buy[MAX_SIGNAL_NUM] = {0}, sell[MAX_SIGNAL_NUM] = {0};  // unconditional signals arrays
int buyOnBull[MAX_SIGNAL_NUM] = {0}, sellOnBear[MAX_SIGNAL_NUM] = {0}; // conditional (successful) signals arrays
In our case of bar-wise trading, each bar is a potential new entry into a trade lasting 5 bars. Each such segment is characterized by a rise or fall of the quotes and is marked as bullish or bearish, respectively.
All buy and sell signals will be summed up in the 'buy' and 'sell' arrays. If a corresponding signal matches the "bullishness" or "bearishness" of the segment, it is also accumulated in the buyOnBull or sellOnBear array, depending on the type.
The following code inside OnTick will fill the arrays.
    const RubbArray<TradeSignals> *ts = IndicatN::handleStart();
    bool up = false, down = false;
    int buySignalCount = 0, sellSignalCount = 0;

    for(int i = 0; i < ts.size(); i++)
    {
      // alerts are used to collect statistics
      if(ts[i].alert)
      {
        // while setting up events, enumerated by i,
        // hypothesis H_xxx should come first, before signals S_xxx,
        // because we assign up or down marks here
        if(IndicatN::GetSignal(ts[i].index) == "H_BULL")
        {
          bull++;
          buy[ts[i].index]++;
          up = true;
        }
        else if(IndicatN::GetSignal(ts[i].index) == "H_BEAR")
        {
          bear++;
          sell[ts[i].index]++;
          down = true;
        }
        else if(StringFind(IndicatN::GetSignal(ts[i].index), "S_BUY") == 0)
        {
          buy[ts[i].index]++;
          if(up)
          {
            if(PrintDetails) Print("buyOk ", IndicatN::GetSignal(ts[i].index));
            buyOnBull[ts[i].index]++;
          }
        }
        else if(StringFind(IndicatN::GetSignal(ts[i].index), "S_SELL") == 0)
        {
          sell[ts[i].index]++;
          if(down)
          {
            if(PrintDetails) Print("sellOk ", IndicatN::GetSignal(ts[i].index));
            sellOnBear[ts[i].index]++;
          }
        }

        if(PrintDetails) Print(ts[i].message);
      }
    }
After obtaining the array of triggered signals, iterate over its elements in a cycle. Enabled 'alert' flag indicated the collection of statistics.
Before analyzing the code in more depth, let us introduce a special convention on naming the signals (events). Hypotheses on the bullish or bearish state of the market will be marked with H_BULL and H_BEAR identifiers. These events must be defined using the framework's input parameters first, before other events (indicator signals). This is required in order to set the appropriate characteristics based on the confirmed hypotheses - the Boolean variables 'up' and 'down'.
The indicator signals must have identifiers starting with S_BUY or S_SELL.
As it can be seen, using a reference to the number of the activated event ts[i].index, its identifier is obtained through calling the GetSignal function. In case hypotheses are fulfilled, the general counters of bullish or bearish segments are updated. In the case of signal generation, their total number is counted for each signal type, as well as the index of their success, that is, the number of matches with the current hypotheses.
Remember that either the H_BULL hypothesis or the H_BEAR hypothesis is true on each bar.
Apart from collection of statistics, the EA should support trading by signals. For this purpose, the body of the cycle will be supplemented with a check for the 'buy' and 'sell' flags.
      if(ts[i].buy)
      {
        buySignalCount++;
      }
      else
      if(ts[i].sell)
      {
        sellSignalCount++;
      }
The trading functionality will be implemented after the cycle. First of all, open positions (if any) are closed after the specified period.
    if(e.getLastOrderBar() >= TradeDuration)
    {
      e.closeMarketOrders();
    }
Then, a buy or sell is performed depending on the joint signals.
    if(buySignalCount >= ConsistentSignalNumber
    && sellSignalCount >= ConsistentSignalNumber)
    {
      Print("Signal collision");
    }
    else
    if(buySignalCount >= ConsistentSignalNumber)
    {
      e.closeMarketOrders(e.mask(OP_SELL));

      if(e.getOrderCount(e.mask(OP_BUY)) == 0)
      {
        e.placeMarketOrder(OP_BUY);
      }
    }
    else
    if(sellSignalCount >= ConsistentSignalNumber)
    {
      e.closeMarketOrders(e.mask(OP_BUY));

      if(e.getOrderCount(e.mask(OP_SELL)) == 0)
      {
        e.placeMarketOrder(OP_SELL);
      }
    }
If the buy and sell signals contradict each other, such a state is skipped. If the number of buy and sell signals is equal to or greater than the predefined number ConsistentSignalNumber, the corresponding order is opened.
It should be noted that setting a value for ConsistentSignalNumber smaller than the number of configured signals allows testing the trading system in a mode that combines all or most strategies. In the normal operation mode, the EA will use intersection, but not union, because ConsistentSignalNumber must be exactly equal to the number of signals in order to find joint events. For example, with 3 signals configured and ConsistentSignalNumber set to 3, trading will be performed only when all three events occur simultaneously. If ConsistentSignalNumber is set to 1, trades will be opened when any (at least one) of 3 signals is received.
The OnDeinit handler will output the collected statistics on alerts or on history of orders to the log.
The complete source code of the expert can be seen in the indstats.mq4 file.
Trade signal settings
All other signals must be checked against the two hypotheses on buying or selling. To do this, configure the H_BULL and H_BEAR signals, as well as their indicators.
To get the bar prices, use the iMA indicator with a period of 1. In the __INDICATOR_1 group, set:
Selector = iMA_period_shift_method_price
Parameters = 1,0,sma,open
Buffer = 0
Bar = 0
In the __INDICATOR_2 group, set similar settings except for the number of the bar: it should be set to 5, the number of bars to be used in the TradeDuration parameter.
In other words, the expert does not trade in the statistics collection mode. Instead, it analyzes the change in quotes between the 5th and 0th bar, as well as indicator signals on the 5th or 6th bar, depending on the price type used: for indicators working based on Open prices, values can be taken from the 5th bar, and for all others - from 6th. In the statistics collection mode, bar number 5 is a virtual current bar, and all subsequent bars provide information on the "future" fulfillment of the hypotheses on the bullish or bearish market.
It should be stated that in the trading mode, the signals will be taken from bar 0 (if the indicator is based on Open prices) or bar 1 (in other cases). If the expert did not operate using the Open prices, but analyzed ticks instead, it would be necessary to check the indicator values at bar 0.
Presence of these two modes — statistics collection and trading — implies the necessity to create various parameter sets that differ in the numbers of working bars. We will start with a set for collecting statistics, and then easily convert it into a real, trading set.
These two copies of the MA indicator will be used for configuring the hypotheses. In the group __SIGNAL_A, enter:
The __SIGNAL_B group will be configured similarly, except the direction:
__SIGNAL_B = H_BEAR
Direction or sign = DownSideOrBelowOrNegative
To test the probabilistic model of trading, 3 standard indicator-based strategies will be used:
- Stochastic
- MACD
- BollingerBands
It should be stated beforehand that the parameters of all indicators have been optimized, with some of them intentionally left as references to input parameters var1, var2, etc., to demonstrate this feature of the framework. To recreate the positive results on the data of your provider, each strategy will probably have to be reoptimized.
The Stochastic-based strategy is to buy when the indicator crosses the level 20 upwards and sell when it crosses the 80 level downwards. To do this, define the __INDICATOR_3 group:
Since the High and Low prices are used for the indicator, it is necessary to take the bar number 6 — the latest complete one before the bar 5, where the virtual trading starts in case a signal is triggered.
Buy and sell signals are adjusted according to the Stochastic indicator. Group for buying:
Group for selling:
The MACD-based strategy lies in buying when the main line crosses the signal line upwards and selling when it crosses downwards.
Configure the group of the __INDICATOR_4 indicator:
Periods 'fast', 'slow', 'signal' will be read from parameters var4, var5, var6, available for optimization. They are currently set to 6, 21, 6, respectively. Bar number 5 is used, because the indicator is plotted based on Open.
Since the number of groups for configuring the indicators is limited, the 'main' buffer will be defined directly in the signals. Group for buying:
Group for selling:
The BollingerBands-based strategy involves buying when the High of the previous bar breaks the upper line of the indicator shifted 2 bars to the right, and selling when the Low of the previous bar breaks the lower line of the indicator shifter 2 bars to the right. Below are the settings of the two indicator lines.
__INDICATOR_5:
Selector = tBands_period_deviation_shift_price
Parameters = =var1,=var2,2,typical__INDICATOR_6:
Period and deviation are specified in var1 and var2 as 7 and 1, respectively. Bar 5 can be used in both cases, despite the price type of typical, because the indicator lines are shifted 2 bars to the right, i.e. are actually calculated on past data.
Finally, the groups for setting up signals look as follows.
All settings are attached as .set files at the end of the article.
Results
Statistics by indicators
To calculate the probabilities, the statistics for the period 2014.01.01-2017.01.01 for the EURUSD D1 pair will be used. The EA settings for the statistics collection mode are contained in the indstats-stats-all.set file.
The collected data are output to the log. Below is an example:
: bars=778
: bull=328 bear=449
:    buy:    328      0     30      0     50      0     58      0
:  buyOk:      0      0     18      0     29      0     30      0
:   sell:      0    449      0     22      0     49      0     67
: sellOk:      0      0      0     14      0     28      0     41
: totals:   0.00   0.00   0.60   0.64   0.58   0.57   0.52   0.61
: Stats by name:
:  macd=0.576 [57/99]
:  bands=0.568 [71/125]
:  stochastic=0.615 [32/52]
The total number of bars is 778, 328 of them were suitable for a successful 5-day buy trade and 449 were suitable for a successful 5-day sell trade. The first 2 columns contain the counters of hypotheses — the same 2 numbers, and the next pairs of columns refer to the corresponding trading strategies, each of which is represented by a column for buy trades and a column for sell trades. For example, a Stochastic-based strategy generated 30 buy signals, 18 of which were profitable, and also 22 sell signals, 14 of which were profitable. Summing the total number of successful signals and dividing them by the number of generated signals results in efficiency value (probability of success based on history data) for each of them.
- Stochastic — 0.615
- MACD — 0.576
- Bands — 0.568
Test trading
To make sure that the statistics are calculated correctly, it is necessary to run the EA in the trading mode. To do this, edit the bar numbers in the settings, replacing 5 by 0 and 6 by 1. In addition, trading strategies should be enabled one after another by setting the Action parameter to Buy and Sell instead of Alert. For example, to check the stochastic-based trading, replace the value Alert to Buy in the Action parameter of the __SIGNAL_C (S_BUY stochastic) group, and Alert to Sell in the __SIGNAL_D (S_SELL stochastic) group.
The corresponding settings for all 3 strategies are provided in the files indstats-trade-stoch.set, indstats-trade-macd.set, indstats-trade-bands.set, respectively.
Running the EA 3 times with these sets of parameters produces 3 logs with trade summaries. The statistics are at the very end. For example, the following line is obtained for stochastic:
: Buys: 18/29 0.62 Sells: 14/22 0.64 Total: 0.63These figures indicate the real trades: 18 buys out of 29 are profitable, 14 sells out of 22 are profitable, the total efficiency of the signal is 0.63.
Results of the MACD-based and BollingerBands-based strategies are provided below.
: Buys: 29/49 0.59 Sells: 28/49 0.57 Total: 0.58
: Buys: 29/51 0.57 Sells: 34/59 0.58 Totals: 0.57Let us summarize the values of all strategies in one list.
- Stochastic — 0.63
- MACD — 0.58
- Bands — 0.57
Almost complete correspondence to the theory from the previous subsection can be seen here. Slight difference is explained by the fact that the trade signals may overlap if they are within 5 bars, a repeated trade will not be opened in that case.
Naturally, it is possible to analyzer the trade reports for each individual strategy.
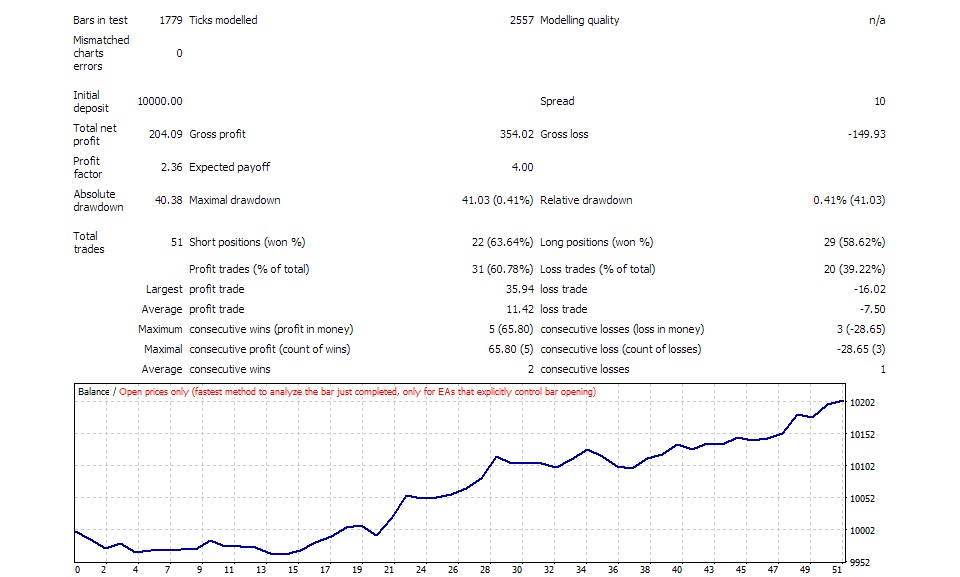
Fig. 5. Report on the strategy based on the Stochastic indicator
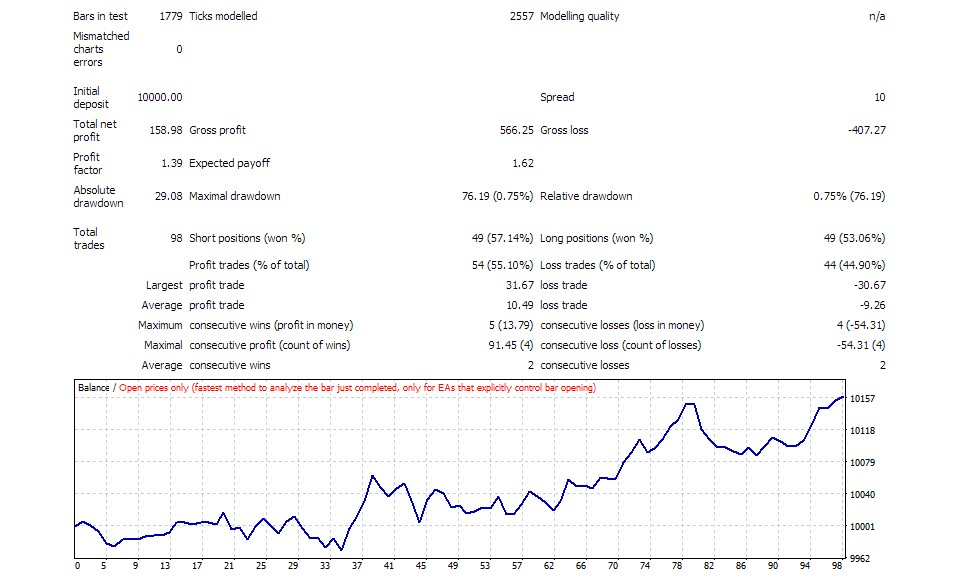
Fig. 6. Report on the strategy based on the MACD indicator
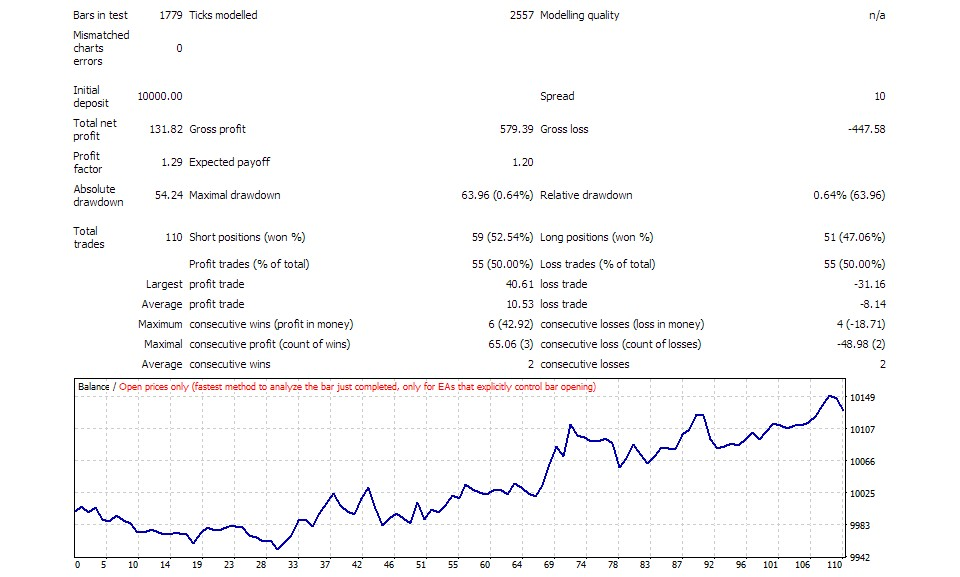
Fig. 7. Report on the strategy based on the BollingerBands indicator
The theoretical probability of a trade being successful when entering according to synchronous signals from all three indicators is calculated using the formula (4).
P(H|ABC) = 0.63 * 0.58 * 0.57 / (0.63 * 0.58 * 0.57 + 0.37 * 0.42 * 0.43) = 0.208278 / (0.208278 + 0.066822) = 0.208278 / 0.2751 = 0.757
To test this situation, it is necessary to take all three signals into account and change the value of the ConsistentSignalNumber parameter from 1 to 3. The corresponding settings are located in the indstats-trade-all.set file.
According to trading in the tester, the total efficiency of such a system in practice is equal to 0.75:
: Buys: 4/7 0.57 Sells: 5/5 1.00 Total: 0.75Here is the test report:
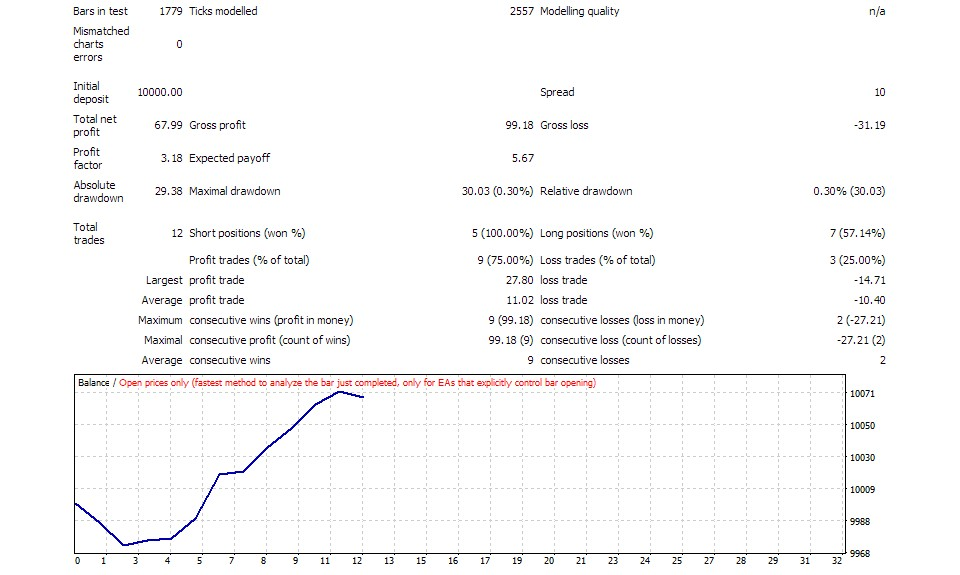
Fig. 8. Report on combination of strategies based on 3 indicators
Below is a table of trade figures for each of the indicators separately and for their superposition.
| Profit,$ | PF | N | DD,$ | |
|---|---|---|---|---|
| Stochastic | 204 | 2.36 | 51 | 41 |
| MACD | 159 | 1.39 | 98 | 76 |
| Bands | 132 | 1.29 | 110 | 64 |
| Total | 68 | 3.18 | 12 | 30 |
As it can be seen, an increase in the success probability is achieved due to less frequent but more accurate entries. The number of trades and the total profit decreased, although the profit factor and maximum drawdown improved by at least 35%, and more than twice in some cases.
Conclusion
The article considers the simplest implementation version of the probabilistic approach to making trade decisions based on indicator signals. A special expert was used to show that the theoretical calculations of the increase in the probability of successful trades using the Bayes' formula correspond to the results obtained in practice.
Since the signal generation is discrete, the signals of different indicators may not coincide. A situation is possible, when the superposition of indicators does not give common signals confirmed by all indicators. One of possible solutions to this problem is the introduction of a time tolerance between the signals.
In a more general case, it is possible to calculate the probability density of the implementation of trade hypotheses depending on the state (and not the signals) of the indicators. For example, the overbought or oversold value determined based on a specific value of the oscillator gives the percentage (probability) of successful entries. Additionally, the probability of a successful trade is obviously dependent on the selected Stop Loss and Take Profit parameters, the lot management system and many other parameters of the system. All this can be analyzed from the point of view of probability theory and used for more accurate, but also more complex calculation of trade decisions.
Files attached below:
- indstats.mq4 (also indstats.mq5) — expert.
- common-includes.zip — archive with common header files.
- additional-mt5-includes.zip — archive with additional header files for MetaTrader 5.
- instats-tester-sets.zip — archive with set-files for settings.
Translated from Russian by MetaQuotes Ltd.
Original article: https://www.mql5.com/ru/articles/3264
 Universal Expert Advisor: Accessing Symbol Properties (Part 8)
 Cross-Platform Expert Advisor: Stops
 Testing patterns that arise when trading currency pair baskets. Part I
- Free trading apps
- Over 8,000 signals for copying
- Economic news for exploring financial markets
You agree to website policy and terms of use
The implementation is throwing few errors while using RubbArray.mqh
The implementation is throwing few errors while using RubbArray.mqh
Yes, MetaQuotes have changed MQL language since the publication date, breaking back compatibility (alas) with many existing source codes. ArrayCopy can not be used for arbitary pointers anymore.
You may use the attached header file as a relacement.