Technical Analysis: What Do We Analyze?
Introduction
Nowadays, it's very easy to start trading on currency fluctuation. It's enough to install the MetaTrader (MT) at your computer and open an account in a dealing center; after that you can start trading. Of course, everybody wants to trade with a profit. And here the world experience in trading comes to help us.
The most popular tools for technical analysis are included in MetaTrader in the form of indicators, and in the Internet you can find a lot of publications on this topic written by most popular authors.
Unfortunately, even if you strictly follow the instructions and recommendations of the most respected gurus of technical analysis, it won't lead you to a desired result all the time. Why? This article is not going to give an answer to this question. But let's try to understand, what do we analyze?
What Do We Analyze?
Modern financial market is a very sensitive organism. Almost any event in the world affects it somehow. A huge amount of different factors constantly affect the market, what results in constant fluctuation of quotes. These exact constantly changing currency quotes are the only and sufficient object of investigation during the technical analysis of market.
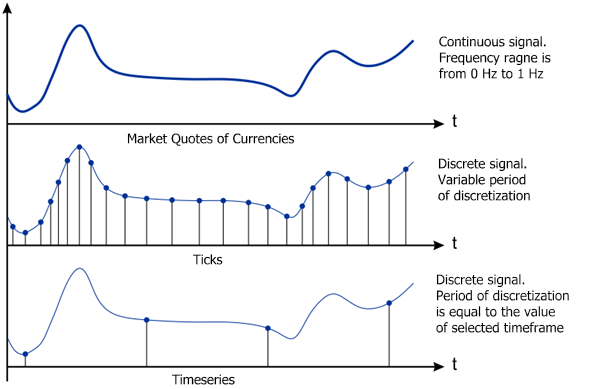
Suppose that our computer is connected to a dealing center through the MetaTrader client terminal. In this case, the quotes come to the terminal in a discrete form - as separate indications (ticks). We know that the initial continuous signal can be restored by its indications if the sampling frequency is more than two times higher than the maximum frequency within the range of the initial signal. We don't need to restore the initial continuous signal at this stage; but if in our case it's theoretically possible, it means that the initial signal wasn't distorted during the process of sampling.
Unfortunately, a variable frequency of sampling is used when forming ticks. Indications of quotes (ticks) come to the terminal with an approximate interval from a half of second to several minutes. We don't know the algorithm of alteration of sampling frequency; in addition, we don't know the maximum frequency within the range of the initial signal. All of it prevents us from evaluating the distortion made during the process of sampling.
It is only left to suppose that this way of quantization doesn't lead to a loss of information and the initial continuous signal (market quotes of currencies) is not distorted significantly. Considering this supposition and the fact that frequency of sampling may reach 2 Hz, we obtain an estimated (approximate) value of upper limit of the range of initial signal, it is 1 Hz.
It's pretty difficult to process the signal when the frequency of sampling is variable, but practically, the analysis of market by the ticks that come to the terminal is pretty rare. Most of people prefer using timeframes starting from M30 and higher.
If you select the Line Chart mode in the MetaTrader terminal, then you'll see a sequence of indications with a fixed interval of sampling, which is equal to the value of the current timeframe. Let's skip some details and consider that this sequence is formed from the ticks that come to the terminal.
Then if we choose one indication (tick) from the incoming sequence each 30 minutes, in the result we will obtain a sequence with the fixed frequency of sampling that is equal to 1/1800 Hz; this will be the sequence of indications for the M30 timeframe. The sequences of the other timeframes are formed in the same way. Obviously, this way of forming sequences of indications is virtually equivalent to the quantization of the initial continuous signal with the interval equal to the value of selected timeframe.

Figure 1. Forms of representation of quotes
The above discussion results in a conclusion that the object of technical analysis is the constantly changing flow of market quotes, which are available to us in a discrete form as the indications with variable frequency of discretization (ticks) and the indications with fixed frequency of discretization (timeframes). At that the spectrum of initial quotes lies within the range from 0 Hz to 1 Hz.
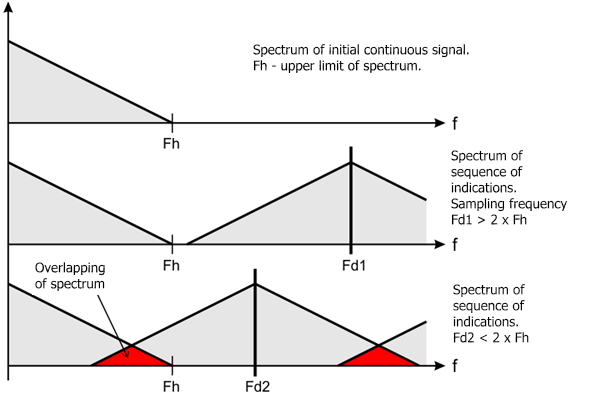
Since the period of the smallest timeframe M1 in MetaTrader is equal to 1 minute, then, due to our model, the initial signal of quotes at forming the sequence of indications will undergo the discretization of 1/60 Hz frequency. This frequency is 120 times lower than the doubled value of the upper limit of the spectrum of initial signal (2 Hz). Such transformation of the signal will definitely lead to its irreversible distortion. Fig. 2 shows the nature of this distortion.

Figure 2. Overlapping of spectrum
Suppose that the spectrum of initial signal looks like the one shown in fig. 2, and its upper limit is equal to Fh. If the sampling frequency Fd1 is higher than Fh, then the sequence of indications obtained as a result of quantizing will have a non-overlapping spectrum. Such sequence is an adequate discrete representation of the initial signal.
Lowering of frequency of sampling below the doubled value of Fh will lead to overlapping of spectrum in the resulting sequence, and it will stop being an equivalent of the initial continuous signal. The fig. 2 demonstrates an example, when the sampling frequency Fd2 is slightly lower than the doubled value of Fh. As already mentioned before, the sampling frequency for the M1 timeframe is 120 times lower than the acceptable one.
Such a low frequency of resulting sequence leads to multiple overlapping of the spectrum and much higher distortion comparing to the case demonstrated in the fig. 2. As we move to the larger timeframes the sampling frequency becomes lower and the level of distortion increases. Formally, the sequences of indications of different timeframes are not mirroring each other in addition to not displaying the initial quotes correctly.
Thus, when using different indicators and systems that work with timeframes, we analyze a distorted representation of quotes. In this case, the technical analysis of quotes is complicated significantly, and the use of strict mathematical methods becomes meaningless in most cases.
For example, a spectrum of any timeframe, which is obtained through the discrete Fourier transformation, won't be an estimation of the spectrum of the initial signal of quotes. It will be a spectrum of initial quotes repeatedly overlaid over itself with a shift of frequency. Repeated overlaying of spectrum may also lead to the formation of a fractal structure in the resulting sequence.
The quantitative estimation of distortion brought to the initial quotes goes beyond the scope of this article, so let's just try to demonstrate that it exists.
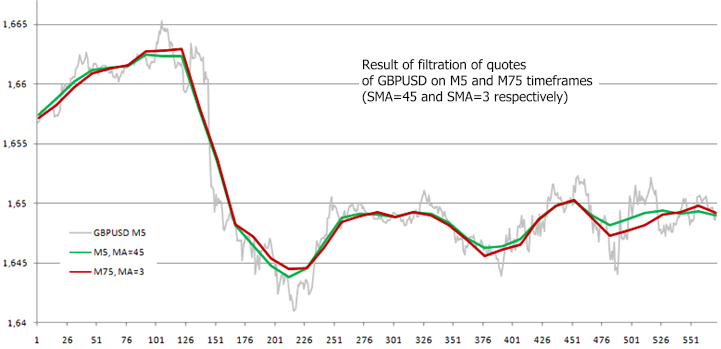
As the initial signal we will take a random fragment of sequence of indications of GBPUSD M5 quotes. The fig. 3 (green line) demonstrates the result of filtration of this signal using the low-pass filter, which is the analogous to the SMA filter with period 45 used in MetaTrader.
Next, from the initial sequence choose each 15-th indication and form a sequence for the M75 timeframe (it doesn't exist in MetaTrader 4). Thus, using a simple thinning of initial sequence we've decreased its sampling frequency by 15 times.
The fig. 3 (red line) demonstrates the result of filtration of the obtained signal using the low-pass filter, which is analogous to the SMA with period 3. The period of filter was decreased proportionally to decreasing of frequency, to keep the frequency of the cut of lower-pass filter unchanged.

Figure 3. Filtration of GBPUSD quotes
If we assume that the signal is not distorted during decreasing of the frequency of discretization, then the result of its filtration should be analogous to the filtration of the initial signal. The fig. 3 clearly demonstrates the difference between the curves obtained as the result of processing the M5 and M75 sequences. Most probably, it's the influence of distortion caused by overlapping of spectrum when decreasing the sampling frequency.
Maybe, using a low-pass filter is not the best way of determining the distortion caused by overlaying of spectrum, but the given example demonstrates that it can affect the real indications of quotes even if you use the simple methods of analyzing.
Using the sequences of different timeframes is convenient for visualization of quotes; however, if we use a mathematical approach for analyzing them, then switching to the larger timeframes can only be used for decreasing the amount of calculations due to decreasing of amount of processed indications.
If the volume of calculation is not considered, then switching to a lager timeframe is meaningless except for the addition distortion of the initial signal. Theoretically, the optimal variant is analyzing quotes by ticks that come to the terminal. If we had the history of ticks, then using the interpolation (for example, splines) we would be able to switch to the sequence with the fixed sampling frequency and select a pretty high one.
When there is no such information from the point of view of distortion of quotes, for analysis it's better to use the sequence of the smaller timeframe M1. If necessary, we can decrease the sampling frequency of this sequence, but before doing it we should suppress its frequencies that are higher than a half of the new frequency of discretization.
The degree of effect of described distortion on the result of analysis of quotes strongly depends on the sensitiveness of algorithms that are used for the analysis. It's possible that in some cases, this distortion won't affect the obtained result significantly; however, for a correct interpretation of calculations, you should remember about its presence.
A row of assumptions is accepted in the above discourse to draw the attention to the distortion connected with the overlaying of spectrum. In fact, there are many factors that can prevent us from using strict mathematical methods of digital processing in MetaTrader - presence of gaps between the indications of quotes, skipped bars, the method of forming timeseries used in MetaTrader, which accepts the value of a tick as the indication value at that the time of that tick doesn't correspond to the time of forming of the indication.
There is another question connected to the representation of quotes in the client terminal. I want to draw your attention to it. Until now, we didn't say anything about the mode of displaying candlesticks.
There are a lot of works devoted to the analysis of candlesticks; they consider different methods of forecasting the behavior of quotes on the basis of the shape of candlesticks or the combination of them. Let's not doubt in the effectiveness of these methods, but let's check, what we'll face when trying to conduct a mathematical analysis of values of «Low» and «High» at any timeframe.
As you know, «Low» and «High» are equal to the minimal and maximal value of quotes within the period of selected timeframe. We don't know the time when those values were reached. The «Low» and «High» values don't have a definite binding to the time axis; the only thing we know about them is that the quotes have reached those values somewhere within the selected timeframe. This, both «Low» and «High» are the sequences of indications with a variable period of discretization, which takes a random value within the range from zero to the value that is equal to the selected timeframe.
From the point of view of mathematical methods of digital processing of signals, such representation of the «Low» and «High» values - as a function of time - is pretty exotic. Of course, we are free to use the standard algorithms for processing these sequences; but how to interpret the obtained results? For example, what is the frequency of cutting of a simple first-order low-pass filter when filtering such signals?
To work with the functions represented in the form of a sequence with randomly changing frequency of sampling, you probably need a mathematical apparatus; and applying of algorithms developed for sequences with fixed sampling frequency will probably lead to uncertainty of obtained results when analyzing «Low» and «High». That's why we need to be carefully with forecasting the behavior of quotes on the basis of mathematical analysis of sequences of «Low» and «High».
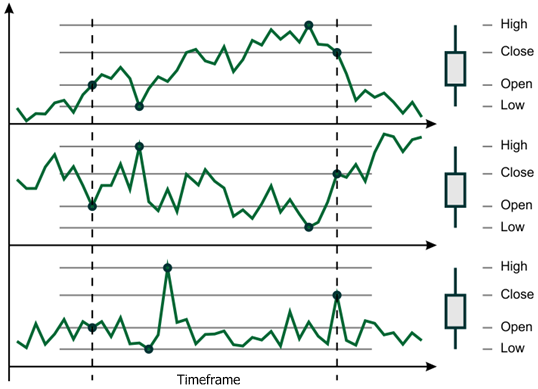
When quotes are represented in the form of candlesticks each of them has not only the «Low» and «High» values, but the «Open» and «Close» values as well; all together they form a candlestick. Let's see, how definite is the representation of quotes that is done by a candlestick on an interval of a timeframe.

Figure 4. Formation of a candlestick
The fig. 4 shows three completely different sequences that result in forming the same candlestick. As you see, it's practically impossible to determine the behavior of quotes by the form of candlestick; and the «Low» and «High» values doesn't have a time binding.
The number of such examples is infinite. Maybe, the representation of quotes as candlesticks is a convenient tool for a quick visual estimation of their behavior, but the «Low» and «High» indications that form the shadows of candlesticks are not really usable for a mathematical analysis. «Open» and «Close» indications are slightly better; however, here face a problem of uncertainty of the time taken as the start of these sequences.
For example, as the «Open» value we take the value of the first tick that comes within the analyzed period; if there are no ticks within the period of the timeframe, then the candlestick won't be formed at all. In addition, when using «Open» and «Close», we shouldn't forget about the errors connected with the overlapping of spectrum.
Here comes a conclusion, that the best way for a mathematical analysis of quotes is to use the sequence of «Close» values taken from the smallest timeframe; and the additional indications «Low», «High» and «Open», which form a candlestick, most probably don't carry any new information.
To analyze quotes, instead of the «Close» value you can try to use a half of the sum of «Open» of the current bar and «Close» of the previous bar, which is divided by two. Maybe, such approach will allow decreasing the influence of uncertainty of moments of start of the «Open» and «Close» indications and defining the time of beginning of timeframe more exactly.
Conclusion
The approach to representation of quotes described in the article is widely spread. It is used not only in MetaTrader, but in the other platforms as well. The same timeframes, bars and candlesticks can be observed in the new MetaTrader 5. We can say that such representation of quotes is traditional, and most probably, it has some advantages; but, from the formal point of view, the quotes that are given to a user are distorted for a mathematical analysis.
The growth of computation performance allows using more and more complicated mathematical algorithms for technical analysis; and those algorithms are often very sensitive to different of inaccuracies. A good example is the algorithm of extrapolation of functions. Despite all of it, technical documentation of indicators doesn't contain any warnings about possible inaccuracies that may appear when switching between timeframes.
The main purpose of this article is to draw attention of developers of technical indicators and trade systems to the fact, that when analyzing dynamics of market quotes using a distorted representation of them, they should consider the influence of that distortion in the results of analysis unless that influence is inessential.
Translated from Russian by MetaQuotes Ltd.
Original article: https://www.mql5.com/ru/articles/173
 The "New Bar" Event Handler
 Interview with Berron Parker (ATC 2010)
 Guide to Testing and Optimizing of Expert Advisors in MQL5
 Evaluation of Trade Systems - the Effectiveness of Entering, Exiting and Trades in General
- Free trading apps
- Over 8,000 signals for copying
- Economic news for exploring financial markets
You agree to website policy and terms of use
Forum on trading, automated trading systems and testing trading strategies
Discussion of article "Technical Analysis: How Do We Analyze?"
newdigital, 2014.06.13 19:28
Learning to Read Forex Charts
Technical analysis is considered one of the easiest ways to analyze the foreign exchange market. It involves the analysis of charts and graphs to ascertain future currency price movements, and differs massively from fundamental analysis in that it does not require the analysis of forex news, reports or other economic releases to establish future price movements.
Becoming a Technical Analyst
The first step in becoming a successful technical analyst is to learn how to read forex charts. Outlined below are some simple steps that every trader should take when first starting out with technical analysis:
When analyzing a currency pair you will need to look out for a prevailing trend. Start off with charts that provide long-term data (for example days, weeks and months) and go back over the course of a number of years. Such charts contain an exhaustive amount of data, thus providing a much clearer picture of exactly what the currency pair is doing than if using short-term charts (5 minutes, 15 minutes, 30 minutes or one hour). This extra data also makes the technical indicators much more steadfast and reliable.
How to Identify a Trend
To identify a trend simply look at the graph presented before you and decide whether it is rising more than it is falling, or vice versa. Trends can be shallow or sharp, weeks short or years long. Practice identifying trends and locating the moment where the trends change direction.
Even if you are a short-term scalper or day trader who wishes to place a trade for no longer than an hour, it is still important to identify trends. Identifying a trend is one of the best steps a trader can take in executing more accurate, profitable trades.
Upon identifying a trend in a long-term chart you will then be able to compare that trend with the one that you have found in the short-term charts. Within the path set by the prevailing trend you will discover that there are a variety of short-term and intermediate-term trends. Overall the pattern on the graph will follow a particular path as set by the longest-term trend.
Identifying Support and Resistance Levels
After this point you will then need to locate the support and resistance levels. In technical analysis these are regarded as the ‘floor’ and ‘ceiling’ points on a graph and are key locations on a chart where the price continually refuses to break through. The price will reach a peak or a valley, after which point it will not go any further, but will instead alter its direction. The more frequently this occurs, the stronger the support and resistance levels are.
Draw a straight line as you pass through most of the support points. Draw another line as you pass through most of the resistance points. This provides you with a lucid picture of the price channel, or the path that the currency pair’s trend is following. This is a highly powerful yet incredibly simply tool for determining a currency’s future pathway.
What is a Range- Bound?
In the event that ‘range bound’ occurs, this simply means that the support and resistance levels are so strong that the graph’s movements appear to ‘bounce’ in a sideways pattern. Nevertheless this generally occurs 80% of the time and many traders prefer to trade within the channels.
Breaking out of a Price Channel
In the event that a currency pair becomes released from a price channel, in some instances it falls back into the channel, and in others it gains momentum and continues to move. The latter movement is better known as a ‘momentum market’, and is an alternative way to trade the range: by setting an entry order for the price to break out, either below or above the channel.