
How to Secure Your Expert Advisor While Trading on the Moscow Exchange

Table Of Contents
- INTRODUCTION
- CHAPTER 1. DISCRETE NATURE OF A PRICE FLOW AND HOW TO CONFRONT IT
- 1.8. Replacing Stop Loss Levels with Buy Stop Limit and Sell Stop Limit Orders in the Expert Advisor
- CHAPTER 2. MARKET LIQUIDITY ANALYSIS
- CHAPTER 3. SECURE TRADING AND EXPERT ADVISOR TESTING MODES
- 3.1. Using "Sleep Mode" as as Alternative to Tick-by-Tick Control
- 3.2. The Sample Expert Advisor Based on Moving Averages and Checking Its Trading Logic Once Per Period
- CONCLUSION
Introduction
Anyone who trades on the financial markets is subject to the risks of financial losses. The nature of these risks is different but the outcome is still the same – lost money, wasted time and lasting sense of frustration. To avoid these unpleasant things, we should follow a few simple rules: manage our risks (Money Management), develop reliable trading algorithms and use profitable trading systems. These rules relate to different areas of trading and we should combine them, so that we may hope for reliable positive trading results.
Currently, you can find plenty of books and articles covering the issues of money management, as well as trading systems that can be used in everyday trading activity. Unfortunately, the same is not true for the works on basic safety rules of the market trading.
The article aims to change that by describing the mentioned safety rules that should be followed when trading on the markets. The rules consist of methods and trading practices allowing you to avoid considerable financial losses caused by price spikes, lack of liquidity and other force majeure. The article focuses on the technical risk leaving aside the topics of trading strategy development and risk management.
It brings practical approach to the trading theory described in the article "Principles of Exchange Pricing through the Example of Moscow Exchange's Derivatives Market". While the mentioned article dealt with the theory of exchange pricing, the present paper describes the mechanisms protecting you and your Expert Advisor from accidental financial collapse caused by some dangerous exchange pricing elements.
Chapter 1. Discrete Nature of a Price Flow and How to Confront It
1.1. Discrete Nature of a Price Flow. Price Gaps
Liquidity is one of the main concepts in the stock market. It is the ability of the market to buy from you and sell you the goods at prices close to the market ones. The higher the market liquidity, the more closely market prices follow each other. Pricing is a discrete process. It means that the price we are used to consists of multiple transactions following each other at high speed. The flow of transactions is formed by quotes, or tick charts, that are then re-organized into candle or bar charts of any timeframe. From a trader's perspective, such charts are continuous. At any given moment of time, a bar or a candle has a certain price. This can be shown the following way:
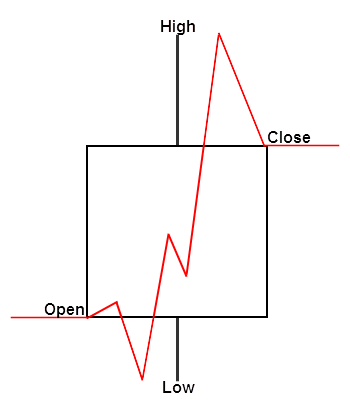
Fig. 1. Price bar and its continuous price function
Regardless of what point of the price bar we take, it has its own price level displayed as a red line. This is exactly how bars are represented in "Every tick" mode of the MetaTrader strategy tester. In that mode, the prices are generated continuously and sequentially. For example, if the step is 1 and the price has moved from 10 to 15, the prices 11, 12, 13, and 14 are also available to us during the price movement. In reality, the price is discrete and changes in small leaps. Besides, these price changes may not always be consistent and regular. Sometimes, the price may skip several levels at once. Let's examine the same bar using more realistic (discrete) character of price changes:
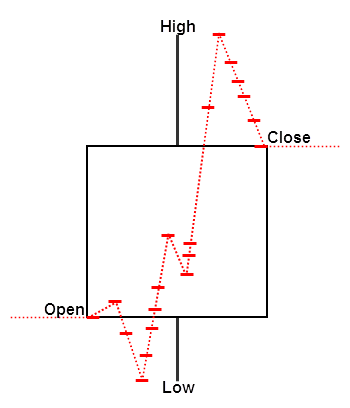
Fig. 2. Price bar and its discrete price function
As we can see, there is actually no such thing as continuous price (displayed here as a dashed red line). This means that your market orders (especially stop ones) may be triggered at an unintended price! This is a very dangerous feature of market orders. Let's examine how a Buy Stop pending order may have been triggered on this bar. Suppose that we send a market request when the price reaches the level of 64 203 or higher (blue dashed line crossing the price bar). However, this price may simply not exist inside the bar. In that case, our order is activated by the next price which is significantly higher than 64 203:
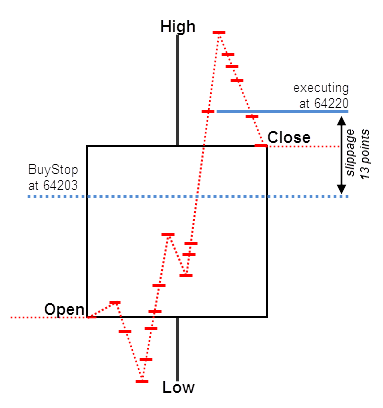
Fig. 3. Activating pending orders at discrete prices
In our example, the actual order execution occurs only at 64 220 points which is 13 points worse than the price we have requested. The difference between these prices forms a slippage. If a market is liquid enough, discrete prices arrive in a dense flow moving from one level to another smoothly. However, if the price changes rapidly, there may be price gaps even on high-liquidity markets. It is impossible to see that gaps observing common price charts but we should be aware of their existence.
1.2. Price Spikes
Due to lack of liquidity, price gaps may reach very high values turning into price spikes (deals performed at the prices deviating too much from the market ones). They are very dangerous both for manual traders and automated trading systems. Such spikes trigger pending stop orders executing them at very unfavorable prices.
Let's consider a simple case: suppose that we trade a RUB/USD futures contract and place a Buy Stop order to buy at 64 200. The stop loss is placed at 64 100. We expect the price to move up, however if that does not happen our stop loss at 64 100 is to limit our loss by 100 point. Our risk is seemingly limited but actually that is not true. Let's observe the case when a price spike occurs activating our stop order at quite different prices:
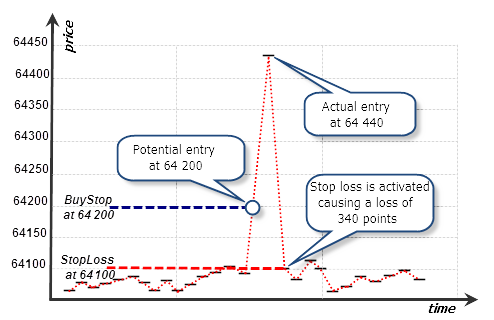
Fig. 4. Tick representation of a spike and Buy Stop order execution
On this tick chart, we can see that one of the ticks is located too far from other ones forming a spike. This tick triggers our Buy Stop order at 64 440. At the next tick, the price returns to its current range triggering our stop order at 64 100. In less than a second, our pending order can be triggered and closed by a stop loss leaving us with a huge loss. Instead of our calculated loss of 100 points, our order loses 340 points.
In reality, spikes may be even bigger. Thus, a single huge spike is enough to ruin our account no matter how large it is! In order to avoid such disasters, you need to comply with the simple protection rules described below.
Please note that in the "Every tick" mode of the strategy tester, such spikes occur at simulated prices that may turn out to be better than in the real market. If we tested our strategy on the price interval displayed in the figure, our pending order would experience a minimum (if any) slippage. As we know, the price flow inside a bar in the strategy tester is fairly continuous meaning that the tester executes our order at the price close to the one set by the order with no slippage. Actually, such cases may be properly considered in the strategy tester. To do that, you should select a special test mode. We will talk more on this in the special section of Chapter 3.
1.3. Managing the Maximum Slippage Using Limit Orders
We have found out that market and stop orders have no protection against a slippage. There may be insufficient liquidity for fulfilling our request or the market may lose its market liquidity for a short time causing price spikes. Moreover, such spikes are a common occurrence at low-liquidity markets, such as FORTS derivatives market. However, you can avoid them by using limit orders instead of market and stop ones.
A limit order is always executed at a price not worse than the specified one. An interesting feature of limit orders in the exchange execution mode is their ability to be executed at the current price even if its level is above or below the specified order price.
For example, if the current price of the RUB/USD futures contract is 64 200, we can set a Buy Limit order at 64 220. That means that we agree to buy if the price is not higher than 64 220. Since the current price of 64 200 is better than the one set in the order, our order is executed immediately after being placed. Thus, we are able to manage the maximum slippage value. If for some reason there is not enough liquidity for the level of 64 220, a part of our order will simply not be executed.
Note that you can manage slippage only by using limit orders. Common market orders in the exchange execution mode do not allow you to set the maximum slippage level. Therefore, limit orders are the only way to maintain security while trading on low-liquidity markets.
It is reasonable to use limit orders for market entries and exits. You can place them even if your strategy requires to enter or exit the market at the current market prices. Replace Buy and Sell orders by Buy Limit and Sell Limit ones respectively. For example, if you are going to buy at the current price, place a limit order with a maximum execution price slightly higher than the current market one. The same is true for selling. In that case, place your Sell Limit order with the price level slightly below the current price. The difference between the price set in a limit order and the current one is a maximum slippage value you can accept.
Let's consider the following example. Suppose that we buy a quite large volume of ED-3.15 EUR/USD futures contract at 1.1356. The current liquidity is low. Such a moment is chosen deliberately to show the benefits of entering the market using limit orders. The moment we enter the market coincides with a price spike that can be seen on the M1 chart:
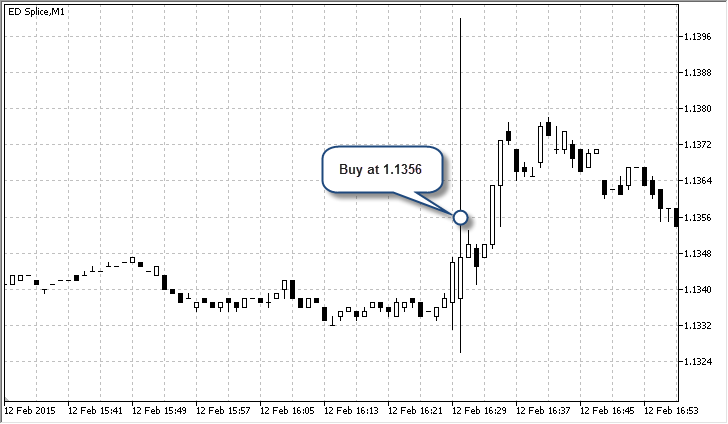
Fig. 5. Entering the market at the moment the price spike occurs, ED-3.15
It is quite obvious that the market entry point is completely unfavorable. Let's analyze the tick chart for that moment:
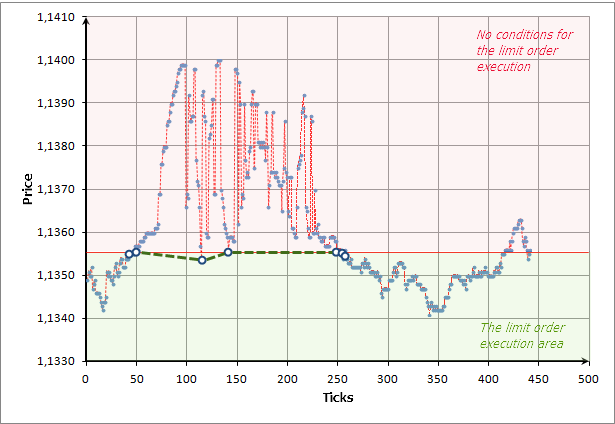
Fig. 6. The tick chart and execution of the limit order during the liquidity breakthrough
Execution of our limit order is shown in large white circles (ticks): ![]() . The ticks are depicted as round blue dots. If we buy at the market price of 1.1356, our market request would be fulfilled in several transactions beginning from the price of 1.1356 and ending with the price of 1.1398. That would cause a strong slippage and our average market entry price would be significantly worse than 1.1356. The more transactions needed to fulfill our request, the worse the average entry price.
. The ticks are depicted as round blue dots. If we buy at the market price of 1.1356, our market request would be fulfilled in several transactions beginning from the price of 1.1356 and ending with the price of 1.1398. That would cause a strong slippage and our average market entry price would be significantly worse than 1.1356. The more transactions needed to fulfill our request, the worse the average entry price.
In our case, such a huge price gap is caused by low liquidity when limit requests disappear for various reasons and the price chaotically oscillates over a wide range. But a limit order has a built-in protection. It is simply not executed if the current price exceeds 1.1356. For example, our limit order was executed in seven transactions - they are shown in large white circles on the chart. There were other prices between these transactions but all of them were worse than 1.1356. Thus, they were simply ignored. After a while, the price stabilized and our order was finally executed in full.
1.4. Manual Setting of a Limit Order Managing the Maximum Slippage
Now, that we have covered a limit order activation principle, it is time to add some practice and use our knowledge in real market conditions. Suppose that our account is connected to the Moscow exchange. Let's place a limit order at the price slightly worse than the current one. Also, let's choose the nearest EUR/USD futures contract (ED-6.15) as our working symbol. Call a position opening window and set a Buy Limit at a price slightly higher than the current Ask one:

Fig. 7. Placing a limit order manually in the exchange execution mode
As we can see on the screenshot, the current Ask price is 1.1242, while we have set a pending price of 1.1245. The difference between our price and the best offer is 0.0003 points (1.1245 - 1.1242 = 0.0003). This value is the maximum slippage we are ready to be exposed to. In the exchange execution mode, such a limit order is equivalent to sending an ordinary Buy or Sell order with maximum slippage (Deviation):

Fig. 8. Executing the market order with the specified deviation
Since a maximum slippage is unavailable in the exchange execution mode, the only way to specify a deviation is setting a limit order in the manner shown in Figure 7.
1.5. Setting the Maximum Slippage in the Exchange Execution Mode Using the Expert Advisor
Now, let's place a limit order using a program. To do this, we should code a simple panel consisting of the following elements:
- BUY button – buy using a BuyLimit order;
- SELL button – sell using a SellLimit order;
- Maximum slippage field (in points) will be added later;
- Buy or sell volume will also be added in the next version of the panel.
The screenshot below shows the first version of the panel:
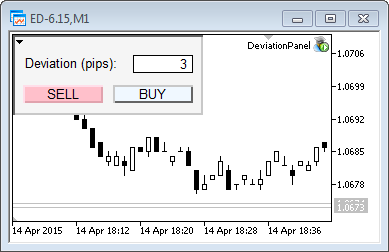
Fig. 9. Setting the maximum slippage in the DeviationPanel
The panel is made as a CDevPanel class. Its source code is as follows:
//+------------------------------------------------------------------+
//|                                                       Panel.mqh  |
//|                                 Copyright 2015, Vasiliy Sokolov. |
//|                                              http://www.mql5.com |
//+------------------------------------------------------------------+
#property copyright "Copyright 2015, Vasiliy Sokolov."
#property link      "http://www.mql5.com"
#include <Trade\Trade.mqh>
#define OP_BUY 0
#define OP_SELL 1
//+------------------------------------------------------------------+
//|                                                                  |
//+------------------------------------------------------------------+
class CDevPanel
  {
private:
   CTrade            Trade;
   string            m_descr_dev;
   string            m_buy_button_name;
   string            m_sell_button_name;
   string            m_deviation_name;
   string            m_volume_name;
   string            m_bg_fon;
   int               m_deviation;
   void              OnObjClick(string sparam);
   void              OnEndEdit(string sparam);
   double            CalcCurrentPrice(int op_type);

public:
                     CDevPanel();
                    ~CDevPanel();
   void              OnChartEvent(const int id,
                                  const long &lparam,
                                  const double &dparam,
                                  const string &sparam);
  };
//+------------------------------------------------------------------+
//| CDevPanel class                                                  |
//+------------------------------------------------------------------+
CDevPanel::CDevPanel(): m_buy_button_name("buy_button"),
                        m_sell_button_name("sell_button"),
                        m_deviation_name("deviation"),
                        m_volume_name("volume"),
                        m_bg_fon("bg_fon"),
                        m_descr_dev("descr_dev"),
                        m_deviation(3)
  {
//--- background
   ObjectCreate(0,m_bg_fon,OBJ_RECTANGLE_LABEL,0,0,0);
   ObjectSetInteger(0,m_bg_fon,OBJPROP_YSIZE,80);
   ObjectSetInteger(0,m_bg_fon,OBJPROP_XSIZE,190);
   ObjectSetInteger(0,m_bg_fon,OBJPROP_BGCOLOR,clrWhiteSmoke);

//--- buy button
   ObjectCreate(0,m_buy_button_name,OBJ_BUTTON,0,0,0);
   ObjectSetInteger(0,m_buy_button_name,OBJPROP_XDISTANCE,100);
   ObjectSetInteger(0,m_buy_button_name,OBJPROP_YDISTANCE,50);
   ObjectSetInteger(0,m_buy_button_name,OBJPROP_XSIZE,80);
   ObjectSetInteger(0,m_buy_button_name,OBJPROP_BGCOLOR,clrAliceBlue);
   ObjectSetString(0,m_buy_button_name,OBJPROP_TEXT,"BUY");

//--- sell button
   ObjectCreate(0,m_sell_button_name,OBJ_BUTTON,0,0,0);
   ObjectSetInteger(0,m_sell_button_name,OBJPROP_XDISTANCE,10);
   ObjectSetInteger(0,m_sell_button_name,OBJPROP_YDISTANCE,50);
   ObjectSetInteger(0,m_sell_button_name,OBJPROP_XSIZE,80);
   ObjectSetInteger(0,m_sell_button_name,OBJPROP_BGCOLOR,clrPink);
   ObjectSetString(0,m_sell_button_name,OBJPROP_TEXT,"SELL");

//--- deviation
   ObjectCreate(0,m_deviation_name,OBJ_EDIT,0,0,0);
   ObjectSetInteger(0,m_deviation_name,OBJPROP_XDISTANCE,120);
   ObjectSetInteger(0,m_deviation_name,OBJPROP_YDISTANCE,20);
   ObjectSetInteger(0,m_deviation_name,OBJPROP_XSIZE,60);
   ObjectSetInteger(0,m_deviation_name,OBJPROP_BGCOLOR,clrWhite);
   ObjectSetInteger(0,m_deviation_name,OBJPROP_COLOR,clrBlack);
   ObjectSetInteger(0,m_deviation_name,OBJPROP_ALIGN,ALIGN_RIGHT);
   ObjectSetString(0,m_deviation_name,OBJPROP_TEXT,(string)m_deviation);

//--- description
   ObjectCreate(0,m_descr_dev,OBJ_LABEL,0,0,0);
   ObjectSetInteger(0,m_descr_dev,OBJPROP_XDISTANCE,12);
   ObjectSetInteger(0,m_descr_dev,OBJPROP_YDISTANCE,20);
   ObjectSetInteger(0,m_descr_dev,OBJPROP_XSIZE,80);
   ObjectSetInteger(0,m_descr_dev,OBJPROP_BGCOLOR,clrWhite);
   ObjectSetString(0,m_descr_dev,OBJPROP_TEXT,"Deviation (pips):");
   ObjectSetInteger(0,m_descr_dev,OBJPROP_COLOR,clrBlack);
   ChartRedraw();
  }
//+------------------------------------------------------------------+
//|                                                                  |
//+------------------------------------------------------------------+
CDevPanel::~CDevPanel(void)
  {
   ObjectDelete(0,m_buy_button_name);
   ObjectDelete(0,m_sell_button_name);
   ObjectDelete(0,m_bg_fon);
   ObjectDelete(0,m_deviation_name);
   ObjectDelete(0,m_descr_dev);
  }
//+------------------------------------------------------------------+
//| Event function                                                   |
//+------------------------------------------------------------------+
void CDevPanel::OnChartEvent(const int id,
                             const long &lparam,
                             const double &dparam,
                             const string &sparam)
  {
   switch(id)
     {
      case CHARTEVENT_OBJECT_CLICK:
         OnObjClick(sparam);
         break;
      case CHARTEVENT_OBJECT_ENDEDIT:
         OnEndEdit(sparam);
     }
  }
//+------------------------------------------------------------------+
//| End edit detect                                                  |
//+------------------------------------------------------------------+
void CDevPanel::OnEndEdit(string sparam)
  {
   if(sparam != m_deviation_name)return;
   int value = (int)ObjectGetString(0, m_deviation_name, OBJPROP_TEXT);
   if(value <= 0)
      ObjectSetString(0,m_deviation_name,OBJPROP_TEXT,(string)m_deviation);
   else
      m_deviation=value;
   ChartRedraw();
  }
//+------------------------------------------------------------------+
//| End obj click                                                    |
//+------------------------------------------------------------------+
void CDevPanel::OnObjClick(string sparam)
  {
   if(sparam==m_buy_button_name)
      Trade.BuyLimit(1,CalcCurrentPrice(OP_BUY));
   if(sparam==m_sell_button_name)
      Trade.SellLimit(1,CalcCurrentPrice(OP_SELL));
   ObjectSetInteger(0,sparam,OBJPROP_STATE,false);
   Sleep(100);
   ChartRedraw();
  }
//+------------------------------------------------------------------+
//| Calc level price                                                 |
//+------------------------------------------------------------------+
double CDevPanel::CalcCurrentPrice(int op_type)
  {
   if(op_type==OP_BUY)
     {
      double ask=SymbolInfoDouble(Symbol(),SYMBOL_ASK);
      return ask + (m_deviation * Point());
     }
   else if(op_type==OP_SELL)
     {
      double bid=SymbolInfoDouble(Symbol(),SYMBOL_BID);
      return bid - (m_deviation * Point());
     }
   return 0.0;
  }
//+------------------------------------------------------------------+
The panel allows setting a maximum slippage in points on the exchanges with the market execution of orders. Actual market entries/exits are performed using limit orders.
The panel works only if a broker provides market execution of orders. Otherwise, the code causes a standard wrong price error when entering a limit order price:
2015.04.15 14:08:39.709 Trades '58406864': failed buy limit 0.10 EURUSD at 1.05927 [Invalid price]
1.6. Buy Stop Limit and Sell Stop Limit Orders as an Alternative to Buy Stop and Sell Stop Orders
Limit orders provide a convenient and natural defense against slippages. But sometimes, it is necessary to use pending orders that should trigger the moment a certain level is broken through. A stop loss order is the most obvious example. Besides, some strategies should respond to the price leaving a certain channel. They also need stop orders to enter the market. However, as we already know, stop orders are subject to slippage and are not protected against liquidity issues. Moreover, you cannot set a maximum slippage value for them.
In this case, we should use Buy Stop Limit and Sell Stop Limit orders. These are algorithmic orders for MetaTrader 5. They are not market ones but are implemented on the MetaTrader server instead. Let's examine the official documentation:
- Buy Stop Limit — this type combines the two first types, [Buy Limit and Buy Stop] , being a stop order to place a Buy Limit order. As soon as the future Ask price reaches the stop level specified in the order (Price field), a Buy Limit order will be placed at the level specified in Stop Limit Price field.
- Sell Stop Limit — this type is a stop order for placing Sell Limit. As soon as the future Bid price reaches the stop level specified in the order (Price field), a Sell Limit order will be placed at the level specified in Stop Limit Price field.
The documentation also provides the images (Fig. 10) depicting the orders' operation principle in MetaTrader 5. The yellow frame marks the two order types we are currently interested in:
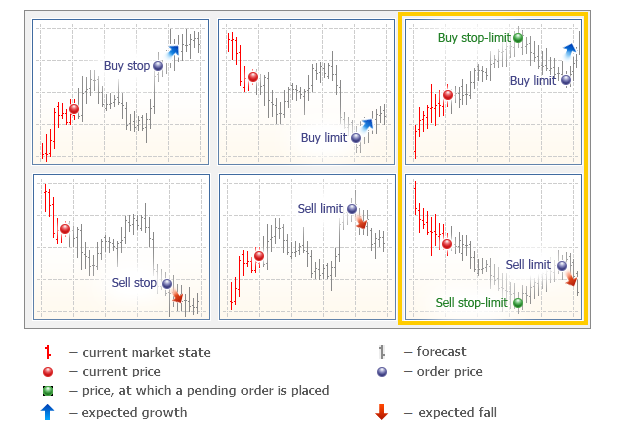
Fig. 10. Types of orders in MetaTrader 5
Thus, these limit orders are placed on the market when the price reaches a certain stop level. For a Buy Stop Limit order, a stop level is placed above the current Ask, while for a Sell Stop Limit one, it is placed below the current Bid. A limit order price in the exchange execution mode can be either above or below these orders' stop price. This feature allows us to configure special stop orders with managed slippage. The image below shows how it works:
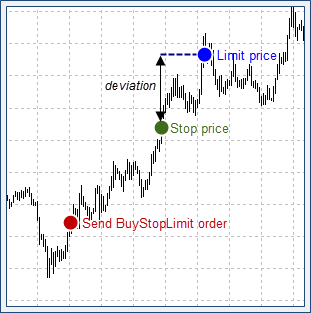
Fig. 11. Setting a maximum slippage by placing a Buy Stop Limit order
We can place a Buy Stop Limit order having a Limit Price exceeding a Stop Price. As soon as the Stop Price is reached, a Buy Limit order is sent and executed immediately, since the Limit Price is worse than the current Stop Price. The difference between Stop Price and Limit Price forms a maximum slippage we decided to set for our orders. Sell Stop Limit orders work the similar way, though a Limit Price should be below a Stop Price in this case.
Now, let's turn to some practice and place a Buy Stop Limit order manually.
1.7. Manual Setting of Buy Stop Limit and Sell Stop Limit Orders Instead of Stop Loss Ones
Suppose that we want to protect our open position using a stop order. But low-liquidity markets are too dangerous and unpredictable to use stop or market orders there. A stop order (for example, a stop loss) has no protection against an unlimited slippage. Thus, large price gaps or spikes may completely ruin our account. To avoid this, we should replace a stop order with a stop limit one.
Let's consider the following example. Suppose that we have a long position at Si-6.15. The stop loss is 56 960. We should set the maximum slippage of five points, so that the Stop Limit price is 56 960 - 5 = 56 955 points:

Fig. 12. Placing a SellStopLimit order as a stop level for a long position
As we can see, such Sell Stop Limit order configuration becomes possible in the exchange execution mode. When the current price reaches 56 960, a limit order for selling at 56 955 is placed. Since the current price of 56 960 is better than the one specified in the limit order, it is immediately executed at 56 960. If there is not enough liquidity at that level, execution is performed at the subsequent prices down to 56 955. The limit order is not executed at prices worse than 56 955 guaranteeing the maximum slippage of five points: 56 960 - 56 955 = 5.
Now, let's protect our short position in the same manner. To close a short position by stop loss, we need to perform an opposite operation — we should buy using a Buy Stop Limit order. Suppose that the current stop loss for our short position is 56 920, then we should use the following Buy Stop Limit order configuration to provide the maximum slippage of five points:

Fig. 13. Placing a BuyStopLimit order as a stop level for a short position
This time, the Stop Limit price field exceeds the Price one by five points and comprises 56 925.
1.8. Replacing Stop Loss Levels with Buy Stop Limit and Sell Stop Limit Orders in the Expert Advisor
Let's go back to our panel described in the section 1.5. We should modify it, so that it allows placing protective stops using Buy Stop Limit and Sell Stop Limit orders. To do this, let's add a new field called Stop-Loss. Now, our panel looks as follows:
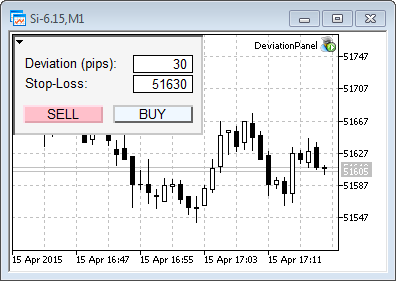
Fig. 14. Placing a stop loss level in the DevaitionPanel
There are two most significant changes in the code: the CDevPanel class now features a new method responsible for placing Buy Stop Limit and Sell Stop Limit orders. The OnObjClick method for opening a new position has been modified. The source code of the methods is as follows:
//+------------------------------------------------------------------+
//| End obj click                                                    |
//+------------------------------------------------------------------+
void CDevPanel::OnObjClick(string sparam)
  {
   if(sparam==m_buy_button_name)
     {
      if(Trade.BuyLimit(1,CalcCurrentPrice(OP_BUY)))
         SendStopLoss(OP_BUY);
     }
   if(sparam==m_sell_button_name)
     {
      if(Trade.SellLimit(1,CalcCurrentPrice(OP_SELL)))
         SendStopLoss(OP_SELL);
     }
   ObjectSetInteger(0,sparam,OBJPROP_STATE,false);
   Sleep(100);
   ChartRedraw();
  }
//+------------------------------------------------------------------+
//| Send SL order                                                    |
//+------------------------------------------------------------------+
bool CDevPanel::SendStopLoss(int op_type)
  {
   if(op_type==OP_BUY)
     {
      double bid=SymbolInfoDouble(Symbol(),SYMBOL_BID);
      if(m_sl_level>=0.0 && m_sl_level<bid)
        {
         MqlTradeRequest request={0};
         request.action = TRADE_ACTION_PENDING;
         request.symbol = Symbol();
         request.volume = 1.0;
         request.price=m_sl_level;
         request.stoplimit=m_sl_level -(m_deviation*Point());
         request.type=ORDER_TYPE_SELL_STOP_LIMIT;
         request.type_filling=ORDER_FILLING_RETURN;
         request.type_time=ORDER_TIME_DAY;
         MqlTradeResult result;
         bool res=OrderSend(request,result);
         if(!res)
            Print("Error set S/L. Reason: "+(string)GetLastError());
         return res;
        }
     }
   else if(op_type==OP_SELL)
     {
      double ask=SymbolInfoDouble(Symbol(),SYMBOL_ASK);
      if(m_sl_level>=0.0 && m_sl_level>ask)
        {
         MqlTradeRequest request={0};
         request.action = TRADE_ACTION_PENDING;
         request.symbol = Symbol();
         request.volume = 1.0;
         request.price=m_sl_level;
         request.stoplimit=m_sl_level+(m_deviation*Point());
         request.type=ORDER_TYPE_BUY_STOP_LIMIT;
         request.type_filling=ORDER_FILLING_RETURN;
         request.type_time=ORDER_TIME_DAY;
         MqlTradeResult result;
         bool res=OrderSend(request,result);
         if(!res)
            Print("Error set S/L. Reason: "+(string)GetLastError());
         return res;
        }
      if(CharToStr(StringGetChar(data,strlen-1))=='.')
         StringSetChar(data,strlen-1,'');
     }
   return false;
  }
Apart from these methods, the code of the panel class now includes initialization and a relevant field for entering a stop loss. Now, if we fill the Stop-Loss field before clicking BUY or SELL, a new market order is accompanied by a special protective Buy Stop Limit or Sell Stop Limit order (depending on a position direction).
Chapter 2. Market Liquidity Analysis
2.1 Slippage Calculation Prior to Entering the Market
A stock market is characterized by centralized trading. Thus, all limit buy/sell orders are available for observation from the Depth Of Market. If we go back to the definitions provided in the article "Principles of Exchange Pricing through the Example of Moscow Exchange's Derivatives Market", we can see that limit orders located in the Depth Of Market provide the market liquidity (the ability to buy and sell certain volumes near the Last deal price).
The larger the volume we want to sell or buy, the more orders from the Depth Of Market are triggered increasing the slippage, since we have to attract liquidity providers from more and more remote levels relative to the current price. You can find more about how slippage works in the article "Principles of Exchange Pricing" mentioned above. Let's consider the following short example to make the issue more clear.
At any specific time, we have the Depth Of Market describing buy/sell volumes. Currently, we are examining the Depth Of Market on Si-6.15 USD/RUB futures contract:
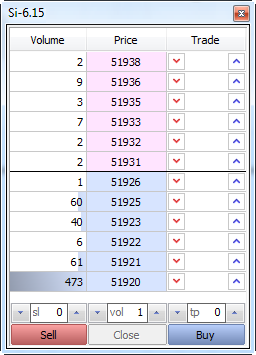
Fig. 15. The Depth Of Market on Si-6.15 futures contract
If we buy 2 contracts, we suffer no slippage as the deal is performed at the best Ask price: 51 931. But if we buy, say, 4 contracts, our average price will be different from 51 931 comprising: (2*51 931+2*51 932)/4 = 51 931.5. We buy two contracts at 51 931, and the remaining two – at 51 932. 51 931.5 is a weighted mean market entry price. The difference between it and the best Ask price forms our slippage value.
Now, we can arrange the table of liquidity defining the slippage value depending on our deal volume. At the volume of 1 or 2 contracts, our deal is executed at the best Ask price (51 931) with no slippage. In case of 4 contracts, the slippage is 0.5 points (51 931.5 - 51 931.0). The equation is simple: the best Ask or Bid price (depending on a deal direction) is subtracted from the weighted mean entry price.
The liquidity table is shown below:
| Volume | Price | Deal volume |
Weighted mean entry price |
Slippage |
|---|---|---|---|---|
| 2 | 51 938 | 25 | 51 934.5 | 3.5 |
| 9 | 51 936 | 23 | 51 934.2 | 3.2 |
| 3 | 51 935 | 14 | 51 933.0 | 2.0 |
| 7 | 51 933 | 11 | 51 932.5 | 1.5 |
| 2 | 51 932 | 4 | 51 931.5 | 0.5 |
| 2 | 51 931 | 2 | 51 931.0 | 0.0 |
Table 1. Calculating the weighted mean entry price and the appropriate slippage
This table should be examined from bottom to top, similar to the Depth Of Market's Ask price. As we can see, the deal volume of two contracts has no slippage. The deal volume of four contracts has the slippage of 0.5 points. The deal volume of 25 contracts has a slippage of 3.5 points and its weighted mean price is 51934.5.
The centralized market and the Depth Of Market allow us to make the following conclusion:
Knowing the state of the Depth Of Market, we can calculate a potential slippage before conducting a deal.
Thus, we are able to manage our risk. Regardless of whether we trade manually or use trading robots, we can define the market depth before entering it. In this instance, we can compare a trader to a diver. Before jumping into the water, the diver should know the depth of a pool. The larger the diver, the deeper the pool should be. Similarly, the larger the deal volume, the more liquid market we need. Of course, the Depth Of Market can change right before we enter the market. But even a slightly outdated calculation remains accurate enough to perform a deal.
2.2. Potential Slippage Calculation in Real Time
Now, it is time to put theory into practice. It is impossible to calculate the potential slippage value manually, since the Depth Of Market changes too quickly, while the calculation itself is rather cumbersome. Thus, we need to automate it. In order to facilitate the calculation, we implement a special class CMarketBook for working with the Depth Of Market. The development of such a class is a difficult task worthy of a separate article. There is no need to describe its operation principles here. Instead, we will use one of its methods: GetDeviationByVol. Let's see how it works:
//+------------------------------------------------------------------+
//| Get deviation value by volume. Retun -1.0 if deviation is        |
//| infinity (insufficient liquidity)                                |
//+------------------------------------------------------------------+
double CMarketBook::GetDeviationByVol(long vol,ENUM_MBOOK_SIDE side)
  {
   int best_ask = InfoGetInteger(MBOOK_BEST_ASK_INDEX);
   int last_ask = InfoGetInteger(MBOOK_LAST_ASK_INDEX);
   int best_bid = InfoGetInteger(MBOOK_BEST_BID_INDEX);
   int last_bid = InfoGetInteger(MBOOK_LAST_BID_INDEX);
   double avrg_price=0.0;
   long volume_exe=vol;
   if(side==MBOOK_ASK)
     {
      for(int i=best_ask; i>=last_ask; i--)
        {
         long currVol=MarketBook[i].volume<volume_exe ?
                      MarketBook[i].volume : volume_exe;
         avrg_price += currVol * MarketBook[i].price;
         volume_exe -= MarketBook[i].volume;
         if(volume_exe<=0)break;
        }
     }
   else
     {
      for(int i=best_bid; i<=last_bid; i++)
        {
         long currVol=MarketBook[i].volume<volume_exe ?
                      MarketBook[i].volume : volume_exe;
         avrg_price += currVol * MarketBook[i].price;
         volume_exe -= MarketBook[i].volume;
         if(volume_exe<=0)break;
        }
     }
   if(volume_exe>0)
      return -1.0;
   avrg_price/=(double)vol;
   double deviation=0.0;
   if(side==MBOOK_ASK)
      deviation=avrg_price-MarketBook[best_ask].price;
   else
      deviation=MarketBook[best_bid].price-avrg_price;
   return deviation;
  }
When the method is called, it refers to the Depth Of Market. It goes through the Depth Of Market beginning from the best price and calculates the volume available there. As soon as the available volume equals or exceeds the required one, the method stops searching and calculates a weighted mean price corresponding to a predetermined volume. The difference between the calculated weighted mean price and the best Bid or Ask one forms our potential slippage value.
If for some reasons, the Depth Of Market liquidity is insufficient for the specified volume, the method returns -1.0 indicating that the potential slippage cannot be calculated.
Now that we have the potential slippage calculation method, we need to visualize obtained results. Obviously, the slippage value correlates with the volume bought or sold on the market. The higher the volume, the greater the slippage. Thus, we need to add a new line and an input field to our panel called Volume:
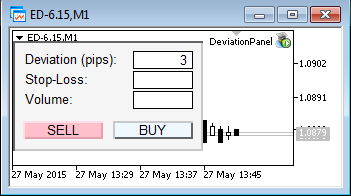
Fig. 16. The panel with the Volume field
Now, our panel is capable of buying and selling an arbitrary volume. For example, if we want to buy 5 contracts at the market price, we should simply enter 5 in the Volume field and click BUY. This is not the only innovation. As already mentioned, we can manage a slippage when entering a market thanks to the GetDeviationVol method.
For more visibility, let's display the calculated value directly on the BUY and SELL buttons. We will specify our slippage in points. This value will be calculated anew at each change in the Depth Of Market. While liquidity increases, the slippage value falls and vice versa. If we want to buy or sell only one contract, there will be no slippage at all, since the volume of 1 never exceeds the best Bid/Ask volume.
I recommend that you view the updated panel operation in real time. The video below shows the calculation of the potential slippage in real time for RTS-6.15 futures contract:
In the beginning, one contract is entered in the Volume field. As expected, the BUY and SELL buttons display 0. This means that our market entry will not cause slippage. After increasing the volume up to 100 contracts, the average slippage for buys and sells is increased up to 10-20 points. When the volume is increased up to 500 contracts, the average slippage becomes 60-80 points. Finally, after we set the volume to 1 500 contracts, we experience insufficient liquidity displayed by -1.0 value on the BUY button (slippage cannot be defined). The demand liquidity is still sufficient, although selling such a great amount of contracts will cause a slippage of 100-130 points.
The class for working with the Depth Of Market, as well as the final version of the DeviationPanel are available in the source codes attached below.
2.3. Using SpreadRecord Spread Indicator as a Market Entry Filter
Analyzing the current liquidity before entering the market is a useful and reasonable habit. A well-developed trading robot performing complex calculations for you can save you from a dangerous slippage. But this is not always enough.
Another issue a trader has to deal with is a reliable spread width determination. Spread is a difference between the best Ask and Bid prices. A spread is mostly a relative parameter since large-volume deals are mostly affected by the common Depth Of Market liquidity, rather than a spread width itself. However, a trader usually does not have access to the Depth Of Market history, therefore it is very difficult to assess the past liquidity of a trading contract. On the other hand, a spread is inversely correlated with a symbol's liquidity. The narrower the spread, the higher the liquidity, and vice versa.
With this feature in mind, we can develop a spread indicator to display past spread values. This indicator will be extremely useful in trading, since it allows us to visually evaluate past liquidity values and a symbol's spread width. Knowing the average spread value, we can limit our trading during a sharp liquidity change when a spread expands significantly.
So, let's create such an indicator. It will display its values as bars in the lower chart window. The average spread level is displayed as a green dot at the appropriate level of a bar. The indicator calculates the following spread values:
- spread value at the time the bar is opened;
- maximum spread level reached during the bar;
- minimum spread level reached during the bar;
- spread value at the time the bar is closed;
- average spread value during the bar.
The indicator does not save spread values and draws the spread from the very last bar after the terminal has been reset. The source code of the indicator is displayed below:
//+------------------------------------------------------------------+
//|                                                Spread Record.mq4 |
//|                        Copyright 2015, MetaQuotes Software Corp. |
//|                                              http://www.mql5.com |
//+------------------------------------------------------------------+
#property copyright "Copyright 2015, Vasiliy Sokolov."
#property link      "https://www.mql5.com/ru/users/c-4"
#property version   "1.00"
#property description "Recording spread and show it."
#property indicator_separate_window
#property indicator_buffers 5
#property indicator_plots   5
#property indicator_type1   DRAW_BARS
#property indicator_type2   DRAW_ARROW
#property indicator_color1   clrBlack
#property indicator_color2   clrBlack
double spread_open[];
double spread_high[];
double spread_low[];
double spread_close[];
double spread_avrg[];
int elements;
double avrg_current;
int count;
//+------------------------------------------------------------------+
//| Custom indicator initialization function                         |
//+------------------------------------------------------------------+
int OnInit()
  {
//--- indicator buffers mapping
   SetIndexBuffer(0,spread_open,INDICATOR_DATA);
   SetIndexBuffer(1,spread_high,INDICATOR_DATA);
   SetIndexBuffer(2,spread_low,INDICATOR_DATA);
   SetIndexBuffer(3,spread_close,INDICATOR_DATA);
   SetIndexBuffer(4,spread_avrg,INDICATOR_DATA);
   IndicatorSetInteger(INDICATOR_DIGITS,1);
   PlotIndexSetInteger(1,PLOT_ARROW,0x9f);
   PlotIndexSetInteger(0,PLOT_LINE_COLOR,clrRed);
   PlotIndexSetInteger(1,PLOT_LINE_COLOR,clrGreen);
//---
   return(INIT_SUCCEEDED);
  }
//+------------------------------------------------------------------+
//|                                                                  |
//+------------------------------------------------------------------+
void OnDeinit(const int reason)
  {
   printf("DEINIT");
  }
//+------------------------------------------------------------------+
//| Custom indicator iteration function                              |
//+------------------------------------------------------------------+
int OnCalculate(const int rates_total,
                const int prev_calculated,
                const datetime &time[],
                const double &open[],
                const double &high[],
                const double &low[],
                const double &close[],
                const long &tick_volume[],
                const long &volume[],
                const int &spread[])
  {
//---
   if(prev_calculated==0)
     {
      printf("INITIALIZE INDICATORS "+TimeToString(TimeCurrent()));
      double init_value=EMPTY_VALUE;
      ArrayInitialize(spread_high,init_value);
      ArrayInitialize(spread_low,init_value);
      ArrayInitialize(spread_open,init_value);
      ArrayInitialize(spread_close,init_value);
      ArrayInitialize(spread_avrg,init_value);
      elements=ArraySize(spread_high);
      InitNewBar(elements-1);
     }
//--- new bar initialization
   for(; elements<ArraySize(spread_high); elements++)
      InitNewBar(elements);
   double d=GetSpread();
   for(int i=rates_total-1; i<rates_total; i++)
     {
      if(d>spread_high[i])
         spread_high[i]=d;
      if(d<spread_low[i])
         spread_low[i]= d;
      spread_close[i] = d;
      avrg_current+=d;
      count++;
      spread_avrg[i]=avrg_current/count;
     }
//--- return value of prev_calculated for next call
   return(rates_total-1);
  }
//+------------------------------------------------------------------+
//|                                                                  |
//+------------------------------------------------------------------+
double GetSpread()
  {
   double ask = SymbolInfoDouble(Symbol(), SYMBOL_ASK);
   double bid = SymbolInfoDouble(Symbol(), SYMBOL_BID);
   return NormalizeDouble((ask-bid)/Point(), 0);
  }
//+------------------------------------------------------------------+
//| Init new bar                                                     |
//+------------------------------------------------------------------+
void InitNewBar(int index)
  {
   spread_open[index] = GetSpread();
   spread_high[index] = 0.0;
   spread_low[index]=DBL_MAX;
   avrg_current=0.0;
   count=0;
  }
Let's try to run this indicator on the Si-6.15 minute chart. Shortly after the start, it shows the following results:
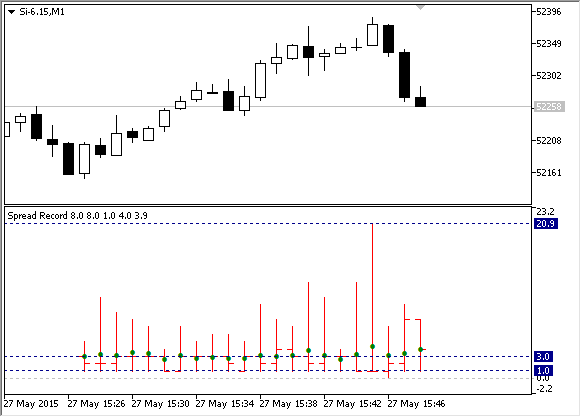
Fig. 17. SpreadRecord indicator launched on the Si-6.15 minute chart
We can see that the spread for Si-6.15 oscillated between 1 and 21 points during the analyzed period. At each minute, there was at least one moment when the spread corresponded to the minimum value of 1 point. The average value comprised 3 points. As mentioned above, it is shown as a green dot in the indicator window.
2.4. Manual and Automatic Trading Limitation During Strong Spread Expansions
Now, we need to learn how to use the indicator to manage our risks. The simplest thing we can do is to limit our trading activity when the current indicator values are too high. On the selected time period, the indicator values were mostly within the range of 1-9 points. This area can be called "green." The trading is enabled there. If the spread rises above 9 points, we move into the red zone where the trading is disabled. This can be shown the following way:
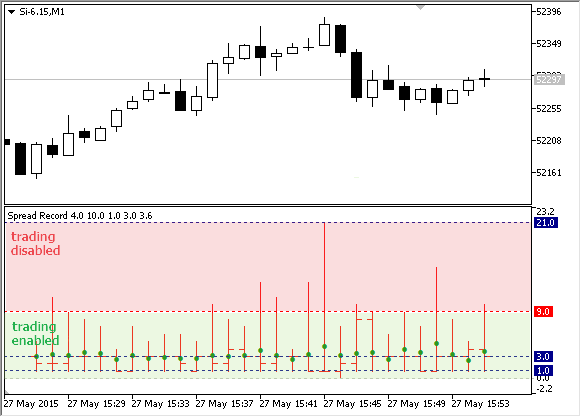
Fig. 18. Enabled and disabled trading zones defined by the indicator
In addition to the manual trade limitation, we also need to teach our Expert Advisor to accept the indicator values and limit its trading actions when the current spread exceeds specified limits. You can do this by calling the indicator from the EA using the iCustom function. This function allows you to call any user indicators directly from the EA obtaining their values. Below is the EA template managing the spread using the indicator:
//+------------------------------------------------------------------+
//|                                          SpreadRecordControl.mq5 |
//|                        Copyright 2015, MetaQuotes Software Corp. |
//|                                              http://www.mql5.com |
//+------------------------------------------------------------------+
#property copyright "Copyright 2015, MetaQuotes Software Corp."
#property link      "http://www.mql5.com"
#property version   "1.00"
#define OPEN  0
#define HIGH  1
#define LOW   2
#define CLOSE 3
#define AVRG  4

input int MaxSpread=9;

int h_spread_record=INVALID_HANDLE;       // Handle of SpreadRecord indicator
bool print_disable = false;
//+------------------------------------------------------------------+
//| Expert initialization function                                   |
//+------------------------------------------------------------------+
int OnInit()
  {
   h_spread_record=iCustom(Symbol(),Period(),"Spread Record");
   return(INIT_SUCCEEDED);
  }
//+------------------------------------------------------------------+
//| Expert deinit function                                           |
//+------------------------------------------------------------------+
void OnDeinit(const int reason)
  {
   IndicatorRelease(h_spread_record);
  }
//+------------------------------------------------------------------+
//| Expert tick function                                             |
//+------------------------------------------------------------------+
void OnTick()
  {
   if(IsTradeDisable(MaxSpread))return;
   //
   // TRADE LOGIC...
   //
  }
//+------------------------------------------------------------------+
//| Return true if trade disable, otherwise return false             |
//+------------------------------------------------------------------+
bool IsTradeDisable(int max_spread)
  {
   if(h_spread_record==INVALID_HANDLE)
      return false;
   double close[];
   if(CopyBuffer(h_spread_record, CLOSE, 0, 1, close) < 1)return false;
   if(close[0]>MaxSpread)
     {
      if(!print_disable)
         printf("trade disable");
      print_disable=true;
      return true;
     }
   if(print_disable)
      printf("trade enable");
   print_disable=false;
   return false;
  }
The IsTradeDisable function is mostly responsible for defining whether the trading is enabled or not. It returns true if the spread is too high and trading should be disabled. If the spread is normal, the function returns false. The function is based on calling the SpreadRecord indicator by copying its current value using the CopyBuffer function. The EA features the MaxSpread parameter equal to the threshold value. If the value is exceeded, the EA blocks its trading activity. If the spread falls below the specified border again, the EA resumes its work. The IsTradeDisable function indicates transition from one state to another by the corresponding message: "trade enable" and "trade disable":
2015.05.27 16:57:08.238 SpreadRecordControl (Si-6.15,H1)        trade enable
2015.05.27 16:57:08.218 SpreadRecordControl (Si-6.15,H1)        trade disable
2015.05.27 16:56:49.411 SpreadRecordControl (Si-6.15,H1)        trade enable
2015.05.27 16:56:49.401 SpreadRecordControl (Si-6.15,H1)        trade disable
2015.05.27 16:56:36.478 SpreadRecordControl (Si-6.15,H1)        trade enable
2015.05.27 16:56:36.452 SpreadRecordControl (Si-6.15,H1)        trade disable
You can use this prototype EA for your trading systems, thus avoiding entering the market during the low liquidity and large slippage.
The Expert Advisor and SpreadRecord indicator source codes are attached below.
Chapter 3. Secure Trading and Expert Advisor Testing Modes
3.1. Using "Sleep Mode" as as Alternative to Tick-by-Tick Control
As mentioned in the section 1.1 "Discrete Nature of a Price Flow. Price Gaps", market quotes can be compared to a continuous stream of prices. Thus, if a stock price changes from $10 to $15, it means that there were moments when the price comprised 11, 12, 13 and 14 dollars respectively. However, we have already found out that this is not always the case.
The prices often move sharply, while our trading methods are commonly based on the assumption that the quotes change gradually and consistently. When we set a stop loss, we assume that our position will be closed at a stop loss level before suffering a devastating loss. However, the basis of any stop order is a consent to buy or sell at any available price if it exceeds a certain level. In case of discrete prices, such a stop order becomes a potential loss maker. If the current price is several times worse than the one specified in our stop order, a stop loss is executed nevertheless leaving us with a much higher loss.
On the other hand, if an Expert Advisor checks the market situation at every incoming tick, it also risks closing a position at a very unfavorable price: in case of a low liquidity, the last trade generating a tick may be executed in parts reaching the most incredible prices along its way and causing a price spike.
Therefore, instead of tracking every market tick, it is more reasonable to somewhat "desensitize" a strategy, so that an EA's trading logic is called once per a certain time period (e.g., once per minute) and not per each tick. Using stop orders is out of question as well. Instead, it would be more wise to use algorithmic (virtual) stops with their activation conditions checked once per a certain time period.
It may seem that such trading logic desensitization will significantly distort trading results, but that is not the case. Of course, the price may move a long way from a potential market exit or entry price within a minute, but there will also be more favorable conditions when deals are performed away from the price reversal points.
Let's consider the actual market case observed on Si-6.15 RUB/USD futures contract on May 28. A considerable price spike occurred at 10:03 (Moscow time). Suppose that we had a long position at 53 040 with the stop loss of 52 740 (300 points) by that time. In this case, our stop loss would have been triggered at the much lower price than the one specified in the stop level.
As practice shows, stop levels are usually triggered at the prices close to the worst ones during price spikes. In this case, it would have been 52 493 bringing us a loss of 53 040 - 52 493 = 547 rubles per contract (instead of 300 rubles specified by our stop level). The case is displayed in chart A below. If we have checked our stop loss once per minute, the price spike would have been ignored by our strategy, the stop loss would not have been triggered and finally, we would have ended our trade in profit (chart B):

Fig. 19. The strategy behaves differently depending on whether a real or a virtual stop order is used
The price spike shown here is relatively small. But sometimes, it may even reach a price limit of a futures contract. Price limits are usually located at a distance of 5% of the current price. Thus, if we use the leverage of 1:1, we risk losing 5% of our deposit during a stop level execution. If we use the leverage of 1:10, the losses will comprise 50% of our deposit!
3.2. The Sample Expert Advisor Based on Moving Averages and Checking Its Trading Logic Once Per Period
The Sample Expert Advisor operating on two Moving Averages' crossing is a good example of how you can make an EA to check the market conditions once per period. The last value of a Moving Average (MA) is constantly changing following the ever-changing last bar's Close price.
The classic strategy for the two MAs is well known to many traders. The EA buys when a fast MA crosses up a slow one and sells when a fast MA crosses down a slow one. The following image depicts long and short market entry signals for the strategy:

Fig. 20. Long and short market entry signals for the MovingAverage strategy
As already mentioned, the last bar's MAs are constantly changing. In this case, a fast MA may cross a slow one several times within a single bar making an EA to perform multiple reversals, while the price stands almost still. We also know already that it is reasonable not to check the market conditions at each newly arrived tick in the futures markets. Thus, we should make the EA to check trading conditions once per minute. In that case, the EA checks the previous (already complete) bar rather than the current one, so that the MA's re-drawing at the last bar does not affect the EA's behavior.
The code of the MovingAverage EA is shown below:
//+------------------------------------------------------------------+
//|                                                MovingAverage.mq5 |
//|                                 Copyright 2015, Vasiliy Sokolov. |
//|                                              http://www.mql5.com |
//+------------------------------------------------------------------+
#property copyright "Copyright 2015, Vasiliy Sokolov."
#property link      "http://www.mql5.com"
#property version   "1.00"
#include <Trade\Trade.mqh>

input int FastMAPeriod = 10;     // Fast MA period
input int SlowMAPeriod = 20;     // Slow MA period
input double Volume = 1.0;       // Volume for Trade
int FastMA = INVALID_HANDLE;     // Handle of fast MA indicator.
int SlowMA = INVALID_HANDLE;     // Handle of slow MA indicator.
datetime TimeLastBar;
CTrade Trade;
//+------------------------------------------------------------------+
//| Expert initialization function                                   |
//+------------------------------------------------------------------+
int OnInit()
  {
   FastMA = iMA(Symbol(), Period(), FastMAPeriod, MODE_SMA, 1, PRICE_CLOSE);
   SlowMA = iMA(Symbol(), Period(), SlowMAPeriod, MODE_SMA, 1, PRICE_CLOSE);
   if(FastMA==POINTER_INVALID || SlowMA==POINTER_INVALID)
     {
      printf("handle of indicator has not been created");
      return(INIT_FAILED);
     }
   return(INIT_SUCCEEDED);
  }
//+------------------------------------------------------------------+
//| Expert deinitialization function                                 |
//+------------------------------------------------------------------+
void OnDeinit(const int reason)
  {
   IndicatorRelease(FastMA);
   IndicatorRelease(SlowMA);
  }
//+------------------------------------------------------------------+
//| Expert tick function                                             |
//+------------------------------------------------------------------+
void OnTick()
  {
   if(!NewBarDetect())return;
   if(CrossOver())
      Trade.Buy(GetVolume());
   else if(CrossUnder())
      Trade.Sell(GetVolume());
  }
//+------------------------------------------------------------------+
//| Return true if fast ma cross slow ma over. Otherwise return      |
//| false.                                                           |
//+------------------------------------------------------------------+
bool CrossOver()
  {
   double fast_ma[];
   double slow_ma[];
   if(CopyBuffer(FastMA, 0, 1, 2, fast_ma) < 1)return false;
   if(CopyBuffer(SlowMA, 0, 1, 2, slow_ma) < 1)return false;
   bool is_over=fast_ma[1]>slow_ma[1] && fast_ma[0]<slow_ma[0];
   return is_over;
  }
//+------------------------------------------------------------------+
//| Return true if fast ma cross slow ma under. Otherwise return     |
//| false.                                                           |
//+------------------------------------------------------------------+
bool CrossUnder()
  {
   double fast_ma[];
   double slow_ma[];
   if(CopyBuffer(FastMA, 0, 1, 2, fast_ma) < 1)return false;
   if(CopyBuffer(SlowMA, 0, 1, 2, slow_ma) < 1)return false;
   bool is_under=fast_ma[0]>slow_ma[0] && fast_ma[1]<slow_ma[1];
   return is_under;
  }
//+------------------------------------------------------------------+
//| Return count volume for trade/                                   |
//+------------------------------------------------------------------+
double GetVolume()
  {
   if(PositionSelect(Symbol()))return Volume*2.0;
   return Volume;
  }
//+------------------------------------------------------------------+
//| Return true if new bar detect, otherwise return false.           |
//+------------------------------------------------------------------+
bool NewBarDetect()
  {
   datetime times[];
   if(CopyTime(Symbol(),Period(),0,1,times)<1)
      return false;
   if(times[0] == TimeLastBar)return false;
   TimeLastBar = times[0];
   return true;
  }
//+------------------------------------------------------------------+
The main EA's feature is the condition for checking the new bar's arrival:
void OnTick()
{
   if(!NewBarDetect())return;
   ...
}
The current EA version has no stop loss. However, if it has been used, a check for exiting a position by stop loss would still be located after the new bar arrival check function, so that a stop loss can only be triggered after a new bar appears.
This allows us to analyze the market conditions only when a new bar opens, thus avoiding potential price spikes. Of course, a price spike may occur right at the new bar arrival but that is hundreds of times less likely as compared to checking the market conditions at each tick.
3.3. Using Complete Bar Mode as an Alternative to Tick-by-Tick Testing of Expert Advisors
Finally, let's consider one of the most interesting EA and indicator testing modes available in the MetaTrader 5 strategy tester. This mode is called "Open prices only". Launch the strategy tester (View --> Strategy Tester) and select it in the Execution section of the tester window.

Fig. 21. Selecting the "Open prices only" mode
Traders often underestimate this mode thinking it to be too inaccurate. Besides, only a handful of EAs can use this mode efficiently. However, few people know that this is, in fact, the most precise and quick testing mode, especially when compared to the "Every tick" one.
High accuracy is achieved by using only Open prices. All new bar's prices become available only when it is complete, thus turning into a previous bar in the quote history.
In contrast, the "Every tick" mode forms each bar in a special way gaining data from the least timeframe available and using its tick generator. Since MetaTrader 5 does not store the tick history, the generator cannot simulate price gaps inside a minute bar. Therefore, it is possible to develop a "Grail" which shows outstanding results in the tester but fails on the real market.
The tick-by-tick testing mode is the greatest threat to strategies based on level breakthroughs. Moreover, pending orders can distort actual results as well. Let's consider a strategy that places a Buy Stop pending order and waits for a strong upward movement. At 19:00, May 25, 2015 (right after the evening clearing), the SBRF-6.15 futures contract moved from 7 473 up to 7 530 rubles within a minute. If we had had a pending orders at 7 485, it would have been triggered at its specified price in the strategy tester bringing profit after its closure a few bars later:
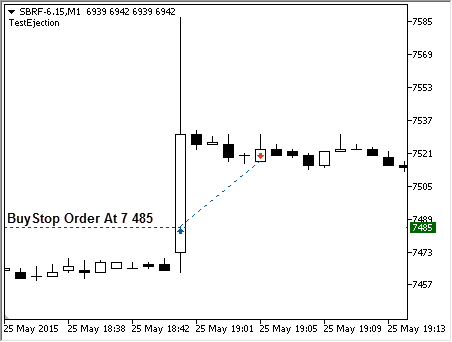
Fig. 22. Pending order activation
However, the reality may differ greatly. We know nothing about the prices inside that minute bar. In other words, the order may be executed at a much worse price. The video below shows how the order is executed in "Every tick" mode:
As we can see, the strategy tester had no problems while processing the price we set. But let's look at the tick chart of the minute candle:
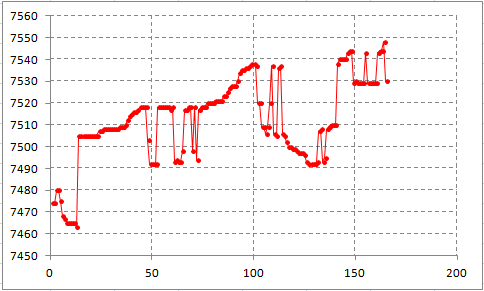
Fig. 23. Tick chart of the minute candle
The price has experienced quite dramatic changes within that minute. The tick chart features large price gaps and sharp movements. Thus, our stop order would have hardly been executed at the desired price in real market conditions. The actual execution price would most probably have been within the range 7 510 - 7 520.
Analyzing each tick and using market prices instead of pending orders would have changed nothing. Since the strategy tester's tick generator generates ticks sequentially, our order would have been triggered as soon as the Ask price had touched our specified level. In reality, it would have been impossible to fulfill our order at the specified prices.
Therefore, use the "Every tick" mode with caution. You should be aware of whether your strategy is especially sensitive to price spikes.
The complete bar testing mode is much more secure. We should not use pending orders in this mode to ensure high accuracy. If our strategy had required the market entry at 7 495, it would have had to check every bar's Open price and wait till the necessary level is exceeded to buy at the current price when a bar is opened. In the complete bar mode, we would have found out that the price is above the desired level only when a new bar opened at 19:01, since the bar's Open price at 19:00 was still below 7 495 rubles. Thus, our trade would have looked as follows in the complete bar mode:
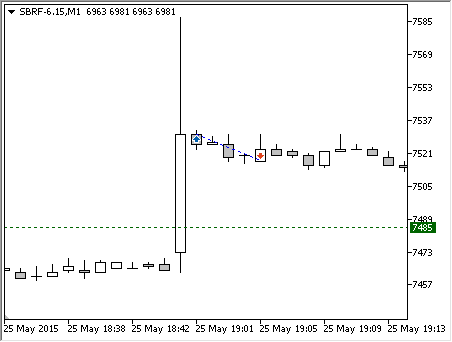
Fig. 24. Actual trade in the complete bar mode
Although the final result would have still been negative, it has a huge advantage:
Testing on complete bars ensures that all trades are performed at actual prices. Thus, this mode can be used for testing strategies on low-liquidity markets.
If your strategy works on a timeframe higher than M1 and it cannot afford to check trading conditions once per period, try the "1 minute OHLC" testing mode. In this mode, each bar is generated only based on the M1 chart prices. Since all M1 chart prices are historical, this mode also has an absolute accuracy and can be recommended as a reasonable testing mode for medium-term strategies.
I do not recommend applying the "Every tick" mode when testing strategies for low-liquidity markets. Also, such strategies should not use Stop orders in their activity.
You may argue that the market entry accuracy is of critical importance for trading systems, and even a few points may significantly impact the final results. However, if we resort to the law of large numbers, we will see that the difference between a calculated and an actual market entry is a mere noise component. In most cases, the market entry is performed at the prices much worse than the calculated ones, though sometimes, the price extremum breaks through the calculated level just to turn back within the same bar.
If we had used the "Every tick" mode, we would have been in a loss during such moments. But if we had used complete bars, we would have not entered the market in such conditions. In other words, the market entry at worse prices would have been compensated by other (positive) effects. In general, the difference would have been completely eliminated, and the result would have been completely dependent on the idea implemented into a strategy rather than on a momentary entry level.
Conclusion
Now, it is time to summarize the main ideas:
-
The market price has a discrete nature. It consists of multiple deals forming the market charts hiding that discrete nature. While analyzing a price bar, we cannot reliably determine what prices occurred till its completion. In the first approximation, it is assumed that the liquidity of bars is endless, and a range of each bar is filled with prices evenly, so that each price level reflects an actual deal.
-
On low-liquidity markets, discretization of market prices can be very high. So, it is recommended to use limit orders for market entries and exits. Limit orders allow us to overcome the discrete nature of market prices and avoid excessive slippage.
-
MetaTrader 5 features special Buy Stop Limit and Sell Stop Limit orders that can replace standard Stop Loss levels. Stop Limit orders are safe and can be used to manage maximum slippage even when the terminal is not running.
-
In addition to their discrete nature, market prices have a certain liquidity that sometimes should be taken into account. The current liquidity affects a slippage value. Knowing the state of the Depth Of Market, we can calculate a potential slippage.
-
Managing the current spread is a simpler way to assess the potential liquidity without the use of the Depth Of Market. A spread level usually depends on a symbol liquidity. If a spread is too high, it is more reasonable to wait for a better time to perform a deal.
-
"Sleep" mode is a reliable protection against price spikes for your EAs. In this mode, the EA's trading logic is checked only one time when a new bar arrives. Besides, EAs developed in this mode are compatible for tests in the complete bar mode.
-
The complete bar mode is the most accurate testing mode since it applies discrete and actual historical prices in its work. Besides, the mode has a high testing speed. Complete bar and "1 minute OHLC" are the only testing modes that are reasonable enough to be used on low-liquidity markets.
Translated from Russian by MetaQuotes Ltd.
Original article: https://www.mql5.com/ru/articles/1683
- Free trading apps
- Over 8,000 signals for copying
- Economic news for exploring financial markets
You agree to website policy and terms of use
Congratulations for this article.
This is gold.
It happen on me , all exchange are same , even worst case secenario was u broke also the broker might demand u to pay debt.
All your trade 100% loss + debt = bankrupt