
Category Theory in MQL5 (Part 23): A different look at the Double Exponential Moving Average
Introduction
Category Theory implementation in MQL5 off-the-bat seems like a daunting endeavor. It is a subject for which there is not a lot of easy-reading or self-help material available. There are a lot of books out there but they are meant and often structured for Masters or PHD students in academic settings. So, the attempt to make this topic more accessible is not going to be a breeze particularly because the reciting of the academic arguments and theory is not the objective but rather the interpretation and application of its precepts to traders is. To this end, we are extending our theme of looking at simple-everyday indicators differently.
The purpose of this article is to highlight the concept of horizontal composition of natural transformations. We have considered its antonym in the last article, where we saw how we can retrieve three functors between two categories, which implies two natural transformations in a vertical composition can be inferred when the categories are of data sets as simple as a price time series and a moving average time series of the same prices. For this piece we extend the moving average time series horizontally by adding a third category of moving averages of moving averages better known as the double exponential moving average. Our variant of this well-known indicator does not literally use the established formula but rather for our purposes it will simply smooth the moving average by just being a moving average of a moving average. The functor relationships are similar to what we had in the last article however were we have only two functors between categories as opposed to the three we had in the last. However, like in the last article, each functor between any two categories will have its own moving average period such that the natural transformation between each functor pair can help us form a time series buffer for analysis.
The significance of forecasting volatility in trading is perhaps not as crucial or critical as determining the type of position one should have in the first place (whether long or short). Nonetheless it does present us with an opportunity to examine any potential uses and improvements to other existing entry signal strategies or even the creation of new ones that utilize its ideas. This is something we have considered a lot in past articles and so a re-run here is not alien. We will look to pair our volatility forecasting which will be handled in an instance of an expert trailing class, with the in-built awesome oscillator signal class. Readers as always are welcome to test this class with other signals or their own private strategies to find out what jells best for them; for this article’s part we will stick to the awesome oscillator.
Background
To briefly recap category theory concepts, we’ve covered that are key to where we are, we’ve looked at orders as categories, functors, morphisms as functors in special situations, and finally the naturality square which proves existence of natural transformations. There were other earlier concepts we looked at in leading up to these, but this list should cover the basis of what we are unpacking for this article.
Understanding what is meant by ‘horizontal’ composition of natural transformations in this article is crucial because we are not simply referring to diagrammatic representation of the natural transformations when in 2-dimensions. Consider this diagram below:
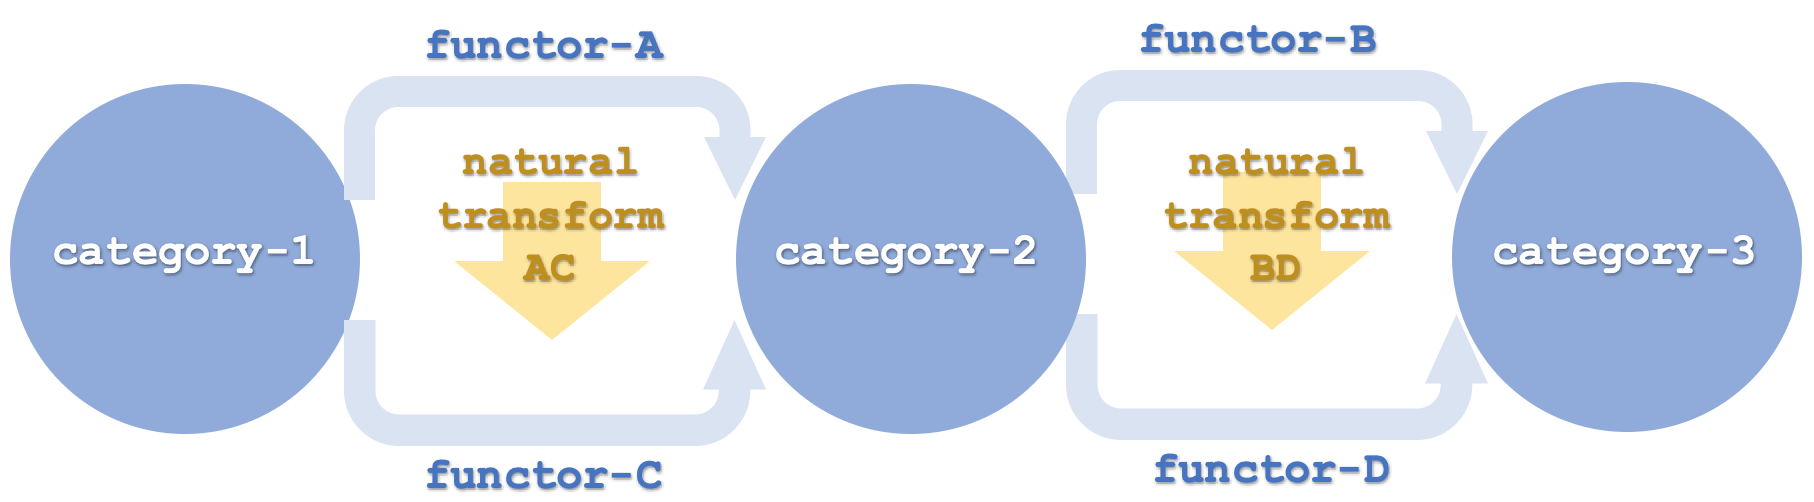
Horizontality here is used to mean the functors are arranged in a chain such that different pairs (or sets) link to different domain and codomain categories, such as shown above where the first two functors A and C link category-1 and category-2, while functors B and D link category-2 and category-3. This is in contrast to what we had in the last article where all functors were linking the same pair of categories. So, to be clear even if in the last article the two categories were drawn vertically meaning the natural transformations were running across (horizontally) that would still be a vertical composition. In the same way here even if the categories are drawn in a vertical sequence meaning the natural transformations appear to be in a ‘vertical’ order, it would still be deemed a horizontal composition.
So, our categories under consideration are a price time series, a moving average time series and a double exponential moving average time series. The use of double exponential time series could create some confusion when comparison is made between this category and the price time series category. Effectively the 3rd category is a double exponential moving average on category-1. If we had simply taken the functors B and D to be a double exponential moving average on the objects of category-2 then the result would have not been very useful to us. I mean what is a DEMA of an MA? So, these functors by coding appear to be mapping from category-1, the original price series however this should simply be taken as a moving average map from category-2 which is what it effectively is. The reader can modify this and perform his own tests accordingly as the full source code is attached at the end of this article, but this distinction is important to keep in mind.
Categories and Functors
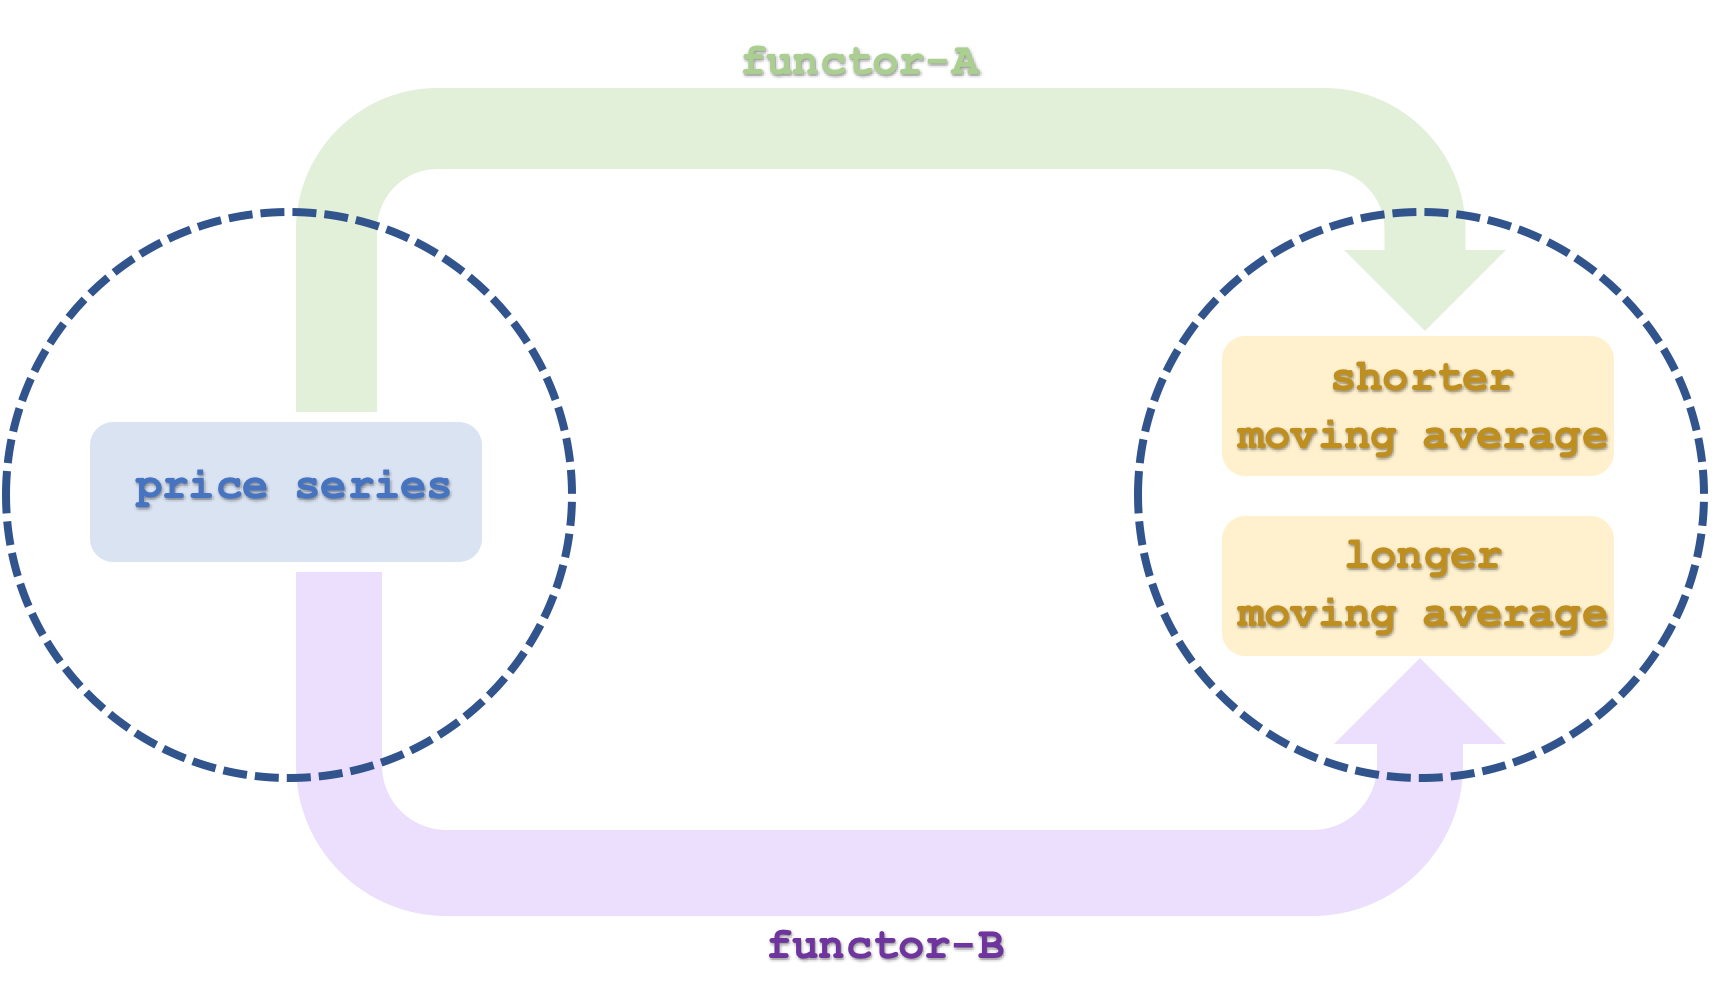
So our first category, category-1 has the price time series. We did examine in this earlier article how an order can be construed as a category so readers may want to refer to it. Our time series here is much similar to a linear order as indicated in an earlier article here. The objects within this category would be the price and time values at each interval meaning each object would have at least two elements; a price and a datetime value. The morphisms for the category would be defined by the time interval of the series and they simply chain the price values in ascending order to time. The security whose time series we will examine in this article will be EURUSD.
The moving averages of prices will be our category-2 and much like the first category it is a time series that can also be viewed as a linear order and therefore a category. It will primarily feature two objects though with each being a time series. The first will be mapped to by functor A and will represent the moving average of the price series at a period defined by functor A. This model will essentially have 2 moving average periods, and that used by functor A will be the shorter of the two. The second functor labelled C will also map from the price time series to category-2 and it will have a longer moving average period than functor A. Each of our objects in category-2 is a time series.
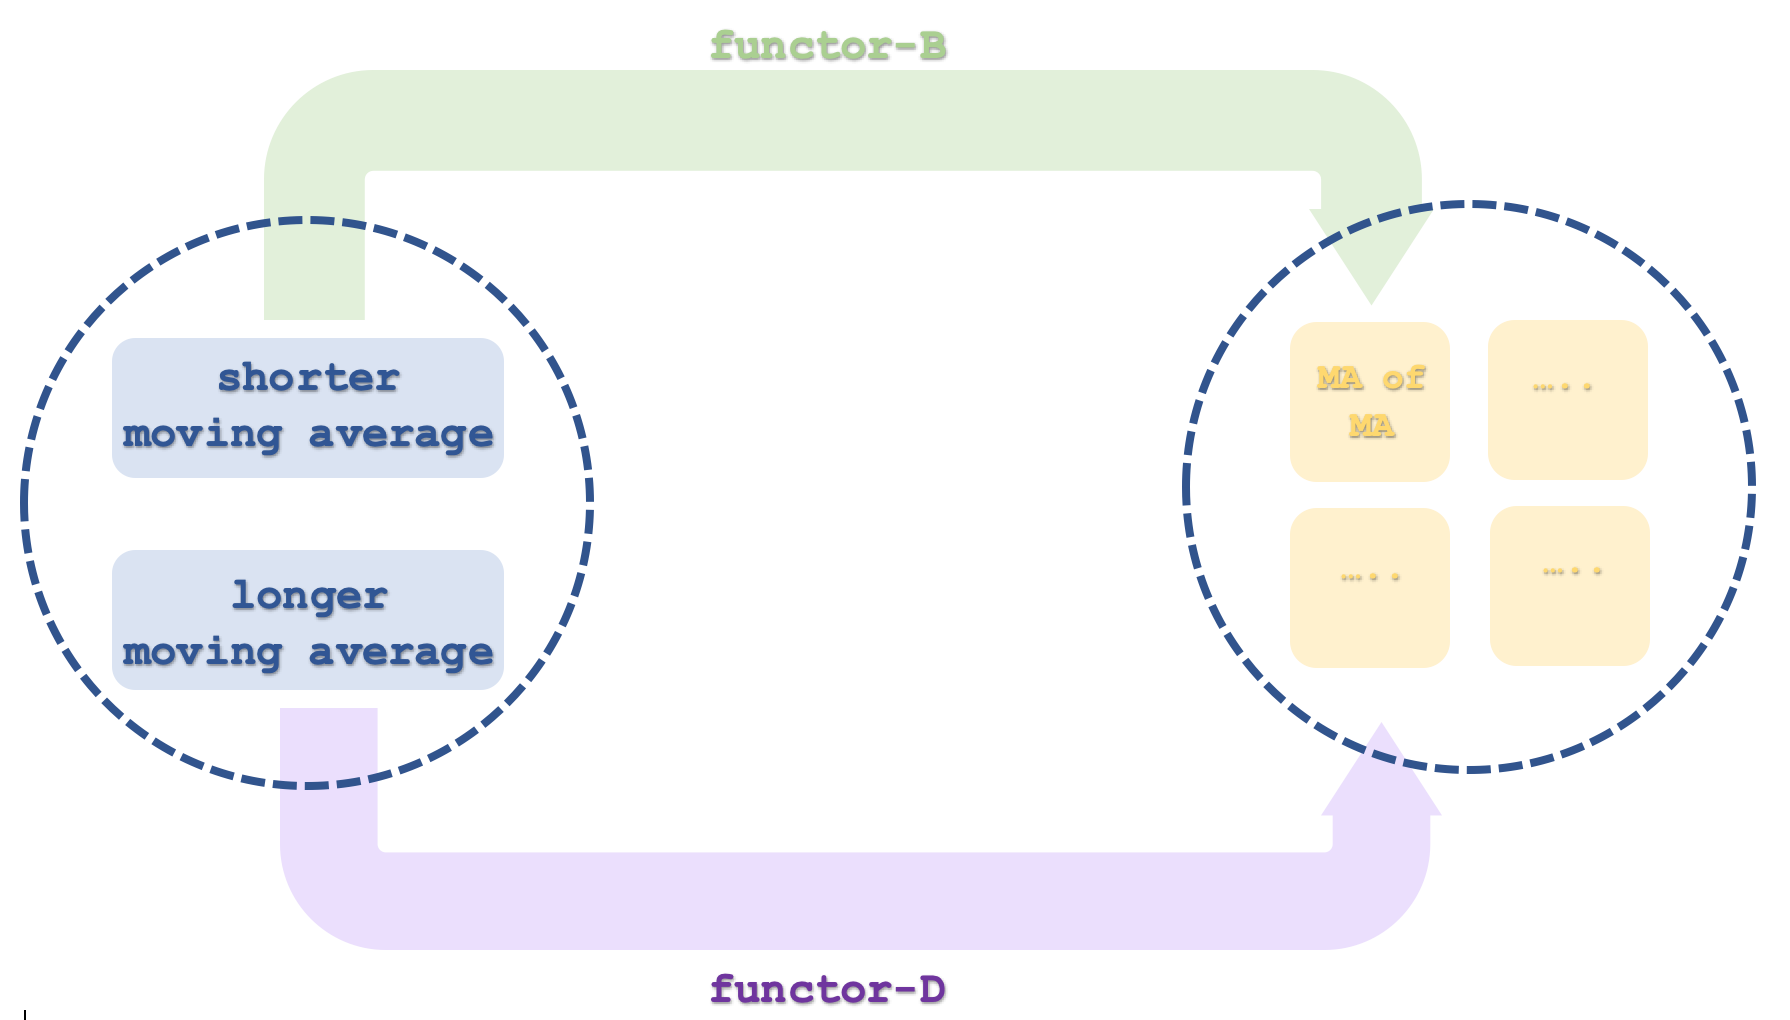
The third and final category, category-3, will have four objects that are time series, although we will only consider 2. Each pair of objects (4 objects is 2 pairs) will be mapped to by a single functor that computes the moving average of the moving average to come up with the double exponential moving average (DEMA). As clarified above the DEMA from code appears to map to category-1 the price series, but this is done only to ease calculations and not have to come up with a custom indicator. Since it’s a moving average of a moving average it can be taken as mapping from category-2. Now category-2 has two time series of moving averages, which can be taken as a fast and a slow-moving average. This though means that our category-3 will have 4 objects since the two functors from category-2 each map to the two objects thus linking to a particular object or time series.
Functors and Natural Transformations
The total natural transformations from these two functor pairs could be 6 but since we are only going to use 2 of the 4 objects in category-3, then that number will be 2. To recap a natural transformation is the difference between the two codomain objects of the functors. This we therefore easily capture by subtracting the two moving average objects. As we had in the last article each natural transformation will be captured as a time series buffer and the correlation of these buffers will help inform our decisions on adjusting the trailing stop(s) on open positions. However, in the last article this correlation between these natural transformation buffers was serving as a white noise filter, for this article since we are only concerned with trailing stop adjustment it will again serve as a filter if adjustments to the stop loss in the direction of the moving average trends, should be applied. So, a negative trend with a positive correlation between these buffers would be a green light to lower the stop loss on a short position. Similarly, a positive trend with sufficient correlation (our threshold is anything above zero) would indicate moving up the stop loss to long positions if they are any present. There is therefore bound to be a lot of times when we have ‘no signal’ due to negative correlations or because the type of position that is opened is not compatible to the signal generated since our stop movement decisions are position specific. This model therefore as we saw in the last article could be reconstituted as an instance of the expert signal class and assembled in an expert advisor via the wizard, where its signals can be more tested to evaluate its performance and results.
Forecasting Volatility
Forecasting volatility therefore is what our instance of the expert trailing class is doing as has been the case in a few articles in these series. We are doing this here with a filter; the moving average trends need to be confirmed by a substantial correlation between the natural transformation buffers. But another approach we could have taken that horns more towards volatility would have been to have categorty-1 as a series of price ranges (highs minus lows). This series would then have its averages in category-2, and category-3 would be its DEMA as we are doing with close prices in the attached code. The process is pretty much the same but this approach could yield results that are more attuned and sensitive to volatility.
Practical Implementation in MQL5
To set up the MQL5 environment for this model will be quite similar to what we have looked at in the series. Once again, the instance of the expert trailing class is assembled as part of an expert advisor in the MQL5 wizard and for it to work or be tested we need to have an instance of the expert signal class selected first within the wizard. For this article the inbuilt awesome oscillator signal class was used. ‘Inbuilt’ here means what is existing already in the library of signals provided in the IDE.
Writing code for the functors is something we do not necessarily have to do here because we can use the inbuilt instances of moving average classes. The classes ‘CiMA’ and ‘CiDEMA’ can easily handle our moving average and double exponential moving average needs. Nonetheless we do declare and use instances of the ‘CObjects’ class to handle these averages and their declaration is as below:
...

   CObjects<double>        m_o_average_a;
   CObjects<double>        m_o_average_b;
   CObjects<double>        m_o_average_c;
   CObjects<double>        m_o_average_d;
...
We would need, as in our last article, to initialize the natural transformation buffers since the ability to read off signals is important right from the start. Their size as before is an input parameter, ‘m_transformations’ as was the case in the last article so this important step would be handled in a manner almost identical to what we implemented in the last article with the main difference being we have 4 moving average instances to use for the buffers. Refreshing these values which is also a bit similar to the initialization is handled as per the listing below:
//+------------------------------------------------------------------+
//| Refresh function from Natural Transformations.                   |
//+------------------------------------------------------------------+
void CTrailingCT::Refresh(void)
   {
      if(!m_init)
      {
         Init();
      }
      else
      {
         m_close.Refresh(-1);

         int _x=StartIndex();

         for(int i=m_functor_ab+m_functor_ab-1;i>0;i--)
         {
            m_e_price.Let();m_e_price.Cardinality(1);m_o_prices.Get(i,m_e_price);m_o_prices.Set(i-1,m_e_price);
         }

         double _p=m_close.GetData(_x);
         m_e_price.Let();m_e_price.Cardinality(1);m_e_price.Set(0,_p);m_o_prices.Set(0,m_e_price);

         for(int i=0;i<m_transformations+1;i++)
         {
            double _a=0.0;
            for(int ii=i;ii<m_functor_ab+i;ii++)
            {
               _a+=m_close.GetData(_x+ii);
            }
            _a/=m_functor_ab;
            m_e_price.Let();m_e_price.Cardinality(1);m_e_price.Set(0,_a);m_o_average_a.Set(i,m_e_price);
            //
            double _b=0.0;
            for(int ii=i;ii<m_functor_cd+i;ii++)
            {
               m_e_price.Let();m_e_price.Cardinality(1);m_o_average_a.Get(i,m_e_price);
               double _b_i=0.0;m_e_price.Set(0,_b_i);
               _b+=_b_i;
            }
            _b/=m_functor_cd;
            m_e_price.Let();m_e_price.Cardinality(1);m_e_price.Set(0,_b);m_o_average_b.Set(i,m_e_price);
            //
            double _c=0.0;
            for(int ii=i;ii<m_functor_ab+i;ii++)
            {
               _c+=m_close.GetData(_x+ii);
            }
            _c/=m_functor_ab;
            m_e_price.Let();m_e_price.Cardinality(1);m_e_price.Set(0,_c);m_o_average_c.Set(i,m_e_price);
            //
            double _d=0.0;
            for(int ii=i;ii<m_functor_cd+i;ii++)
            {
               m_e_price.Let();m_e_price.Cardinality(1);m_o_average_c.Get(i,m_e_price);
               double _d_i=0.0;m_e_price.Set(0,_d_i);
               _d+=_d_i;
            }
            _d/=m_functor_cd;
            m_e_price.Let();m_e_price.Cardinality(1);m_e_price.Set(0,_d);m_o_average_d.Set(i,m_e_price);
         }


         for(int i=m_transformations-1;i>0;i--)
         {
            m_natural_transformations_ac[i]=m_natural_transformations_ac[i-1];
            m_natural_transformations_bd[i]=m_natural_transformations_bd[i-1];
         }
         //
         double _a=0.0;
         m_e_price.Let();m_e_price.Cardinality(1);m_o_average_a.Get(0,m_e_price);m_e_price.Get(0,_a);
         double _b=0.0;
         m_e_price.Let();m_e_price.Cardinality(1);m_o_average_b.Get(0,m_e_price);m_e_price.Get(0,_b);
         double _c=0.0;
         m_e_price.Let();m_e_price.Cardinality(1);m_o_average_c.Get(0,m_e_price);m_e_price.Get(0,_c);
         double _d=0.0;
         m_e_price.Let();m_e_price.Cardinality(1);m_o_average_d.Get(0,m_e_price);m_e_price.Get(0,_d);

         m_natural_transformations_ac[0]=_a-_c;
         m_natural_transformations_bd[0]=_b-_d;
      }
   }
The refresh function is a bit involving. We start with refreshing the close price pointer because it is the basis for category-1. Before we assign the latest value to this category’s solo object, we need to shift all existing elements within this object. We then do almost the same thing with the two objects of category-2. The difference here being we need to compute the moving average over each respective period first and once this is done we assign the values after shifting the values in both objects as we did in category-1. After this we then have to deal with the category-3 objects. They are 4, but as mentioned we are only utilizing 2 of them for our projections. The values of these objects we’ll get from the two objects we’ve just filled and in slight modification from the DEMA formula which subtracts the moving average of the moving average from double the moving average we will simply compute the former. The moving average of the moving average.
Integration of our model with EURUSD daily price data for test runs is done once our instance of the expert trailing class is assembled with the MQL5 wizard. As always there is a guide here on how to accomplish this. As mentioned we assemble this expert advisor with the awesome oscillator as our instance of the expert signal class.
Backtesting and analysis of EURUSD historical data is done from 2020.01.01 to 2023.01.01. Our test report from the best optimization results is presented below:

Critical noteworthy aspects of the report are usually the MAE profit correlation, and the holding period and profit correlation. These two are typically represented as graphs at the very bottom of the complete report. What is shared above is a summary that dwells on the common metrics everyone would look out for.
Testing and Forward Runs
If we do a forward run from 2023.01.01 to 2023.08.01, with the best settings from our back-test run, we are presented with the report below:

We did not get the walk we would like which usually means one of two things. The thesis of our model (trailing class used) is random and cannot be relied on in trade systems, or we implemented the idea incorrectly with bugs such as control-flow bugs in the code of our trailing class. The important thing to keep in mind though is that even if we had got a positive walk forward we would still need to do more comprehensive testing over a much longer period, for forex this could mean up to 2 decades and these tests should include real tick passes. In fact to emphasize this, the unique trailing stop adjustment 'signals' generated by our expert adviser do not happen very often because the moving average trend needs to be in the direction of the open position. Because of this the efficacy of the trailing class is not sufficiently tested over short test windows of which this 3-year epoch, you could argue, is one of. In addition these results are based on our trailing class being paired with the awesome oscillator but what would the performance be like when paired with other entry signals? This and other concerns all need to be taken into consideration when making an evaluation.
Testing on real data is another necessary step that should be undertaken before one can deploy this expert advisor or its variant that incorporates what we’ve covered here. The first step in this is setting up a demo account with your intended broker ideally with an account type that replicates the account you will be running live. Then attach the expert to the chart of the symbol(s) to be traded. It could be a good idea to use MetaQuote’s VPS service as less setup headache is involved and it is priced competitively, but whatever the choice made the need to monitor the expert logs to ensure expected performance and trade results is paramount. Both MetaQuote’s VPS and a typical VPS server easily allow this. Also, the real-time test account should start with an amount of capital intended to be deployed if the testing is positive. Finally, a personal trade journal could also be a good idea especially if the ideas presented here are added to be a part of another trading system that is news dependent in some form. Remember MQL5 strategy tester does not yet allow testing while reading economic calendar events so it could be helpful to log these yourself such that on review you can easily assess the relative importance of each news item over the long-term.
Interpreting the results and deciding on what to do next is very subjective, but as a guide one could argue that with a system that is profitable enough to meet the target requirements, the profit and MAE correlation should be positive and the holding period as well as the profits on each trade should have a positive correlation. The last metric is often referred to as the expectancy but unfortunately strategy tester reports do not compute this value.
Conclusion
To sum up, we have seen how horizontal composition of natural transformations can be useful in forecasting. The projections we considered for this article were for price bar ranges which can be taken to be a measure of volatility. These projections were put to use, as has been the case a few times in these article series, by adjusting the trailing stop of open positions. While in sample training results were positive, out of sample or walk forward results were not. This though a setback does not negate the need for a more comprehensive testing over a longer time span, before verdicts on the efficacy of the system can be reached.
The implications of these results on trade system development are that it could be paired with different entry signal classes to get improved results or even changes to our input datasets could be made to present different test scenarios.
As always, I invite the reader to explore these and any other avenues in amending and testing the attached code to his satisfaction.
References
References are made as usual mostly from Wikipedia but also this time from Investopedia.
Additional Resources on assembling and using the attached code in an expert advisor can be found here and here.
Warning: All rights to these materials are reserved by MetaQuotes Ltd. Copying or reprinting of these materials in whole or in part is prohibited.
This article was written by a user of the site and reflects their personal views. MetaQuotes Ltd is not responsible for the accuracy of the information presented, nor for any consequences resulting from the use of the solutions, strategies or recommendations described.
- Free trading apps
- Over 8,000 signals for copying
- Economic news for exploring financial markets
You agree to website policy and terms of use