
Category Theory in MQL5 (Part 14): Functors with Linear-Orders
Introduction
Category theory as introduced by Samuel Eilenberg and Saunders Mac Lane in the 1950s can be viewed as a means of studying systems with an emphasis on transformation at each phase rather than the phases themselves. It has been used in a wide continuum of applications ranging from functional programming with languages like Haskell; to linguistics by studying structure and compositionality of natural languages; to algebraic topology by providing a unified approach in understanding different topological constructions and invariants; to name but a few.
In these series category theory has thus far been localized in a sense that it was concerned with the sub-category level information & structure; mostly sets (objects) in our case. We have looked at their relations and properties, all within a category.
The purpose of this article and a few like it, going forward, is to zoom out of a category and start to look at the relations different categories can have amongst themselves. Formally these are referred to as Functors. So, we are going to look at various categories and their possible relations. Within a trader’s data set there are several candidates for categories worth studying. However, in order to emphasize the transcendent qualities of category theory we will step outside of the box, and for this article look at bridging ocean-tide data gathered off California’s coast to the volatility of the NASDAQ Index. Is there anything in ocean tides that portends volatility of this index? We hope to be able to answer this question, to some degree, by the end of the article.
This article and a few like it that will follow, will not be introducing new concepts per se but will be reviewing what has already been covered and looking to apply it differently which may mean at a broader scale.
Ocean Tides and NASDAQ Index
Ocean tide data is published and made available to the public by the National Oceanic and Atmospheric Administration (NOAA) through their website which can be viewed here. The data logs the height of ocean tide off of a datum, four times a day. The time and altitude of the tide at each time are all that gets recorded for each day all year round. Here is a preview:

All oceans are divided into 4 regions with tide values gathered from a host of measuring stations within each region. For the West Coast of North and South America for example, that spans from South America Chile all the way to Alaska, there are 33 stations. For our analysis we will pick data gathered from Monterey station in California for the year 2020.
The NASDAQ is a well-established stock exchange but we are looking at it here primarily as an index, that is composed of quite a few tech companies such as MSFT, AAPL, GOOG, and AMZN, that are all headquartered in California. This index can be traded from most brokers so its price feed will inform our category as we see if the market cap of these companies that have revolutionized industries and exemplify California’s innovation spirit are in any way linked to the ocean tide data gathered off of its coast.
Mapping Data using Category Theory Functors
We have not explicitly talked about functors in the series thus far, however in the articles where we looked at monoids, monoid groups, graphs, and orders; it was implied we were dealing with functors because each of these concepts could be thought of as a category and their relations often formed the basis of the articles they were in. So, the morphisms between monoids were defacto functors, for example.
Formally a functor is a mapping between categories that preserves their structure and relations as defined by the objects and their morphisms within each. If C and D are categories, then the functor F from C to D
Consists of two things namely: for every object c in C there is an associated object F(c) in D and for every two objects in b, c in C with a morphism f
![]()
there is an associated morphism F(f)
in D. Functors also have the additional axioms of preserving composition meaning if we have morphisms
![]()
and
in C then F preserves the composition in C such that
and identity morphisms in C are preserved for each mapped object in D such that if
then
The importance of relating different categories stems in discovery. For each system that is classified as a category there is often by default no way of not only translating one category into another, but also of establishing the ‘relative position’ and perhaps importance of each category within a wider context. This is why functors which for instance could map a category of tradeable securities with its own portfolio of weighted morphisms to another category of trading strategies. The benefit of such a functor to traders could be down to perspective but if the functor maps over a time lag then we could either establish what strategies to use given our portfolio securities, or what securities to hold next given our current strategy, for example.
A linear order or total order, to recap, besides meeting transitivity and reflexivity axioms, also meets anti-symmetry and comparability requirements. This usually means all the data in a linear order should be numeric or if it is text be discrete such that the binary operation ‘<=’ can still be applied without ambiguity or the yielding of an undefined result. The Ocean-tide data as represented at NOAA website is multi-dimensional if we take a day as a single data point. It has 4 datetime entries for each height, 4 floating point values of the heights, and the datetime entry for the day. If we take our linear order to compare the datetime value of the day for each data point then ocean data becomes a simple time series with 2 pieces of data at each point, the date as datetime and tide height as floating-point data.
Representing this linear order as a category would mean the binary operation between any two consecutive data points becomes a morphism and each data point becomes an object, that contains 4 pieces of data the 4 datetimes the heights are logged and the 4 height values, if we are to group this data into days since these tide values were captured daily. We do however need to normalize this data a bit more since not all days have 4 data points. Some have only 3. Since our category will have simple isomorphic relations and it is important we are consistent on the number of elements in each domain (day).
The volatility category of the NASDAQ would follow a similar fashion to the ocean tides in that we link price data points, based on sequence in time, as morphisms.
Comparative Analysis and Insights
If we map our tide category to NASDAQ Index category we would have to do this with a time lag in order gain any forecast benefit from it. But first we would need to construct an instance of the ocean tide class category and this can be represented as shown below:
protected:

      ...

      CCategory _category_ocean,_category_nasdaq;

      CDomain<string> _domain_ocean,_domain_nasdaq;

      CHomomorphism<string,string> _hmorph_ocean,_hmorph_nasdaq;
Since we are interested using this functor for forecasting, our category will be dynamic in that it will get redefined on each new bar but the functor from it to the NASDAQ category will be constant. So since it is one day long for our lag, the three afore mentioned morphisms linking the logged ocean altitudes can be defined from reading ocean tide data off the csv file as follows:
void CTrailingCT::SetOcean(int Index)
   {
      ...

      if(_handle!=INVALID_HANDLE)
      {
         ...

         while(!FileIsLineEnding(_handle))
         {
            ...

            if(_date>_data_time)
            {
               _category_ocean.SetDomain(_category_ocean.Domains(),_domain_ocean);

               break;
            }
            else if(__DATETIME.day_of_week!=6 && __DATETIME.day_of_week!=0 && datetime(int(_data_time)-int(_date))<=PeriodSeconds(PERIOD_D1))//_date<=_data_time && datetime(int(_data_time)-(1*PeriodSeconds(PERIOD_D1)))<=_date)
            {
               _element_value.Let();_element_value.Cardinality(1);_element_value.Set(0,DoubleToString(_value));
               _domain_ocean.Cardinality(_elements);_domain_ocean.Set(_elements-1,_element_value);

               _elements++;
            }
         }

         FileClose(_handle);
      }
      else
      {
         printf(__FUNCSIG__+" failed to load file. Err: "+IntegerToString(GetLastError()));
      }
   }
Similarly, we will construct our set for NASDAQ volatility with the listing below:
void CTrailingCT::SetNasdaq(int Index)
   {
      m_high.Refresh(-1);
      m_low.Refresh(-1);

      _value=0.0;

      _value=(m_high.GetData(Index+StartIndex()+m_high.MaxIndex(Index,_category_ocean.Homomorphisms()))-m_low.GetData(Index+StartIndex()+m_low.MinIndex(Index,_category_ocean.Homomorphisms())))/m_symbol.Point();

      _element_value.Let();_element_value.Cardinality(1);_element_value.Set(0,DoubleToString(_value));
      _domain_nasdaq.Cardinality(1);_domain_nasdaq.Set(0,_element_value);

      _category_nasdaq.SetDomain(_category_nasdaq.Domains(),_domain_nasdaq);
   }
Its morphisms are also assembled in a fashion not too dissimilar. Now the functor as already noted in the definition maps not just the objects across the two categories, but it maps the morphisms as well. This sort of implies one checks the other. If we start with the object mapping, part of our functor for ocean tide data to NASDAQ, it is initialized as follows:
double CTrailingCT::GetOutput()
   {
      ...

      ...

      _domain.Init(3+1,3);

      for(int r=0;r<4;r++)
      {
         CDomain<string> _d;_d.Let();
         _category_ocean.GetDomain(_category_ocean.Domains()-r-1,_d);

         for(int c=0;c<_d.Cardinality();c++)
         {
            CElement<string> _e; _d.Get(c,_e);

            string _s; _e.Get(0,_s);

            _domain[r][c]=StringToDouble(_s);
         }
      }

      _codomain.Init(3);

      for(int r=0;r<3;r++)
      {
         CDomain<string> _d;
         _category_nasdaq.GetDomain(_category_nasdaq.Domains()-r-1,_d);

         CElement<string> _e; _d.Get(0,_e);

         string _s; _e.Get(0,_s);

         _codomain[r]=StringToDouble(_s);
      }

      _inputs.Init(3);_inputs.Fill(m_consant_morph);

      M(_domain,_codomain,_inputs,_output,1);

      return(_output);
   }
In the same vein our morphism functor construction will take the following shape:
double CTrailingCT::GetOutput()
   {
      ...

      ...

      _domain.Init(3+1,3);

      for(int r=0;r<4;r++)
      {
         ...

         if(_category_ocean.Domains()-r-1-1>=0){ _category_ocean.GetDomain(_category_ocean.Domains()-r-1-1,_d_old); }

         for(int c=0;c<_d_new.Cardinality();c++)
         {
            ...

            CElement<string> _e_old; _d_old.Get(c,_e_old);

            string _s_old; _e_old.Get(0,_s_old);

            _domain[r][c]=StringToDouble(_s_new)-StringToDouble(_s_old);
         }
      }

      _codomain.Init(3);

      for(int r=0;r<3;r++)
      {
         ...

         if(_category_nasdaq.Domains()-r-1-1>=0){ _category_nasdaq.GetDomain(_category_nasdaq.Domains()-r-1-1,_d_old); }

         ...

         CElement<string> _e_old; _d_old.Get(0,_e_old);

         string _s_old; _e_old.Get(0,_s_old);

         _codomain[r]=StringToDouble(_s_new)-StringToDouble(_s_old);
      }

      _inputs.Init(3);_inputs.Fill(m_consant_morph);

      M(_domain,_codomain,_inputs,_output,1);

      return(_output);
   }
The bulk of work here is in making the ocean tide data accessible to MQL5. To that end the data is accessed from a csv file in the common data folder in a tabular format that is similar to our element in the ocean tide category. The data format includes a datetime field for synchronizing with our trade server time in selecting the right values. MQL5 IDE has other alternatives for accessing such secondary data and one such is via a database since native connection design is possible from the IDE. So, if you have a database on the local machine or a cloud connection to one then this could be explored. For our purposes though since I would like readers to easily be able to replicate test results posted here, a csv file on the common folder is being used.
Our functor maps two things across the categories which means in order to avoid duplicity we will simply have one connection check or verify the other. Since at the onset we do not know which of these setups would be ideal for our trade system, we will test both.
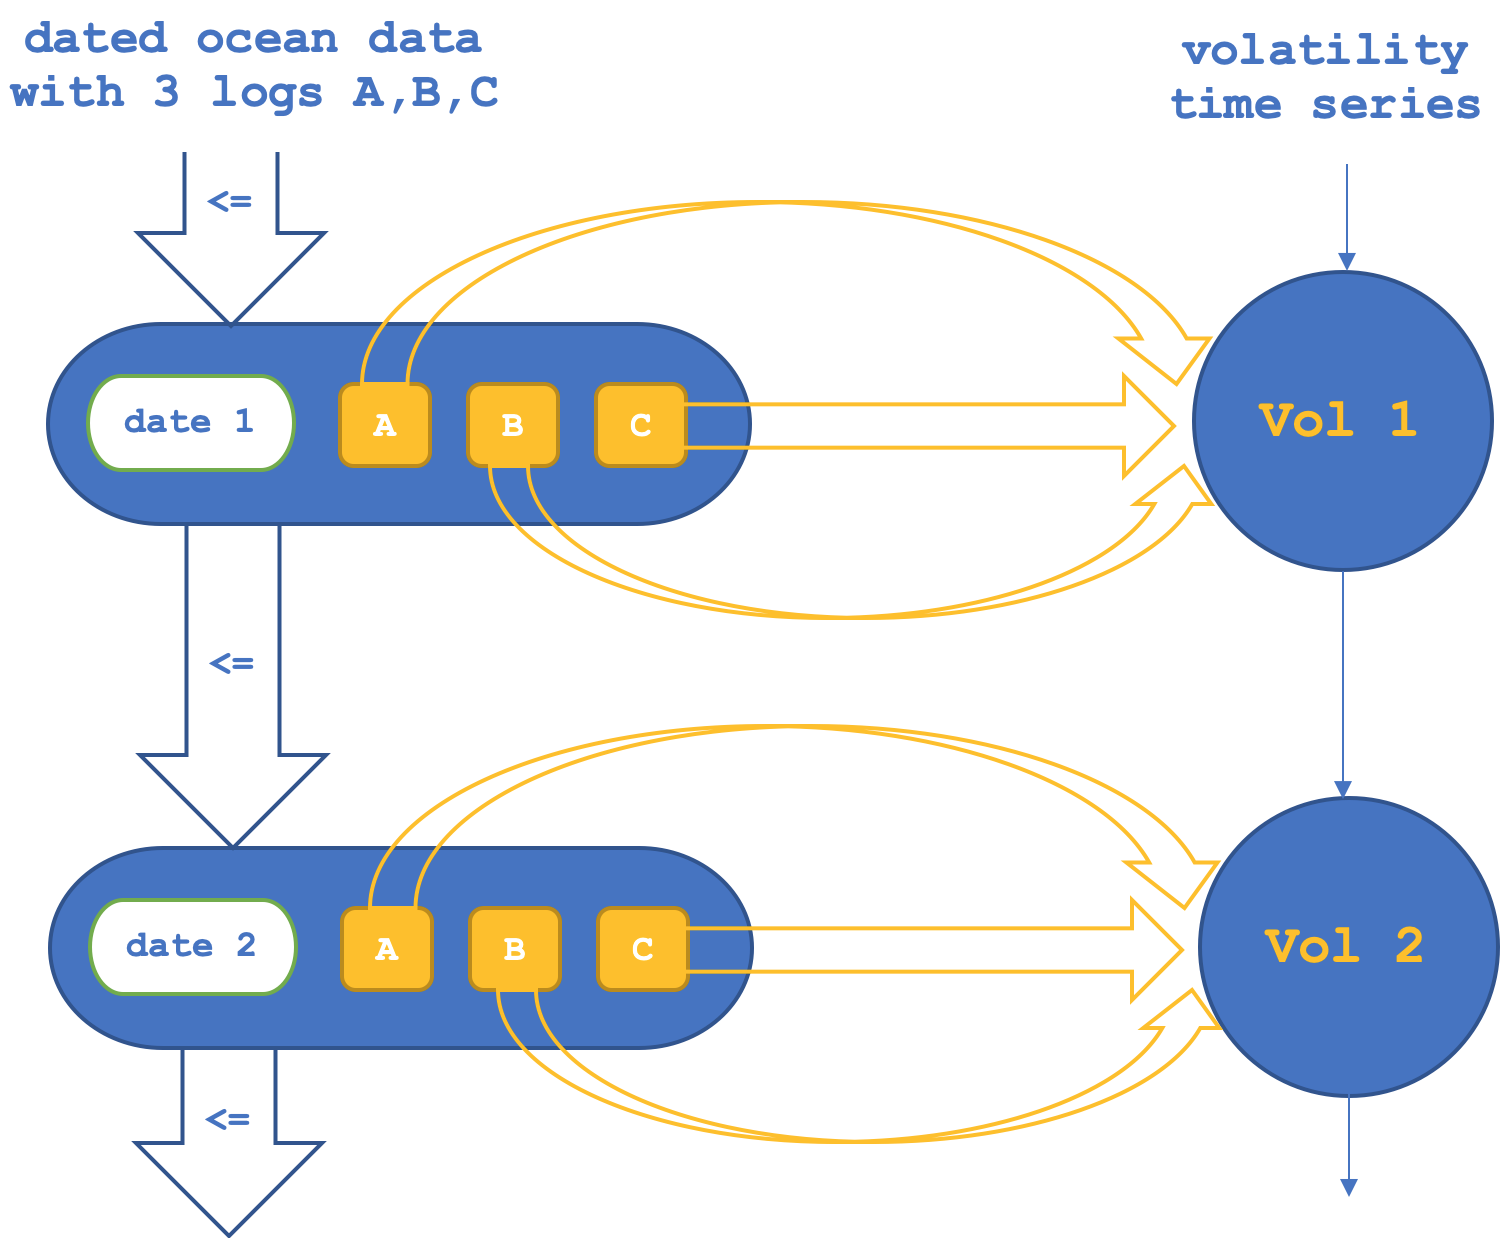
So, in the first setup we will have the functor across the objects confirm or verify the morphisms between the objects in the codomain (NASDAQ set). This can diagrammatically be represented as below:
If we run tests to try forecasting NASDAQ volatility based on the object functors only, we get reports such as the one below (code for this is attached as 'TraillingCT_14_1a'):

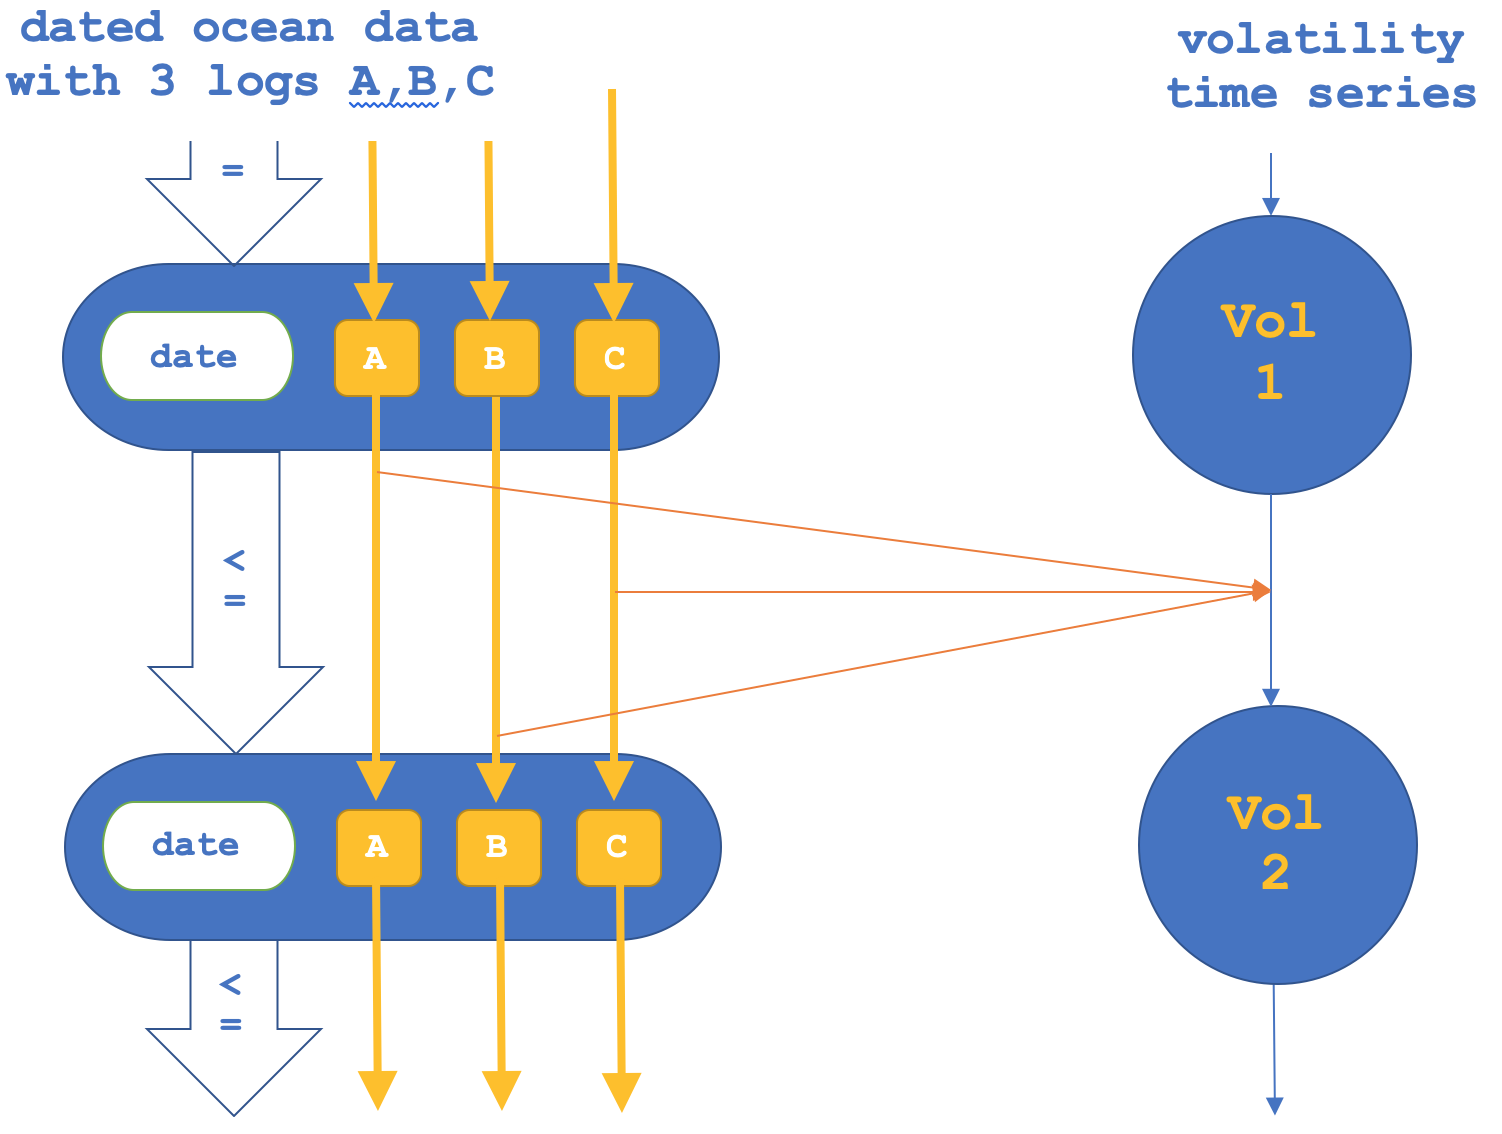
If as mentioned we also try the reverse where we focus on the functors across the morphisms and then confirm the objects, this could be represented as follows:
A tester report, for morphism functors only is indicated below:

From our two testing options above mapping objects versus mapping morphisms produced different results even over the very short testing window from 1st January 2020 to 15th March the same year on a daily timeframe. Which of the two could be better useful to traders in making forecasts of any kind, not just on volatility, would require testing over extended periods on the specific aspect of the trading system being tested whether entry signal, money management, or trailing stop as in this case.
The period chosen for this testing though very short, was actually significant for the NASDAQ as it was when the index came to its all-time highs then, in the midst of the covid pandemic onset, declined quite precipitously. So, while this testing does suggest a possible correlation with ocean tide data it is certainly not implying any causation.
As has been the case in these series the entry signal used is very basic in this case it was the inbuilt awesome oscillator on default settings of the respective signal file. Position sizing was also fixed margin as usual. We tested the NASDAQ on daily time frame because our domain category data was gathered daily, at three intervals. So, in formatting this as a category equivalent linear-order, each day constituted a domain (object) that had 3 elements which were the three data points of each day as already mentioned.
What should be the big take away here is that disparate and seemingly unrelated sets of data could be examined and tested for useful lagging relations that could help inform trading decisions. In our testing above the lag was a single day, yours could be longer. Possible alternate data sets to what we have used here, ocean tides, could have been chosen and this is a very long list. But perhaps, it may be helpful to share a few examples of data sets that can substitute ocean tide data used above that would also provide more insights in how interconnected our markets and exogeneous systems are.
Alternate data sets could include commodity prices; technology news where the number of articles on new technology trends for instance like AI versus alternative news articles like on entertainment could be tracked with a lag for possible relation; social media sentiment data on the tone of social media posts as quantified by lexicon-based methods can also be examined for relations to NASDAQ(or any traded security's) volatility especially if it is on or related to technology stocks. These examples again are leaning on the esoteric side to help one build an edge but data sets that are closer to home like prices of other securities or their indicator values could be considered.
Conclusion
To recap we have explored how data in a linear-order format category can be linked by functor to security prices. In this case our domain data was an unlikely data set of ocean tide elevations taken off California’s coast and this was linked to NASDAQ volatility with a day’s lag via functor. This linkage can take two formats either from objects to objects or morphisms to morphism. From our testing that involved having identical entry signals and position sizing methods both formats yielded significantly different results given the short testing window.
Category theory functors are valuable and can be instrumental in mapping different types of data. We used a fairly difficult data set to sort and compose for this article but the reader can look at more palatable sources although they may not necessarily deliver him his edge, but for testing purposes they could be insightful.
Future possibilities and extensions in linking linear-orders to sets from a trader’s view can take a number of directions. These could include: Interdisciplinary applications which could stem from stock market trends being functored to other areas of interest like alternate datasets as alluded to above; Predictive modelling where functors that are across carefully set time lags, as has been tested in this article, could be applied even outside financial markets into fields like weather forecasting; Data integration and knowledge graphs where concepts presented here could improve representation in fields like artificial intelligence; Machine learning and transfer learning where linear-orders that are functor related to financial data could be developed further for instance if functor weights gained between two categories could be tested or even applied in different domains potentially improving machine learning models and their effectiveness.
Many other possibilities exist. Not to be exhaustive but these include statistical analysis and data fusion, casual inference and correlation study, quantitative finance with algorithmic financing, data-driven decision making etc. The choice of application will be set by one’s perspective or approach to trading if he/ she is a trader.
The reader is encouraged to explore this field with respect to their specialty and approach to the markets because the concepts explored here are barely scratching the surface. The realm of this subject holds a lot of potential, and in a sense is always inviting you to delve deeper into fringe uncharted territories for interdisciplinary data analysis.
Do place the files 'TrailingCT_14_1a.mqh' and 'TrailingCT_14_1b.mqh' in the folder 'MQL5\include\Expert\Trailing\' and 'ct_14_1s.mqh' can be in the include folder.
You may want to follow this guide on how to assemble an Expert Advisor using the wizard since you would need to assemble them as part of an Expert Advisor. As stated in the article I used the Awesome Oscillator as the entry signal and fixed margin for money management both of which are part of MQL5's library. As always the goal of the article is not to present you with a Grail but rather an idea which you can customise to your own strategy. The MQL5 files that are attached are what was assembled by the Wizard, you may compile them or assemble your own.
- Free trading apps
- Over 8,000 signals for copying
- Economic news for exploring financial markets
You agree to website policy and terms of use