What you can do with Moving Averages

Introduction
I have several working trading systems. Generally, I do not use indicators calculated on every ticks preferring straight lines instead. But sometimes I come across ideas that improve my perception of a price chart or even completely change my vision of trading, albeit requiring some calculations.
This article presents some ideas related to the most popular and comprehensible indicator — the Moving Average (МА).
In its simplest version, the indicator value is calculated using the well-known average equation:
MA[i] = (Price[i]+Price[i+1]+...+Price[i+MAPeriod])/MAPeriod
Here, MA[i] is the next element of the sequence, a dot on a curve. Price[i] — current price, MAPeriod — number of elements for averaging.
Of course, we are free to apply any price: Open, Close, High, Low, weighted average values, etc. A standard indicator allows selecting both the calculation price and the calculation methods, including the ones that are more complex than a simple average... While providing examples, I leave the opportunity to select a calculation method. However, this is not important for grasping the idea behind the considered methods. All examples work pretty well regardless of whether we use a "simple" Moving Average (SMA), an exponential one (EMA) or any other. Therefore, SMA is used by default in all screenshots and default indicator settings. All indicators use Close prices if not indicated otherwise. You are free to play around these parameters to improve them.
When talking about a single curve, I will usually use a default period value of 10 bars. If several curves with different periods are used in a single indicator, the applied periods will most often be 5 and 8. I do not use more than two curves with different periods.
The colors are as follows: red — fast, orange — slow... If I use something else, I will explicitly state than in the text.
Template indicator
I have created several indicators to visualize signals triggered when using various approaches to curves. They are based on a single template which is much similar to a standard MACD present in standard examples. I believe, there is no point in showing the entire template code here.
Each indicator will use one or several Moving Averages and sometimes also ATR for defining a distance to arrows or drawing channel lines.
Sometimes, it is easier to visualize an idea if an indicator is located in a chart window, while sometimes it requires an indicator located in a separate window. This is done using one of the properties. The following property is used for an indicator inside a chart window:
#property indicator_chart_window
If an indicator is located in a separate window, the following property is applied:
#property indicator_separate_window
In this case, I will sometimes set the window height using the property:
#property indicator_height 100
Of course, the property value can be changed.
The buffer names have the "Buffer" suffix in the end. For example, standard arrow buffers will be called ArrowDownBuffer and ArrowUpBuffer. If the indicator draws the lines, the buffer is named according to the line function.
Any global variables I have defined have the "ext" prefix (if they are not buffers). For example, extATRData is a global variable containing the source data of ATR indicator.
I will use buffers without switching to the "series" mode.
During initialization, I set all empty values to 0:
  PlotIndexSetDouble(0,PLOT_EMPTY_VALUE,0);
  PlotIndexSetDouble(1,PLOT_EMPTY_VALUE,0);
  PlotIndexSetDouble(2,PLOT_EMPTY_VALUE,0);
Thus, we only need to show arrows or lines display conditions, i.e. all that remains in the main loop.
I try to avoid indicator redraws, therefore the drawing is performed on a zero candle, while the data of the already closed candles is used for calculations.
Line crossing by price (trend direction)
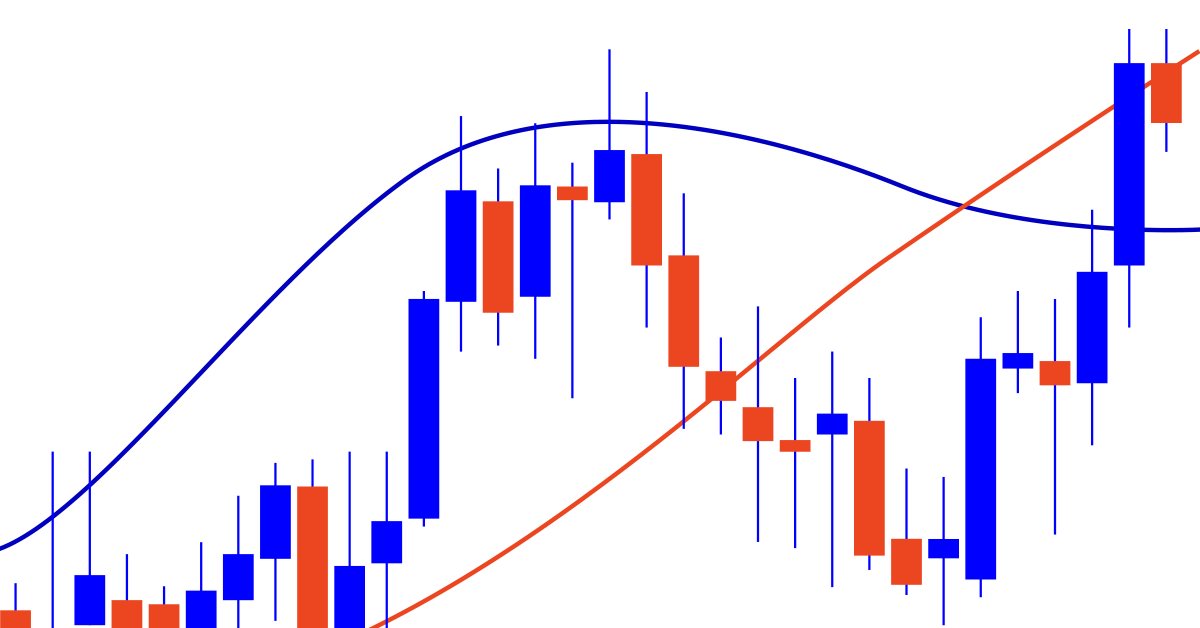
In the simplest case, the line МА is used solo, in its "natural" form. I believe, you all have seen a similar image on your screens:

Fig. 1. Simple Moving Average
In most cases, traders use the MA ability to follow a trend. A trend can be defined as a set of candles located on one side of the curve. For example, if more than two candles close below the line, the trend is bearish and it is time to consider short trades. If the close price is above the curve, the trend is bullish and it is time to buy... If the price crosses the curve, we are witnessing the change of a trend.
The conditions allowing us to track an average breakthrough may look as follows:
//--- main cycle
  for(i=start+3; i<rates_total && !IsStopped(); i++)
   {
    ArrowDownBuffer[i]=0;
    ArrowUpBuffer[i]=0;

    //---

    if(
      ((close[i-1]<extMAData[i-1]
        && open[i-1]>extMAData[i-1]
       )
       ||(close[i-2]>extMAData[i-2]
          && open[i-2]>extMAData[i-2]
          && close[i-1]<extMAData[i-1]
          && open[i-1]<extMAData[i-1]
         )
      )

    )
     {
      ArrowDownBuffer[i]=high[i]+extATRData[i]/5;
     }
    else
      if(
        ((close[i-1]>extMAData[i-1]
          && open[i-1]<extMAData[i-1]
         )
         ||(close[i-2]<extMAData[i-2]
            && open[i-2]<extMAData[i-2]
            && close[i-1]>extMAData[i-1]
            && open[i-1]>extMAData[i-1]
           )
        )
      )
       {
        ArrowUpBuffer[i]=low[i]-extATRData[i]/5;
       }
   } // main cycle
Instead of checking Open prices, we may focus our attention solely on Close prices of the current and previous bars. If they are located at different sides of the curve, we are witnessing a breakthrough.
The indicator file is MA-Breaking.mq5. Running it on the chart yields the following image (in case of the standard curve period of 10 bars):

Fig. 2. Average breakthrough
I believe, this method is not useful without additional sorting. It looks like the number of up arrows almost matches the number of down arrows even in the trend area. When increasing the МА period, the number of arrows is decreased, however this is of no much help since a sharp breakthrough with a trend having no rollback is a pretty rare occurrence. In most cases, a sharp movement is preceded by a flat. So let's look for filters...
МА as support/resistance line
The next pretty obvious way of using the curve is applying it as support/resistance line. If the price touches the line but does not cross it (closes on the same side), we have a trade signal. For example, on February 17, we can see 3 downward movement points and, if there are no additional filters, one upward movement point (at the beginning).
Naturally, we can use this rule both for opening the first trade and for adding to the existing one.
This concept is demonstrated in the MA-Support.mq5 file.
//--- main cycle
  for(i=start+3; i<rates_total && !IsStopped(); i++)
   {
    ArrowDownBuffer[i]=0;
    ArrowUpBuffer[i]=0;

    //---

    if(
      (high[i-1]>=extMAData[i-1]
       && close[i-1]<extMAData[i-1]
       && open[i-1]<extMAData[i-1]
      )
    )
     {
      ArrowDownBuffer[i]=high[i]+extATRData[i]/5;
     }

    else
      if(
        (low[i-1]<=extMAData[i-1]
         && close[i-1]>extMAData[i-1]
         && open[i-1]>extMAData[i-1]
        )
      )
       {
        ArrowUpBuffer[i]=low[i]-extATRData[i]/5;
       }
   } // Main cycle end
Below is the code operation result:

Fig. 3. Using МА as support/resistance line
This looks better than the previous option. If we use take profit levels or even simply accumulate orders by arrows and exit by an oppositely directed arrow (apparently, using reversal), the chance of profitable trading is high.
The higher the МА period, the more low angle it is and the farther it is located from the price. Thus, breakthrough and rollback signals arrive less often but the level becomes more reliable as support/resistance level. Let me show you a 20-period chart for comparison. We can see that rollbacks are less often. However, the signals are probably more reliable, so a stop loss level can be reduced.
")
Fig. 4. MA with the large period (20)
For example, at 4 a.m. February 17, the red curve provides a buy signal and we get a loss since the orange one provides a sell signal. However, in case of the red line, we can use signals at 8 a.m., 10 a.m. and 3 p.m. to add to the position.
In case of higher MA periods, signals arrive later which may cause losing part of a potential profit, although trades may become less often.
Slope
The steeper the line slope, the faster the price moves and the more likely the trend will continue on the next candle.
The easiest way to measure the slope is to use the difference between the current and previous values. If the difference is positive, the curve moves upwards, if the difference is negative, it moves downwards.
The code of the main loop in MA-Slope.mq5 looks as follows:
//--- main cycle
  for(i=start+SlopeShift*2; i<rates_total && !IsStopped(); i++)
   {
    SlopeDownBuffer[i]=0;
    SlopeUpBuffer[i]=0;
    slopeIndex=(extMAData[i-1]-extMAData[i-1-SlopeShift]);

    //---

    if(
      slopeIndex<0

    )
     {
      SlopeDownBuffer[i]=slopeIndex;
     }
    else
      if(
        slopeIndex>0
      )
       {
        SlopeUpBuffer[i]=slopeIndex;
       }
   } // main cycle
Here SlopeShift specifies the number of bars to be passed from the current price. The default value is one. But we are able to get pretty interesting results by increasing this value, for example, by using the difference of MA values in two or three bars.
I believe, the resulting curve should be displayed as a histogram. The result is shown below:

Fig. 5. Curve slope histogram
The image is quite interesting.
First, it is obvious that we can easily track and sort random movement fluctuations. Indeed, if the curve direction changes only during one, two or three bars, it is probably premature to talk about a trend change. Anyway, we should be extremely careful not to miss it.
Second, rate changes are immediately visible. As we can see, if the diagram column height is less than a certain value, we are most probably facing a flat. Thus, it would be unreasonable to trade in the direction of the MA small slope longer than 2-3 bars.
Third, despite the fact that the curve on trend segments looks almost monotonously rising or falling, the real change rate varies greatly from bar to bar. This suggests some kind of relative value, which will probably help to see something we are unable to see yet.
Trying (МА-Slope-Index-First.mq5)... Code:
//--- main cycle
  for(i=start+SlopeShift*3; i<rates_total && !IsStopped(); i++)
   {
    SlopeDownBuffer[i]=0;
    SlopeUpBuffer[i]=0;
    slopeIndex=(extMAData[i-1]-extMAData[i-1-SlopeShift]+Point()/100)
               /(extMAData[i-2]-extMAData[i-2-SlopeShift]+Point()/100);
    //---

    if(
      slopeIndex<0
    )
     {
      SlopeDownBuffer[i]=slopeIndex;
     }
    else
      if(
        slopeIndex>0
      )
       {
        SlopeUpBuffer[i]=slopeIndex;
       }
   } // main cycle
Adding a small value (Point()/100) to the dividend and divisor does not change the result very much, but it allows us to avoid the zero divide error.
The image is as follows:

Fig. 6. Relative index of the average slope
Sharp peaks can be seen at the junctions. If we move the chart for a couple of bars to the left, the difference becomes even more vivid.

Fig. 7. Relative index of the MA slope (moved to the left)
Fig. 7 vividly demonstrates how peak values mark the borders of a pretty strong movement. The difference of peak values with the remaining data array is quite large. The fact that the "peaks" are so different from each other in terms of size, as well as the fact that the difference between peaks and other data is so considerable, lead up to the next step. Since the direction change is so notable, I do not see the point in analyzing the histograms of a relative slope index. Instead, we can simply make the output more rough by making it binary. For example, like this (МА-Slope-Index-Bin.mq5):
//--- main cycle
  for(i=start+SlopeShift*3; i<rates_total && !IsStopped(); i++)
   {
    SlopeDownBuffer[i]=0;
    SlopeUpBuffer[i]=0;
    slopeIndex=(extMAData[i-1]-extMAData[i-1-SlopeShift]+Point()/100)
               /(extMAData[i-2]-extMAData[i-2-SlopeShift]+Point()/100);
    //---

    if(
      slopeIndex<=-SlopeThreshold
    )
     {
      SlopeDownBuffer[i]=-1;
     }
    else
      if(
        slopeIndex>=SlopeThreshold
      )
       {
        SlopeUpBuffer[i]=1;
       }
   } // Main cycle
Here SlopeThreshold is a threshold value of the previous diagram bar height, at which the signal is triggered. On the image, the parameter value is equal to 5.
")
Fig. 8. Relative index of the average slope (binary). SlopeThreshold=5.
Below is yet another image with SlopeThreshold=15

Fig. 9. Relative index of the average slope (binary). SlopeThreshold=15.
These stripes definitely deserve a closer look!
Apparently, such markers indicate a change of direction of the current candle, or of 2-3 or even more candles after the marked one. In any case, there is a clear dependence of the trend on the combination of marker colors, the main direction and the actual candle. Of course, we should gather statistics, for example, in the way I described in my article about spreadsheets. In combination with other methods provided here, the indicator already looks promising...
Of course, binary stripes on the histogram can be easily replaced with arrows similarly to the previous indicators.
Channels based on a single Moving Average
We can build channels based on Moving Averages in addition to the methods described above in order to consider the price movement volatility. The options are numerous. I will consider only the two ones.
The first one is very simple since it requires only the standard MA indicator. We should simply add levels when adding an indicator on the chart. The only caveat is that each timeframe has its own levels. I have gathered them into a single "package" to avoid entering them every time I switch timeframes. The image looks as follows for JPY:

Fig. 10. List of channel levels
The final image on H1 looks as follows:

Fig. 11. Levels appearance (H1)
The levels are set for a rollback here. So if a candle touches a level and rolls back from it (or comes pretty close to it), enter against the trend. For example, the channel on the screenshot shows that there was a good time for selling on February 22. We can set an order in the middle of the signal candle or in the end (here, if we enter after a rollback, an order could have been set at the signal candle Low - 115.100, while a stop level could have been set at 115.265). The immediate target is touching the average, while the ultimate target is touching an opposite border of the same channel.
However, in this case, it is also possible to trade the narrow channel breakthrough. For example, the 9-hour candle closed above the narrow channel border on February 22. Two bullish candles have closed above the average, while the bearish candle between them have not moved beyond the lower border. The МА slope is clearly decreasing (this can be most clearly seen if we look at the chart with MA-Slope set). All this can be used as a clear buy signal. A stop level can be set at 114.570, The entry point can be calculated using levels. We can set it at 115.230. Alternatively, we can use trailing stop by candles or use any other method we want.
Please note that only two channels can be seen on the period: the most internal one and the one that is slightly bigger. If we switch to a higher timeframe, say, D1, the channel +-50 is almost hidden, while +-300 and +-1500 may become operating channels. The monthly channel can also be seen sometimes. It may even provide signals, but the most visible channels are used as the main ones.
")
Fig. 12. Levels appearance (D1)
A similar image can be seen on weekly/monthly scale. The fourth channel fits it best, while the third one can be used as the internal and auxiliary one.
The most internal channel is designed for М1-М15.
The adjustment principle is obvious: we switch to the necessary timeframe and select the size of levels so that we have the minimum number of touching points, while also having the maximum possible amplitude between them. The easiest way to do this is to measure the amplitude of the essential correction on the current timeframe and divide it by 2. The animation below illustrates the process.

Fig. 13. Measuring the channel volatility (D1)
After some rough estimates, we may need to adjust the size more precisely, but this is pretty easy...
Channels based on two Moving Averages (ATR3x5)
The channels described above are good but they have a couple of drawbacks.
First, the channel size should be selected manually for each timeframe and symbol. Automating the process seems to be a difficult task.
Second, the levels are not stored in buffers, which means it would be difficult to use them programmatically.
The channel based on Moving Averages and ATR does not have such drawbacks. The idea is simple. We take two Moving Average indicators with the period of 3. One of them is applied to Highs (high), while another one is used with Lows (low). Next, shift the obtained lines to the distance of a 5-period ATR in the appropriate direction (the lower one goes down, the upper one goes up).
The channel is ready! It perfectly fits any symbol and works mostly on a rollback since breakthroughs are pretty rare. I have also added the arrows for detecting touches of the channel borders.
//--- main cycle
  for(i=start+3; i<rates_total && !IsStopped(); i++)
   {
    ArrowDownBuffer[i]=0;
    ArrowUpBuffer[i]=0;

    //---

    MAUpBuffer[i]=extMAUpData[i]+extATRData[i]*DistanceCoefficient;
    MADownBuffer[i]=extMADownData[i]-extATRData[i]*DistanceCoefficient;

    if(
      (high[i-1]>=MAUpBuffer[i-1]
       && close[i-1]<MAUpBuffer[i-1])
      ||(
        close[i-2]>MAUpBuffer[i-2]
        && close[i-1]<MAUpBuffer[i-1]
      )
    )
     {
      ArrowDownBuffer[i]=high[i]+extATRData[i]/5;
     }
    else
      if(
        (low[i-1]<=MADownBuffer[i-1]
         && close[i-1]>MADownBuffer[i-1])
        ||(
          close[i-2]<MADownBuffer[i-2]
          &&close[i-1]>MADownBuffer[i-1]
        )
      )
       {
        ArrowUpBuffer[i]=low[i]-extATRData[i]/5;
       }
   }// main cycle
Here DistanceCoefficient is an indicator parameter allowing us to change the distance to the channel borders adjusting the indicator to specific conditions. The parameter can take any fractional value. However, there is no much point in setting more than 2 since the arrows almost completely disappear in that case meaning no deals are performed.

Fig. 14. ATR3x5 channel
Of course, the indicator can be used in conjunction with any other indicator described (or not described) here.
When looking at the image, focus on how the price interacts with the indicator tops and bottoms. It might be helpful.
Several indicators with different periods
Till now, we considered using a single MA line for receiving buy and sell market signals. However, many traders believe that the entry accuracy can be greatly improved by adding another indicator or several indicators.
So let's create the chart with two curves having the periods of 5 and 8 bars. The periods are taken from the Fibo series. One of the periods describes the "fast" line, while another one describes the "slow" one.

Fig. 15. Two MAs on a single chart
In addition to the already considered features, we now have the ability to see the relative position of curves and their "co-directionality" (or divergence). The distance between МАs appears as well.
Each of the parameters may strengthen or weaken some movement attributes displayed by each of the curves, as well as provide independent entry signals.
Relative position. Crossing MAs
If the fast MA is located above the slow one, we are most probably witnessing a bullish trend and the probability of the next candle being bullish is very high. Other parameters should also be considered, for example the signal line slope, as well as other parameters.
If the fast MA is below the slow one, we have a "global" (for the current timeframe) bearish trend and the probability of each subsequent candle being bearish strongly increases till we reach the peak...
We can admit a trend change if the fast MA breaks through the slow one.
Let's try to develop the indicator responding to crossing MAs. Besides, we should also consider flats to reduce false entries. This can be done, for instance, by considering the fast MA slope size. In this case, we can receive the next code to search for signals (MA2-Breaking):
//--- main cycle
  for(i=start+3+SlopeShift*2; i<rates_total && !IsStopped(); i++)
   {
    ArrowDownBuffer[i]=0;
    ArrowUpBuffer[i]=0;

    //---

    if(
      extMAFastData[i-1]<extMASlowData[i-1]
      && extMAFastData[i-2]>=extMASlowData[i-2]
      && MASlope(extMAFastData,i-1)<-SlopeThreshold
      && MASlope(extMASlowData,i-1)<SlopeThreshold/SlowDelimiter
    )
     {
      ArrowDownBuffer[i]=high[i]+extATRData[i]/3;
     }
    else
      if(
        extMAFastData[i-1]>extMASlowData[i-1]
        && extMAFastData[i-2]<=extMASlowData[i-2]
        && MASlope(extMAFastData,i-1)>SlopeThreshold
        && MASlope(extMASlowData,i-1)>-SlopeThreshold/SlowDelimiter
      )
       {
        ArrowUpBuffer[i]=low[i]-extATRData[i]/3;
       }
   } // main cycle
Here MASlope is a function calculating the MA slope in a way similar to the example provided in the Slope section. It accepts the data array for the necessary curve and bar index the calculations are performed on as parameters.
SlopeTreshold — threshold value of the fast MA slope diagram. As you might remember, if the fast MA slope is too small at the moment of crossing, we are most probably dealing with a flat. The flat is usually beset by a huge number of false positives eventually causing losses.
SlowDelimiter — slow MA slope threshold delimiter. Sometimes, we may have a pretty good signal when the fast MA has already tilted downwards, while the slow one has not reversed yet although it is close to the reversal. In other words, the entry
MASlope(extMASlowData,i-1)>-SlopeThreshold/SlowDelimiter
means the following: the slow MA slope can have either a small negative value (directed downwards, albeit slightly), be equal to zero or be positive, but not sharply negative.
If we use the indicator in its "clear" form, the threshold and the delimiter should be selected for each tool and timeframe separately. Below is the result obtained for USDJPY H1 with SlopeTreshold=0.017 and SlowDelimiter=5:

Fig. 16. MA crossing signals considering the slope
The image has no curves so that the arrows can be seen more clearly. If we select the right take profit value (or exit by levels), we can get profit almost from every arrow by setting stop levels that are not too loss-making.
The image below represents the same chart at a closer look (larger zoom).
")
Fig. 17. MA crossing considering the slope (zoomed in)
As you may remember, the signal arrives on a zero candle. However, the previous interval is analyzed. So, in order to understand the reasons behind drawing an arrow, we should have a look at the interval from the green line up to the bar to the left.
Why do we not have two arrows on the right? The slope does not exceed the threshold either for a slow or for fast MA and the indicator considers this interval to be a flat. However, if I had traded this area with these signals, I would most likely not have any reasons to grumble since the trend went up further and made it possible to sell at a better price.

Fig. 18. Crossing signals: trend continues.
Conclusion
I still have some things to say about the matter, but I will do this in another article.
In this article, I have considered basic things related to MAs and allowing us to track the general price movement direction.
Besides, I have displayed codes of indicators graphically demonstrating the use of the main MA parameters for making trading decisions.
I have shown the ways to improve a trading strategy by combining properties of well-known indicators and applying them together.
In the next article, I hope to reveal how we can calculate a position of each candle based on data about Moving Averages and indicators derived from them.
The article provides no guarantees that the information contained here will help you in your trading.
Let profit stay with you!
Translated from Russian by MetaQuotes Ltd.
Original article: https://www.mql5.com/ru/articles/10479
Warning: All rights to these materials are reserved by MetaQuotes Ltd. Copying or reprinting of these materials in whole or in part is prohibited.
This article was written by a user of the site and reflects their personal views. MetaQuotes Ltd is not responsible for the accuracy of the information presented, nor for any consequences resulting from the use of the solutions, strategies or recommendations described.
 Learn how to design a trading system by ADX
 Making charts more interesting: Adding a background
 Multiple indicators on one chart (Part 02): First experiments
- Free trading apps
- Over 8,000 signals for copying
- Economic news for exploring financial markets
You agree to website policy and terms of use
I tried to experiment with your indicator MA-Slope-Index-Bin.mq5. I noticed that even in areas where there is a clear downtrend it produces much more positive values than negative. At first I thought the problem was that I was using large MA values, due to which MA turns out to be very sheepish and adding Point()/100 to the numerator and denominator of a small value, which you used, starts to introduce considerable distortions. Tried to decrease it in this way:
It didn't help - the indicator continued giving much more positive values than negative. And then I realized the obvious: dividing minus by minus gives plus. I need to change something in the algorithm to make the indicator correct. I don't know how to do it yet.
It didn't help - the indicator continued giving much more positive values than negative. And then I realized the obvious: dividing minus by minus gives plus. I need to change something in the algorithm to make the indicator correct. So far I don't understand how.
In this case, the obvious (for me) application would be as follows: positive value - just a sharp increase of slope (in the same direction), negative value - sharp change of direction.
If you make it, this indicator, useful for trading on its own, you can, for example, check the previous slope and the current slope before displaying the arrow, and if they coincide, not display the arrow, if they are different - display the arrow of the corresponding colour.
Since I like levels, I just watch how price behaves after a sharp incline jump, say, at Murray or Gann levels (remember, the difference is that Murray suggested dividing significant intervals by 8, while Gann suggested halving or dividing by 3 depending on other incoming ones). That's me for example, pivots and fibs are great too... The main thing - if I see a sudden change in slope at the level - I can assume a reversal.
I'll add a picture to clarify the previous thought :-)
The lilac lines are the times of extremums, by which the salad levels were built (I simply divided the interval in half and put two intervals up and two down (+-100% and +-200%).
Further, on 28.01.2022 there was a signal of a sharp change in the slope. We can see that the main direction of the slope is upwards (either by the main slope indicator [bottom chart] or by the MA-box itself)... That said, price has come up to the level diagonal for the day and has, in fact, bounced off of it. Price is above the MA curve. The main trend is up, but a bounce off the diagonal suggests a correction. Possible trading options:
- either on the opening of the next candle - down with a stop at the maximum of the current candle and a takeout near the curve (MA) or level (1/2);
- or wait for the curve (and the level) to be touched - and then - up with a stop below 24.01.2022 (113.469 according to my data).
The next signal is 04.03.2022. A sharp increase in the slope in the "main" direction, the slope is still up and we can see that the price has been in the 1/2-1 range for a long time. At the same time, the closing price has never broken the 1/2 level. The solution is to trade up, on the opening of the next candle. Stop - below 1/2, take - either at +1/2, or don't put and exit, say, by trawl (one of my favourites - by fractals)...Hello. - Hi! Can you provide a version of MT4 for MA-ATR3*5?