
Multiple indicators on one chart (Part 04): Advancing to an Expert Advisor

Introduction
In my previous articles, I have explained how to create an indicator with multiple subwindows, which becomes interesting when using custom indicators. This was pretty easy to do. But when we try to implement the same functionality in an Expert Advisor, things become a little more complicated since we do not have the tools that we used in a custom indicator. At this point, programming becomes essential: being able to write the correct code to create a subwindow is paramount. Even though this task is not that easy, knowing how to put a subwindow in an EA doesn't involve a lot of coding, just some knowledge of how MQL5 works.
Planning
We already have our custom indicator working, that is, our object class is already functioning, and since this is an object class, we can easily transfer it to other models. However, simply declaring and trying to use the class in our EA won't make things work the same as in our custom indicator, and the reason is that we don't have subwindow capability in our EA. But then the idea came: "What if we use an already compiled and working custom indicator and call it from the EA using the iCustom command? Well, that might actually work since the subwindow is not needed and the command would look like this:
#property copyright "Daniel Jose"
//+------------------------------------------------------------------+
input string user01 = "";                //Used indicators
input string user02 = "";                //Assets to follow
//+------------------------------------------------------------------+
int OnInit()
{
        int m_handleSub;

//... Expert Advisor code ...

        if ((m_handleSub = iCustom(NULL, 0, "Chart In SubWindows\\Chart In SubWindow.ex5", user01, user02)) == INVALID_HANDLE) return INIT_FAILED;
        if (!ChartIndicatorAdd(ChartID(), 0, m_handleSub)) return INIT_FAILED;
//... Expert Advisor code ...

        ChartRedraw();

        return(INIT_SUCCEEDED);
}
//...The rest of the Expert Advisor code ...
This simple code snippet is able to load our custom indicator, although it won't work properly because we don't have a subwindow. In this case, when the code is executed in the EA, the EA will apply our indicator directly in the main window, which means that our chart will be hidden by the templates loaded by the indicator, which is definitely not what we are looking for.
Therefore, our real and main problem is to create a subwindow that can be used so that we can use our already functioning indicator. But why create a subwindow for the subsequent launch of our indicator? It doesn't make sense; it's better to add functionality directly to our EA and thus overcome any limitations that may arise.
Based on this, we need to perform several tasks:
| Task | Purpose |
|---|---|
| 1 => Create a general-purpose indicator. | It allows to create and use the iCustom command without polluting the chart. |
| 2 => Include this indicator into the EA in some way. | This will allow you to transfer the Expert Advisor with full functionality without any problems. |
| 3 => Generate a general object class for the subwindow | Allows adding subwindows via the EA |
| 4 => Get our C_TemplateChart class bound to the window class. | This will allow us to manage the contents of subwindows without changing anything in the already running code. |
Although this may seem hard, the difficulties are solved quite simply. So, let's deal with each of the points.
Implementation: Creating a general-purpose indicator
This part can be solved by creating a completely clean but functional custom indicator code. The code in this case will look like this:
#property copyright "Daniel Jose"
#property version   "1.00"
#property description "This file only enables support of indicators in SubWin."
#property indicator_chart_window
#property indicator_plots 0
//+------------------------------------------------------------------+
int OnInit()
{
        return INIT_SUCCEEDED;
}
//+------------------------------------------------------------------+
int OnCalculate(const int rates_total, const int prev_calculated, const int begin, const double &price[])
{
        return rates_total;
}
//+------------------------------------------------------------------+
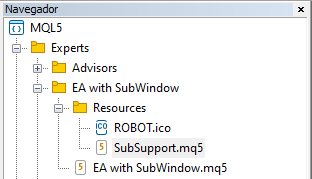
Only this and nothing more. Let's save this file as SubSupport.mq5. But it won't be located together with other indicators — instead let's move it to the RESOURCE directory of our Expert Advisor. So, the file structure will look like in the picture below:
Implementation: Including the general indicator in the EA
To do this, we need to add the following code to the top of our EA.
//+------------------------------------------------------------------+
#define def_Resource "Resources\\SubSupport.ex5"
//+------------------------------------------------------------------+
#resource def_Resource
//+------------------------------------------------------------------+
This will include the compiled code of the general indicator into our EA. Once this is done, the general indicator will have the .ex5 file deleted as it is no longer needed. Now you should pay attention to the fact that if the SubSupport.ex5 file is not found at the time the EA code is being compiled, the compiler will automatically compile the code of the SubSupport. mq5 general indicator and will add this newly compiled executable file to our Expert Advisor. So, if you ever edit the SubSupport.mq5 file and need to add the changes into the Expert Advisor, you should delete SubSupport.ex5; otherwise, the changes will not be added.
This detail is important: sometimes you really need to know how to add newly implemented changes to the resource.
Well, the general indicator is now part of the Expert Advisor, so let's move on to the next task.
Implementation : Creating a subwindow object class
This part is also simple. Here we need to define some points before coding, namely: what features do we really need in this class? Initially, I decided to use the following:
| Function | Description |
|---|---|
| Init | Allows adding subwindows via the EA |
| Close | Allows adding subwindows via the EA |
These functions will not be tested, so I assume that they will only be called once during the lifetime of the EA. But as our EA grows, it's good to think about making it even more practical in the future. Therefore, let's create a new object class called C_Terminal - this class will support a few things related to the graphical terminal. We will learn more about it later. Let's look at the last task, since there is no way to implement the solution partially.
Implementation: C_TemplateChart class inheritance
When I decided to create something new using OOP (Object Oriented Programming), I did this because I already knew that there are big advantages to using this approach, including security and inheritance. There is also polymorphism, but we will use it later when creating a cross-order system. In this particular case we will use one of the advantages of OOP - inheritance. C_TemplateChart is already a fully functional class. Seeing this, you wouldn't want to have the trouble of reprogramming everything again or run the risk of adding code to the class while this would prevent the class from being used in other places. The solution is to use inheritance which allows the addition of new code or function without changing the original code at all.
Using inheritance has a number of advantages, including the following: already tested code remains tested; complexity grows without an equal increase in code size; only new features really need to be tested; what does not change is simply inherited, providing stability. In other words, things improve with minimal effort, but with maximum security. To understand this, let's look at the diagram below.
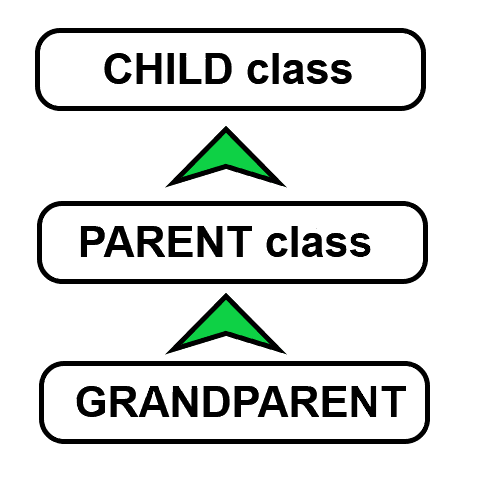
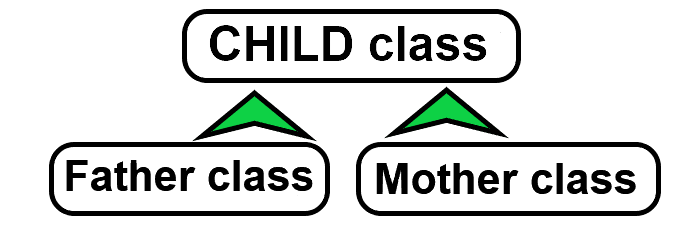
The grandparent class is the most basic class where we have the lowest level of data manipulation, but when the parent class inherits something from the grandparent, all things declared as public in the grandparent class can be seen and used by the parent class. And we can also add new things to the parent class, and this does not affect what is inherited and supported by inheritance. If the parent class is already finished and working, and we want to extend it without changing anything in the classes below, then we create a child class, and it will have all the features of the previous classes. We can also change the way the things work, and that's the interesting thing about inheritance, because these changes will not affect other classes. However, there is a limitation here, unlike C++ which allows multiple inheritance. If a child can inherit functions from both the Father and the Mother side, this is not possible in MQL5. But you still get benefit from the inheritance. An example of multiple inheritance can be seen below:
Okay, but how to do it in MQL5? How to declare an inheritance so that we can take the advantage of it? The most accurate way to understand this is to read the object-oriented programming (OOP) content but here we'll get straight to the point. Inheritance will be done using the following lines:
#include "C_TemplateChart.mqh"
//+------------------------------------------------------------------+
class C_SubWindow : public C_TemplateChart
{
// ... Class code
};
See that the C_SubWindow class will publicly inherit the C_TemplateChart class, so now we can use the C_SubWindow class to access the C_TemplateChart class functionality.
In the above code snippet, I highlighted one thing. Note that it is in quotes ( " ) and not in angle brackets ( < > ) as usual. So why did I do this? Like the C++ language, MQL5 also has some very interesting things, but some things confuse those who are just starting to learn the art of programming. When we place a header file between angle brackets ( < > ), we mean an absolute path — in this case the compiler will follow exactly the path we specified. But when we use quotes (as we did this time), the compiler will use a relative path, or, to make it clearer, it will first start from the current directory where the working file is located. It may seem strange, but there are times when we have the same name for files that have different contents and they are in different directories, but we still want to refer to the current directory, so we use quotes for that.
The two functions that we plan to use earlier, INIT and CLOSE, are shown below:
//+------------------------------------------------------------------+
bool Init(void)
{
        if (m_handleSub != INVALID_HANDLE) return true;
        if ((m_handleSub = iCustom(NULL, 0, "::" + def_Resource)) == INVALID_HANDLE) return false;
        m_IdSub = (int) ChartGetInteger(Terminal.Get_ID(), CHART_WINDOWS_TOTAL);
        if (!ChartIndicatorAdd(Terminal.Get_ID(), m_IdSub, m_handleSub)) return false;

        return true;
}
//+------------------------------------------------------------------+
void Close(void)
{
        ClearTemplateChart();
        if (m_handleSub == INVALID_HANDLE) return;
        IndicatorRelease(m_IdSub);
        ChartIndicatorDelete(Terminal.Get_ID(), m_IdSub, ChartIndicatorName(Terminal.Get_ID(), m_IdSub, 0));
        ChartRedraw();
        m_handleSub = INVALID_HANDLE;
}
//+------------------------------------------------------------------+
See, the code is very simple and short. But there is something we have to be careful about, pay attention to the highlighted part. You must be careful not to make a mistake while adding this part, because if you don't leave it as it is, the SubSupport.ex5 executable file that we asked to be added to the EA will not be visible inside the EA — instead it will be visible outside the EA. For more details, you can read about Resources. But basically, if you use ( :: ), this will indicate that the EA should use the internal resource available inside it. But if we just indicate the name of the resource, the EA will search for it in inside the MQL5 directory, and if the file does not exist at the specified location, the function will fail even if the file was added as an EA resource.
Then, once the resource is loaded, we check the number of subwindows present and add an indicator to that subwindow.
What the code is actually doing can be seen below:
input string user01 = "";               //Used indicators
input string user02 = "";               //Assets to follows
//+------------------------------------------------------------------+
int OnInit()
{
        int m_handleSub;

//...

        if ((m_handleSub = iCustom(NULL, 0, "Chart In SubWindows\\Chart In SubWindow.ex5", user01, user02)) == INVALID_HANDLE) return INIT_FAILED;
        if (!ChartIndicatorAdd(ChartID(), (int) ChartGetInteger(ChartID(), CHART_WINDOWS_TOTAL), m_handleSub)) return INIT_FAILED;

//...

        ChartRedraw();

   return(INIT_SUCCEEDED);
}
//...The rest of the Expert Advisor code ...
Both codes will work the same, but the object class version will allow us to add more things over time, since the version shown above is the consolidated version and won't change. Both versions do the same thing: they create a subwindow from the EA and put all previously created custom indicators in this subwindow. Pay attention to the changes made to the code compared to the code at the beginning of the article - the changes are highlighted in color.
Conclusion
It is very interesting how we decide to follow the path of achieving our goals. Sometimes we can encounter difficulties and think that it is difficult to achieve our goals, but with a little patience and dedication we can overcome obstacles that at first seemed insurmountable. In this article, I demonstrate how you can extend the functionality of a class without having to modify it — through inheritance. At the same time, I show how you can add indicators to charts so that they work as already tested. We add the ex5 program inside our EA and use it without having to port the original ex5 by simply loading the EA.
The attached file contains all the improvements developed so far, but there will be even more interesting things in this code soon. 😁👍
Translated from Portuguese by MetaQuotes Ltd.
Original article: https://www.mql5.com/pt/articles/10241
Warning: All rights to these materials are reserved by MetaQuotes Ltd. Copying or reprinting of these materials in whole or in part is prohibited.
This article was written by a user of the site and reflects their personal views. MetaQuotes Ltd is not responsible for the accuracy of the information presented, nor for any consequences resulting from the use of the solutions, strategies or recommendations described.
 Multiple indicators on one chart (Part 05): Turning MetaTrader 5 into a RAD system (I)
 Learn how to design a trading system by ATR
- Free trading apps
- Over 8,000 signals for copying
- Economic news for exploring financial markets
You agree to website policy and terms of use
New article Multiple indicators on one chart (Part 04): Starting with EA has been published:
Author: Daniel Jose
Hi Daniel, I've been following your articles, but what about Part 03?
There was a small problem at the time of requesting the release for publication, but I have already authorised the publication of Part 03, it will soon be available too, this problem was caused more by the number of articles I have already sent ... there are currently another 15 articles for them to analyse, all of them involved in the development of this EA and with each one things get more and more complex .... but thank you for following the series ... look forward to lots of new stuff from article 05 onwards, from then on it's really going to be worthwhile because it's going to become something big, these first few are just to introduce you to what's to come...😁👍
Hi Daniel,
I am having problems with multicolored indicators and your articles, which I am enjoying, indicate that you might know its solution.
I want to produce a function that sets all of the indicator attributes without using the #property options,e.g. #property indicator_color1 clrCrimson,clrWhite,clrLime
What I am finding in the test program below is that with the #property indicator_color1 clrCrimson,clrWhite,clrLime included, the program works properly whereas if I comment it out, then the program doesn't perform correctly. In this case it seems that it is plotting only some of the data points as if it is using a "higher?" time frame or skipping several data points. I suspect that the property color directive is setting more attributes that I have not identified when multi colors are specified.
The second problem is that I obviously don't understand the details and requirements of using multicolored plots. I have searched the documentation and have not found any articles that provide an overview of how to use multi colored indicators. While the first plot changes color correctly, the second one, plotting the lows, does not change colors according to my function call. This plot requires all three properties: type2, color2, & width2, to operate properly. I am also perplexed why the property declarations use 2 instead of 3. I used Mladen's Laguerre Adaptive Filter indicator to identify that the property indicators use the plot number,2, not the indicator number 3 to display correctly.
Any suggestions, references, or help will be greatly appreciated
Regards, CapeCoddah
Hi Daniel,
I'm having problems with multicolored indicators and your articles, which I'm enjoying, indicate that you might know your solution.
I want to produce a function that sets all indicator attributes without using #property options eg #property indicator_color1 clrCrimson,clrWhite,clrLime
What I'm finding in the test program below is that with the #property Indicator_color1 clrCrimson,clrWhite,clrLime included, the program works correctly, whereas if I comment it out, the program doesn't work correctly. In this case, it looks like it's only plotting some of the data points as if it were using a "larger?" time period or skipping multiple data points. I suspect the property's color directive is defining more attributes that I haven't identified when multiple colors are specified.
The second problem is that I obviously don't understand the details and requirements of using multicolor graphics. I searched the documentation and didn't find any articles that provide an overview of how to usemulticolored indicators . While the first graph changes color correctly, the second one, tracing the low points, doesn't change color according to my function call. This graphic requires all three properties: type2, color2, and width2, to work properly. I'm also puzzled why property declarations use 2 instead of 3. I used Mladen's Laguerre Adaptive Filter indicator to identify that property indicators use chart number 2, not indicator number 3 to display correctly.
Any suggestions, references or help will be greatly appreciated.
Sincerely, CapeCoddah
You're a little confused, I can understand... but all the confusion is in the fact that you're not actually looking at the details in your code. I'll try to explain some of the details that are in the comment, then I'll talk a little about your code....
The first point is that you can even produce a multicolored indicator without using #property indicator_colorN but for the user and even for you it is more practical, safer and simpler to understand and modify the code, because all you have to do is going to the properties is to modify the colors present there, and for the user it is simpler because he will only have to choose the color to be modified and make the change, this in the standard window that MT5 creates for the indicators. You are somehow already doing the right thing when using the PlotIndexSetInteger command to generate the color changes, and this is the way when we don't use #property indicator_colorN , but when we use the properties it often doesn't make sense to use the PlotIndexSetInteger command to set other colors, this is because the thing can be more complicated to maintain and more confusing for the user, since he may not really understand what the color standard is trying to say, even if the code is yours and you will be the the only one to use the indicator, it doesn't make much sense, unless in rare cases you create a dynamic color pattern.
Now about the second point: The problem in this case is that you are confusing the number of things that the indicator will plot ( 2 for 2 lines ) with the object properties ( in this case line ) and for the line to be plotted, you actually need to declare at least 3 pieces of information, which are TypeN, ColorN, WidthN , where the N indicates the number of the object, with practice and time you will end up understanding these small differences between the indicator property and the properties of the objects he uses... Don't give up... keep studying and soon things will become clearer... 😁👍
Now let's see some of your code... I'm not going to show you exactly how to fix it (if I do this it won't be fun... .... 😁👍✌ ) I want you to pay attention to the following fact, and this is important:
Note that I marked two things in your code... now let's see what is happening when it is played on the graph....
See that only one of the labels is as you declared in the code, only the HIGH .... and the LOW ?!?! where is she ?!?! this is the first point you should correct, because the fact that the LOW tag is not being shown indicates that the color pattern being used is what is declared in #property indicator_color2 , that is, you have a failure at this point , if you try to remove the properties of indicator 2 that actually create the LOW line, even keeping the rest of the code, the HIGH line will be plotted, but the LOW line will not....why?!?! because in fact you are not defining the information necessary to plot the LOW line, this dynamically via the use of the PlotIndexSetInteger call ... it seems strange .. but this is what is happening ....
When you manage to fix this, if you really want to use the dynamic way of declaring the data of the row object using PlotIndexSetInteger, you will be able to remove the #property indicator_color compilation commands from the scene, as the necessary data will be set dynamically, but if you don't want to make such an effort, that's fine....
Now I want you to look at the image above and compare it with the colors you are using in #property indicator_color ... watch these colors very carefully .... if you do this you will notice something strange there .... again I won't say not to lose the fun, but try to use different colors, without repeating any of them... when you repeat them it gets harder to understand where the mistake is... 😁👍
Now one last detail: The fact that you think he is plotting only some points and skipping others can be for two reasons: The color pattern is not contrasting with the background of the graph, try to use colors that contrast with the background of the graph, and the second, but I don't believe it is actually the case, is that there may be a failure in the OnCalcule event, you are returning -1 or the value of i, the correct thing is to return rates_total, so change this in the code to avoid problems futures...
Hi Daniel,
I was confused. I thought the drawing characteristics were defined using the buffer specification like MQ4 whereas, for at least DRAW_COLOR... specifications the drawing characteristics are defined using the sequential plot identifier. I have not determined if the DRAW_LINE etc also require plot specifications. Moreover, the indicator_colorX property actually has two functions, first to count and set the number of colors and then to set each specified color into its proper array position. I am attaching two files, Color Test which is now operating correctly although, it requires more refinements, secondly MLADEN's MACD Original2_1 slightly modified. Mladen's program is interesting as he had defined two plots but only uses one color index buffer.
Thanks for your assistance