• 概述
  • 评论
  • 评论
  • 新特性

Jurik Advanced MA

The Jurik Advanced MA (JurMA) is a non-repaint technical indicator developed over the original JMA concepted by Mark Jurik. 

It is designed to reduce lag present in traditional moving averages, improve smoothness, and reduce noise. JurMA adapts to market volatility and can be fine-tuned by the user for sensitivity, making it useful for identifying trends and reversals in financial markets. This adaptability and efficiency make it popular among traders and analysts.

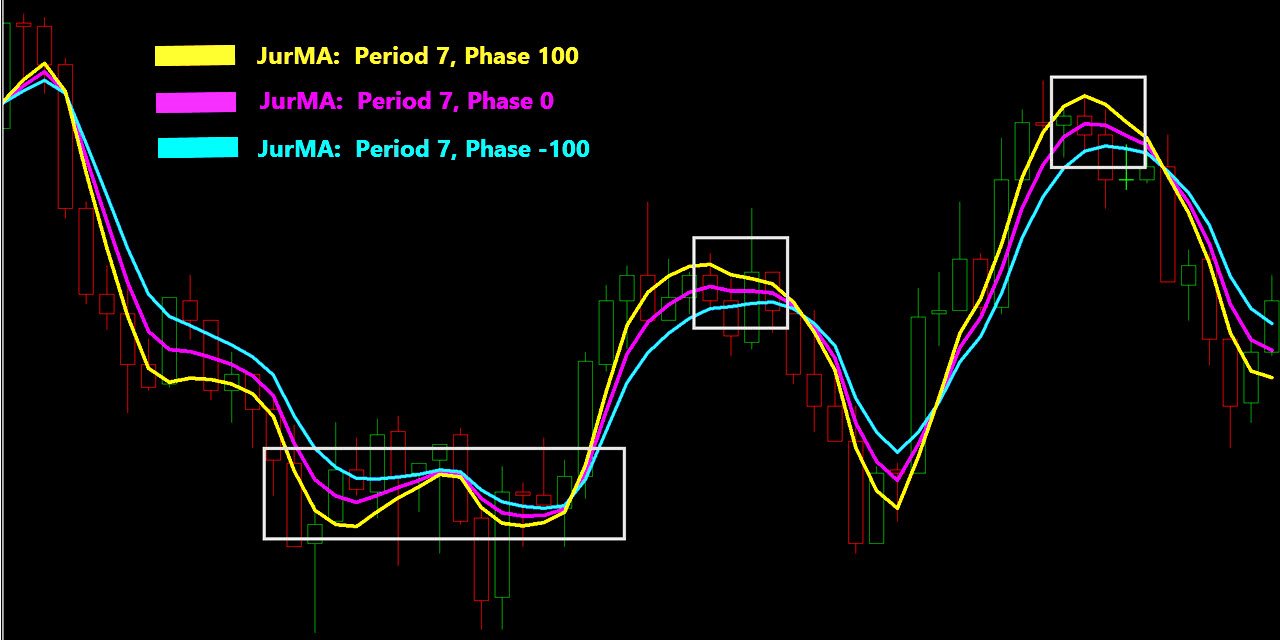
In the wide context of other technical indicators, "sensitivity" refers to how quickly the indicator responds to changes in price data. It's not about the count of candles, but rather how the indicator interprets price movements over a given period (more or less responsiveness). JurMA offers the PHASE feature parameter to adjust this indicator's behavior, particularly in terms of "the quality of the transitional process". It is important to understand, that PHASE is not related to the "smoothness" of a line, but a direct way to interact with the Jarik's formula in the average calculation (good for filtering noise).

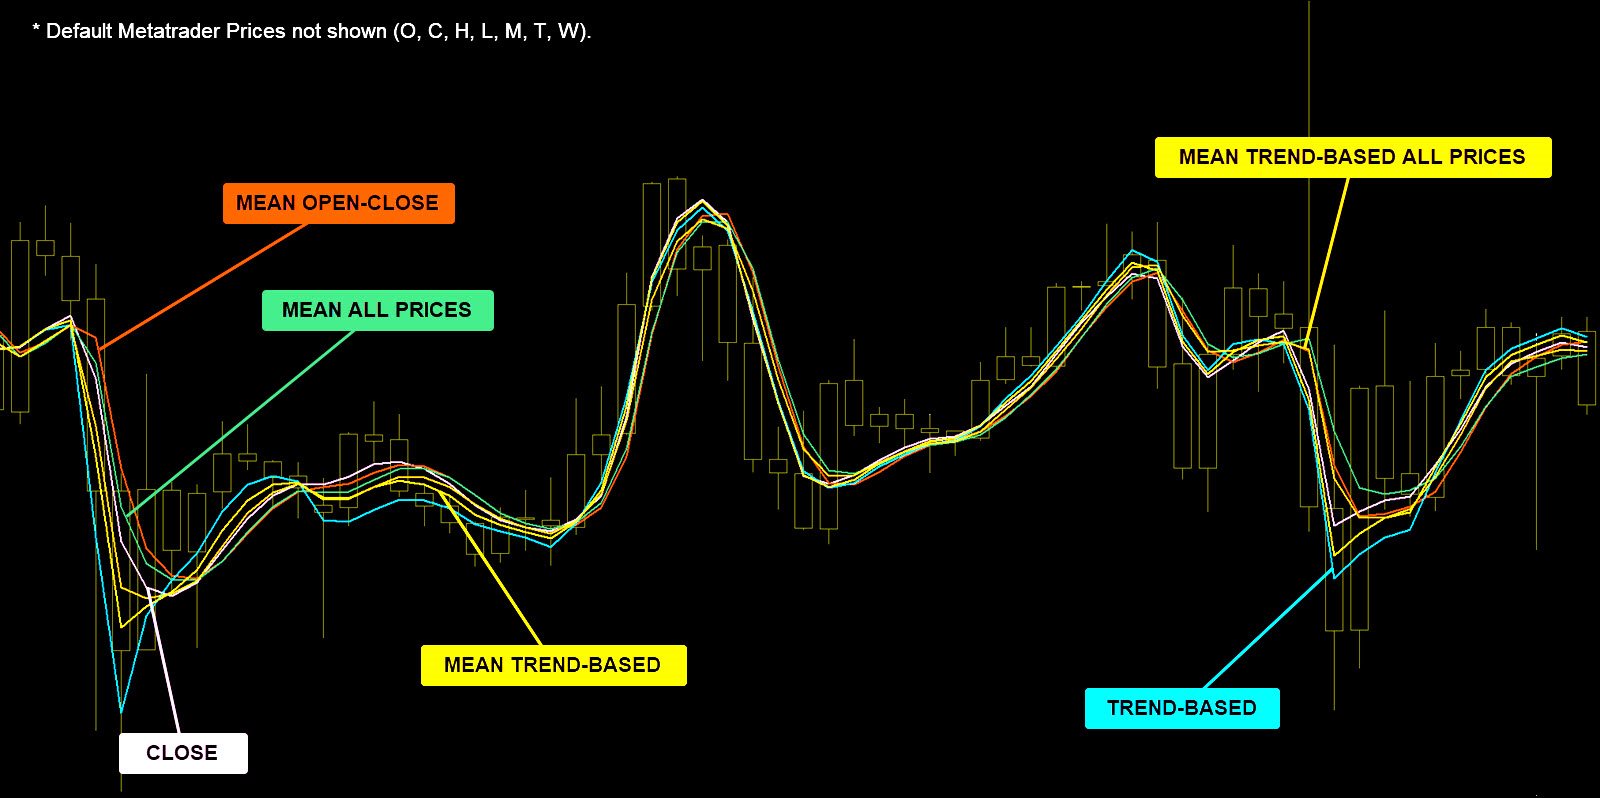
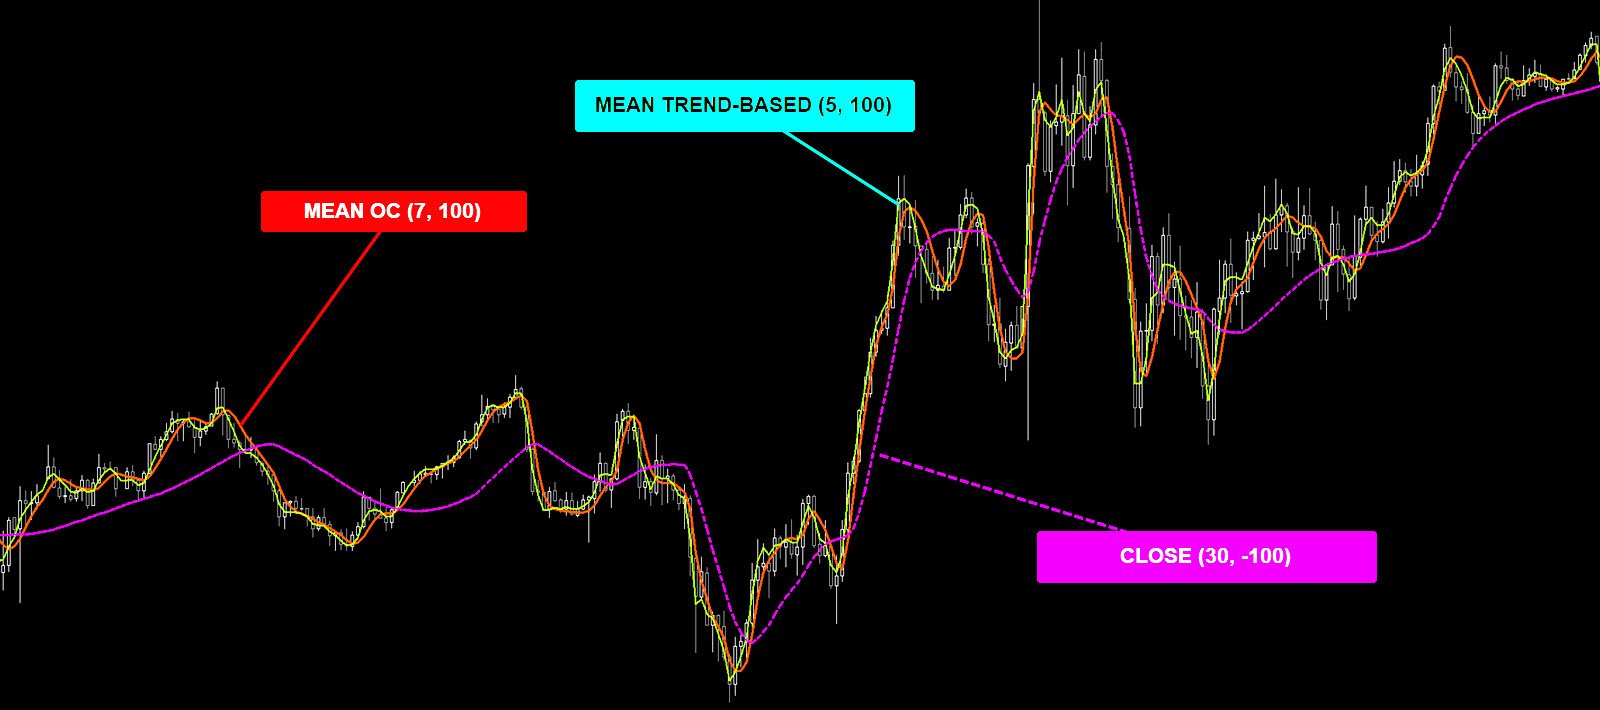
Additionally, JurMA provides a diverse range of pricing options for computations that augment the standard price calculations inherent in the MetaTrader platform:

⦁ Default prices (Close, Open, High, Low, Median, Typical, Weighted);

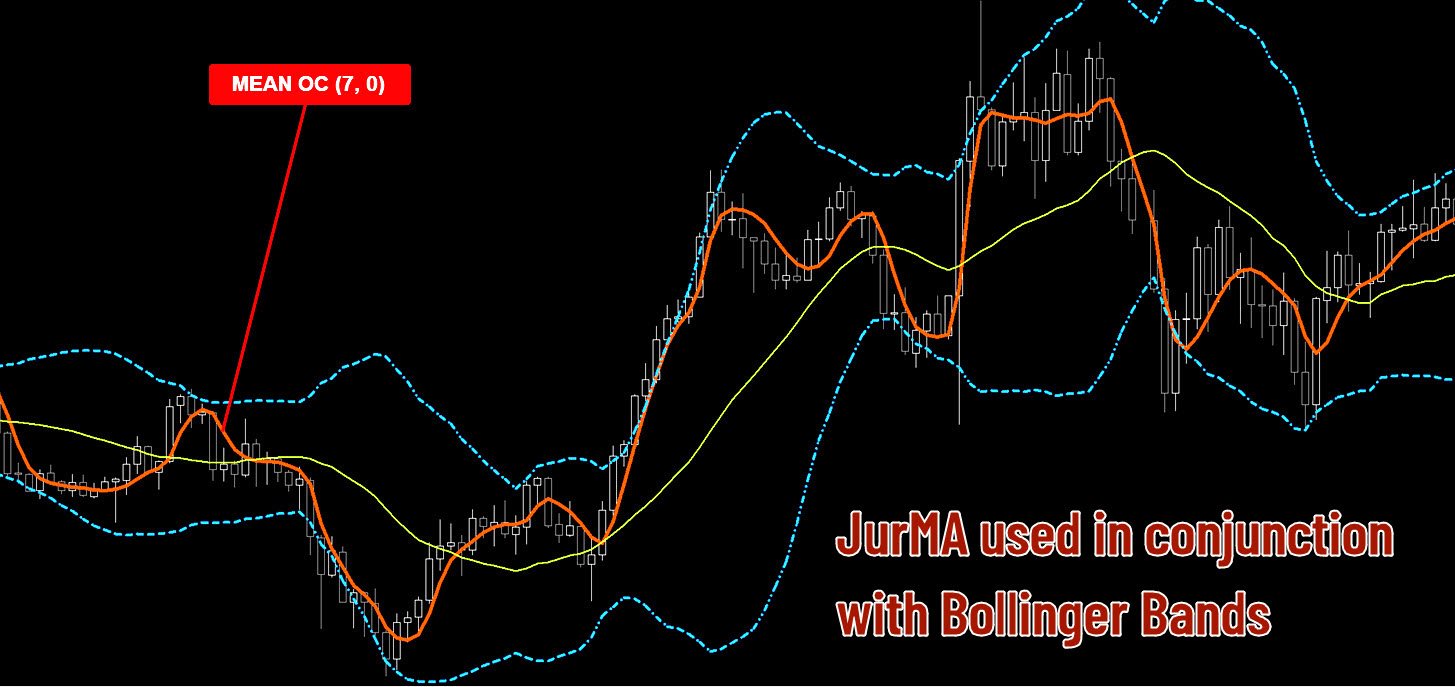
⦁ Mean Open-Close (O+C/2);

⦁ Mean All Prices (O+C+H+L /4);

⦁ Trend-Based (High for Bull candle, Low for Bear candle, Close otherwise);

⦁ Trend-Based Mean: (H+C/2) for Bull candle, (L+C/2) for Bear candle, Close otherwise.;

⦁ Mean Trend-Based All Prices Weighted.

Features

⦁ Non-Repaint Adaptive Jurik's Moving Average, optimizing the identification of consistent trends.

⦁ PHASE and PERIOD parameters for total customization for any Asset and timeframe.

⦁ Faster average calculation than iMA() and other Metatrader's Technical Indicators

⦁ 12 different price calculations (7 Metatrader Default + 5 custom calculations).

⦁ Allows you free changing the style, color, and width of its line.

⦁ It can be used with any ASSET and TIMEFRAME.

⦁ Accepts its incorporation into "Expert-Advisor" via iCUSTOM call.
推荐产品
Gecko EA MT5
Profalgo Limited
5 (1)
NEW PROMO: Only a few copies copies available at 349$ Next price: 449$ Make sure to check out our " Ultimate EA combo package " in our   promo blog ! Gecko runs a simple, yet very effective, proven strategy.  It looks for important recent support and resistance levels and will trade the breakouts.  This is a "real" trading system, which means it will use a SL to protect the account.  It also means it will not use any dangerous techniques like martingale, grid or averaging down. The EA shows its
Gold Crazy EA MT5
NGUYEN NGHIEM DUY
Gold Crazy EA   is an Expert Advisor designed specifically for trading Gold H1/ EU M15. It use some indicators to find the good Entry. And you can set SL or you can DCA if you want. It can be an Scalping or an Grid/ Martingale depend yours setting. This EA can Auto lot by Balance, set risk per trade. You also can set TP/ SL for earch trade or for basket of trade. - RSI_PERIOD - if = -1, then the default strategy works, if >0, then the RSI strategy works - MAX_ORDERS - to trade with only 1 order,
Stormer RSI 2
Ricardo Rodrigues Lucca
This strategy was learned from Stormer to be used on B3. Basically, 15 minutes before closing the market, it will check RSI and decided if it will open an position. This strategy do not define a stop loss. If the take profit reach the entry price it will close at market the position. The same happens if the maximal number of days is reached. It is created to brazilian people, so all configuration are in portuguese. Sorry Activations allowed have been set to 50.
Pattaya GT
Konstantin Stratigenas
Why Pattaya GT? With Pattaya GT you see what happens. No black box trading, but full insight. All indicators and values calculated by the artificial intelligence are visible on the chart in real time. This gives traders full control. With four indicators and three timeframes as well as two separate channels for long and short, machine learning can precisely capture the current market situation. The system is trained to trade at the safest possible times. Parameters such as time, long or short,
Pare de seguir as "sardinhas" e comece a operar como big player, de forma automática. O robô Imbalance Autotrader é a mais recente tecnologia de trade que monitora os big players (grandes investidores) do mercado financeiro. Com estratégia de rompimento ( breakout ) ou pullback (Fair Value Gap FVG e Order Block) , você consegue configurar o robô para o ativo, conforme condições que você deseja operar. Além disso, o robô pode ter stops configuráveis, dinâmicos ou fixos. Na questão de gerenciamen
Manyal trading system, CovEchoTrend Robot, focuses on reliability and flexibility. By employing statistical analysis methods to study the relationships between the base indicator and market patterns, the system enables a deeper understanding of market processes. Intelligent pattern analysis: The application of statistical data processing helps identify key trend reversal points more accurately, signaling significant market shifts. Informed decision-making is based on the intersection of indicato
TPO Profile MT5
Kyra Nickaline Watson-gordon
Definition : TPO is a Time Price Opportunity. Instead of using bars or candles with an Open, High, Low, and Close price, each "bar" in a Market Profile is represented by horizontal bars against the price It is called Market Profile terminology. In other words time-price-opportunity (TPO) profiles are histograms of how much time was spent at each price within the span of the profile. By using a TPO chart, you are able to analyze the amount of trading activity, based on time, for each price level
ArcturusFX MT5
Fernando Jose Anton
ArcturusFX 手册: https ://www .mql5 .com /en /blogs /post /760580 推荐交易品种: GBPUSD - 时间框架: 5M 交易配置: 保守配置 - 对冲交易: https ://c .mql5 .com /6 /965 /Conservative_Hedge_Setup_- GBPUSD -_5M .ini 中等激进配置 - 对冲交易: https ://c .mql5 .com /6 /965 /Medium_Aggressive_Setup_- GBPUSD -_5M .ini 高激进配置 - 对冲交易: https ://c .mql5 .com /6 /965 /High_Aggressive_Setup_- GBPUSD -_5M .ini 保守配置(不进行对冲交易): https ://c .mql5 .com /6 /965 /Configuration_Without_Hedging_- GBPUSD -_5M .ini 当前价格: $49.99 – 价格将根据已售出许可证数量进行调整 – 最终价格: $
Robo davi I
Lucas Silvino Da Silva
Robô Davi I by Êxodo Capital is a professional system for traders created for the MT5 platform and optimized to work with MINI FUTURE INDEX (WIN) at B3 in BRAZIL. The system uses bias algorithms. After identifying the trend, the position is opened and the robot conducts the trade through a trailing stop that will be driven by the 13-period average. Maximum GAIN of 2200 pts. Main features Our setup has the option to use martingale, the EA has the option to customize. Presentation in the grap
The Inside Bar e one is a reversal/continuation candle formation, and is one of the most traded candle patterns. Robot F1 allows you to configure different trading strategies, Day Trade or swing trade, based on the Inside Bar as a starting point.  This pattern only requires two candles to perform. Robot F1 uses this extremely efficient pattern to identify trading opportunities. To make operations more effective, it has indicators that can be configured according to your strategy. Among the o
My Gold
Antonio Simon Del Vecchio
介绍My Gold:黄金市场专家顾问 My Gold是一个专为黄金市场(XAUUSD)设计的专家顾问。这个EA的特点是能够利用趋势中的回调并通过智能追踪止损捕捉强劲的动态。 要下载更新的设置文件和额外的策略,请点击  这里 关键特性 Magic Number: 操作的唯一标识符。 Initial Lot: 定义初始仓位大小。 Auto Lot: 基于参考余额自动计算仓位大小。 Referential Balance: 计算仓位大小的余额。 Stop Loss in Points: 止损水平。 Take Profit in Points: 止盈水平。 Period for Highs and Lows (H1): 用于识别一小时图表中的高点和低点的周期。 Period for the SMA (H1): 简单移动平均线的周期。 Trailing Factor: 智能追踪止损的关键因素。 A Factor, B Factor, C Factor: 策略中特定调整的因素。 Martingale Factor: 在亏损后调整仓位大小的马丁格尔因子。 其最突出的特点是它的 智能追踪止损 。这
Long Short Forex MT5
Rafael Gazzinelli
Long & Short EA for Forex - MetaTrader 5 Link to understand how parameterization and the control panel work: mql5.com/pt/blogs/post/759824 This Expert Advisor (EA) was developed to perform Long & Short operations in the Forex market through MetaTrader 5, capable of operating in both Day Trade and Swing Trade formats. It automates the identification of trading opportunities between two currency pairs (Symbol 1 and Symbol 2), exploiting price variations between them. The EA uses a series of parame
Stability Pro MT5
Profalgo Limited
5 (3)
推出促銷活動: 只需 34 9 美元,而不是 990 美元! 此促銷價僅剩幾本! 請務必在我們的促銷博客中 查看我們的“ 終極 EA 組合套餐 ”   !   JOIN PUBLIC GROUP:   Click here 實時結果低風險 實時結果高風險 歡迎使用 STABILITY PRO :市場上最先進、穩定、低風險的網格系統之一! 該 EA 已對其使用的外匯對的完整可用歷史記錄進行了壓力測試。 在這些壓力測試中,從 2007 年至今,EA 每個月都盈利,如下面的屏幕截圖所示。 EA 使用先進的 SVG 算法(智能可變網格),該算法不會以固定距離添加網格交易,而是會分析市場走勢以確定網格位置。 我付出了很多努力來為這個 EA 獲得良好的風險/回報比和強大的恢復係數。 因此,您有多種方法來控制風險和回撤,並且 EA 將從任何潛在損失中快速恢復。 為了防止帳戶崩潰,有多種方法可以在每個網格上放置“最壞情況”SL。 範圍從基於最大歷史回撤的止損,到更嚴格的止損以防止重大損失。 這些只是“最壞的情況”,SL 是為了防止市場上大多數 EA 經歷的高額淨值虧損或賬戶崩潰。 所有模式都很
Holeshot MAX
Carter Kyle Capital Inc.
Holeshot Max – 您的终极交易伴侣 Holeshot Max 不仅仅是另一种交易工具;它也是一种交易工具。它是一个复杂的盟友,旨在帮助各个级别的交易者轻松征服市场。 Holeshot Max 基于强大的 Metatrader 5 平台构建,配备了自定义股权管理系统,将控制权牢牢掌握在您手中。告别压力和不确定性——通过 Holeshot Max,您可以无忧地进行交易,因为您的风险承受能力和行为可以完全根据您的喜好进行定制。 但是什么让 Holeshot Max 与众不同呢?其卓越的成功率足以说明一切——准确率高达惊人的 90%。想象一下,当您拥有如此强大的工具时,会产生怎样的可能性。 多功能性是当今充满活力的市场的关键,而 Holeshot Max 确实能做到这一点。凭借 8 个自定义预设,该专家顾问只需单击一下按钮即可在剥头皮、波段交易或混合策略之间无缝转换。受制于单一方法的日子已经一去不复返了——Holeshot Max 可以毫不费力地适应不断变化的市场条件,确保您能够充分利用遇到的每一个机会。 体验 Holeshot Max 的不同之处——您无忧、成功交易的门
Holeshot Max MT5
Carter Kyle Capital Inc.
Holeshot Max – Your Ultimate Trading Companion Holeshot Max is not just another trading tool; it's a sophisticated ally designed to empower traders of all levels to conquer the markets with ease. Built on the powerful Metatrader 5 platform, Holeshot Max is equipped with a custom equity management system that puts the control firmly in your hands. Say goodbye to stress and uncertainty – with Holeshot Max, you can trade worry-free, knowing that your risk tolerance and behavior are fully customizab
Urgently mt5
Tatiana Savkevych
The Urgently indicator is designed to quickly determine the situation in the market, reflect the state of the market and signal profitable levels for opening trades. Market conditions change quickly enough, requiring constant calibration of trading strategies. Recommended for use in conjunction with any of the oscillators. The Urgently forex market trend indicator shows the trend direction and entry points. It smooths out price fluctuations when generating a signal by averaging the data and the
ISing
Yury Smagin
EA 的工作原理是價格與平均值的最大偏差。 這個想法是價格總是力求平衡, 與平均值的任何大偏差都會導致相互作用力 - 反作用力。 入口是在這些偏差上進行的。 这是这个顾问的一个信号示例 https://www.mql5.com/en/signals/2047087 (如果愿意,您可以进行更保守的交易)。 選項: sigal_deviation - 交易開始後的最大偏差; 過濾器: closeBarOnly - 僅在柱線關閉時工作,僅在柱線關閉後打開和關閉交易; waitFastMovement - 等待快速下降或下降。 N 是秒數,0 表示禁用。我們僅在從最小值或最大值的形成開始經過 N 秒後才進入。有助於防止在即時價格變動期間進入; oneOrderInDay - 每天只有一筆未平倉交易。有助於降低白天價格突然變化的風險; onlySwapPlus - 僅在正交換的方向上工作。建議選擇在任一方向具有正掉期的經紀商。 由於顧問的工作中也使用了對沖算法,因此某些交易可能會長時間保持開放狀態; sepatateBuyAndSell - 用於計算買賣的單獨算法; minimu
Visual Range Directional Force Indicator
AL MOOSAWI ABDULLAH JAFFER BAQER
Range Directional Force Indicator – Designed for You to Optimize! The Range Directional Force Indicator is a cutting-edge tool designed to empower traders by visualizing market dynamics and directional strength. Built to offer insights into market trends and reversals, this indicator is an invaluable asset for traders seeking precision in their strategies. However, it is important to note that this indicator is not optimized , leaving room for you to tailor it to your unique trading preferenc
Scalp Breakout mt5
Vitalii Zakharuk
The Expert Advisor ( Scalp Breakout ) can be launched on any hourly period, on any currency pair and on the server of any broker. Unique trading system! It is recommended to work with liquid Forex pairs, with a low spread and use VPS. You can start using it with $ 100 and 0.01 lot. The bot works on both Netting and Hedging account types. There is also a version for MT4 . This is high frequency trading. Uses two trading options: with virtual and real stop losses. Virtual stop levels (take profi
Outro
Manuel Gonzales
" Outro " is an expert in automated " multi-symbol " trading that requires the trader to test on the pair of his choice and modify the entries according to his convenience. This Expert Advisor has been designed with non-optimized inputs, and   uses a Martingale system   for risk management. It is very important to read the   blog   post before you start. Enter to the private group .  Outro   uses two main indicators,   Relative Strength Index and Stochastic Oscillator , for input decision making
FREE
Reversal Composite Candles
MetaQuotes Ltd.
3.57 (14)
该系统的思路是通过计算复合蜡烛来识别反转形态。 反转形态类似日本蜡烛条分析的 "锤头" 和 "吊颈" 形态。但它使用符合蜡烛替代单一的蜡烛,并且不需要复合蜡烛的小实体来确认反转。 输入参数: Range - 最大柱线数量, 计算复合蜡烛时用。 Minimum - 最小复合蜡烛大小 (传统的点数)。 ShadowBig and ShadowSmall - 影线 (复合蜡烛单元)。 Limit, StopLoss and TakeProfit - 开盘价, 止损位和止盈位, 它们是相对于复合蜡烛的收盘价 (复合蜡烛单元)。 Expiration - 订单过期时间 (单位柱线), 用于挂单 (Limit!=0.0)。 反向蜡烛条形态的判别如下。 它计算复合蜡烛参数,其自最后的完整柱线 (索引为 1) 至由 Range 输入参数定义的柱线数量。如果复合蜡烛大小大于由 Minimum 输入参数指定的数值, 它分析复合蜡烛的影线检测反转条件。 空头能量的特征是复合蜡烛的上影线为零, 多头能量的特征是复合蜡烛的下影线为零。 为确认空头趋势反转 (且多头开始),需要以下检查: 下影线的大小 (多头能量
FREE
This indicator builds upon the previously posted Nadaraya-Watson smoothers. Here we have created an envelope indicator based on Kernel Smoothing with integrated alerts from crosses between the price and envelope extremities. Unlike the Nadaraya-Watson estimator, this indicator follows a contrarian methodology. Please note that by default this indicator can be subject to repainting. Users can use a non-repainting smoothing method available from the settings. The triangle labels are designed so
FTrend3
Sonia Tait
Este EA combina a tendência do tempo gráfico principal com mais dois tempos gráficos configuráveis. Os stops são técnicos baseados na técnica dos canais OffRoad. Ao executar otimizações, é interessante buscar as combinações de tempos gráficos que corroboram para um bom resultado para cada ativo e seu comportamento. Estudos apontam para resultados mais assertivos quando os testes são feitos nos últimos meses para operar no próximo. O período do ADX e das bandas de Bollinger também podem variar co
当然可以!以下是您提供的文本的中文翻译: 引入   MT4 / MT5 天文指标:您的终极天体交易伙伴 您准备好将交易体验提升到天文高度了吗?不用再寻找,就在我们的革命性 MT4 天文指标中。这个创新工具超越了传统的交易指标,利用复杂的算法提供无与伦比的天文洞察力和精确计算。 指尖上的宇宙信息:   瞻仰一个详尽的面板,展示了一宝藏般的天文数据。了解行星的地理/太阳心坐标,太阳/地球距离,亮度,伸长度,星座,黄道和赤道坐标,甚至是水平坐标——每个细节都经过精心计算并呈现得美轮美奂。指标生成的垂直线对应于时间值,为您的交易旅程提供了宇宙的视角。 行星线条与关系:   在您的图表上欣赏行星线条的魔力,具有可自定义的比例和角度。通过直观的控制面板轻松切换每个行星线条的可见性。通过连结、六分、四分、三分、对冲和逆行等指标,发现行星关系的艺术。在您选择的时间范围内探索这些宇宙构造,使您能够识别重要的交易机会。 揭示甘恩的智慧:   通过受甘恩启发的平方垂直线揭示潜在的反转时机。这种创新修改将甘恩历经考验的原则带入现实,帮助您提前了解市场的转向和趋势。 月亮引导:   在您的图表上优雅地导航月相,
Descubra o EA para Mini Índice, o segredo do sucesso no mercado financeiro! Desenvolvido com anos de observação cuidadosa, este EA utiliza sinais exclusivos de entrada e saída para garantir resultados impressionantes. Prepare-se para uma jornada lucrativa! Graças a dois indicadores poderosos, cuidadosamente configurados (e forneceremos as configurações exatas), este EA oferece resultados excelentes. Imagine maximizar sua taxa de acerto e o payoff, enquanto mantém um baixo drawdown. Sim, é possí
Matrix Arrow EA MT5
Juvenille Emperor Limited
5 (5)
Matrix Arrow EA MT5   是一款独特的智能交易系统,可以通过图表上的交易面板手动或 100% 自动交易   Matrix Arrow Indicator 的 MT5   信号。   Matrix Arrow Indicator MT5   将在其早期阶段确定当前趋势,从多达 10 个标准指标中收集信息和数据,它们是: 平均定向运动指数 (ADX) 商品渠道指数 (CCI) 经典 Heiken Ashi 蜡烛 移动平均线 移动平均收敛散度 (MACD) 相对活力指数 (RVI) 相对强弱指数 (RSI) 抛物线SAR 随机振荡器 威廉姆斯的百分比范围 当所有指标给出有效的买入或卖出信号时,相应的箭头将打印在图表上,在下一个蜡烛/柱线的开盘时表示强劲的上升趋势/下降趋势。用户可以选择使用哪些指标,并可以单独调整每个指标的参数。使用   Matrix Arrow EA MT5 ,您可以直接从图表上的交易面板手动交易   Matrix Arrow Indicator MT5   信号,或使用 100% 算法交易选项   100% 自动交易! 注意力:   如果您想用您的  
AutoSignals Trend Panel
Danilo Maia Siqueira
指標基於每個圖表時間的6個信號,跟踪同一資產的5個不同圖表時間的趨勢。 該指標的主要目的是向我們展示放置該金融資產的多數趨勢。 系統在數個圖形時間中傳輸趨勢信息,這樣用戶可以廣泛查看資產的移動,這種工具通過幫助操作員執行訂單使用戶具有較高的命中率 支持趨勢。 指标基于每个图表时间的6个信号,跟踪同一资产的5个不同图表时间的趋势。 该指标的主要目的是向我们展示放置该金融资产的多数趋势。 系统在数个图形时间中传输趋势信息,这样用户可以广泛查看资产的移动,这种工具通过帮助操作员执行订单使用户具有较高的命中率 支持趋势。 Zhǐbiāo jīyú měi gè túbiǎo shíjiān de 6 gè xìnhào, gēnzōng tóngyī zīchǎn de 5 gè bùtóng túbiǎo shíjiān de qūshì.
ToTheMoon MT5
Daniel Moraes Da Silva
5 (2)
ONE OF THE FEW ROBOTS WITH A SIGNAL HISTORY OF MORE THAN 3 YEARS AND AMONG THE TOP 10.   LINK TO MY ROBOTS AND SIGNAL PRESETS: In my profile there is a link to download the PRESETS that I use in my SIGNALS, you can download and backtest for free, there are explanations in the README MANUAL. https://www.mql5.com/en/users/tec_daniel   SOME EXAMPLES OF SIGNALS ON “mql5.com” BEING TRADED BY THE ROBOT, ALL MY SIGNALS ARE TRADED BY THE ROBOT, I ONLY CHANGE PRESET SETTINGS: https://www.mql5.com/en/user
ICT Silver Bullet Master
Angel Claude Charles Geoffroy
Of course! Here is the English translation of your trading algorithm description: --- ### Silver Bullet ICT Trading Robot Description **Discover a new era of trading with our automated trading robot, based on the renowned Silver Bullet strategy by ICT (Inner Circle Trader).** #### **Why Choose Our Trading Robot?** 1. **Proven Performance**: The Silver Bullet strategy by ICT is recognized for its consistent results and ability to identify high-probability trading opportunities. Our trading
Luna AI Pro MT5
Profalgo Limited
5 (1)
推出促销活动: 仅售 1 份,售价 399 美元 最终售价:2000$ 该 EA 的销售数量有限 借助市场上最先进的“均值反向”交易机器人 Luna AI Pro EA   ,释放人工智能的力量,将您的交易提升到前所未有的高度。 这个尖端的人工智能驱动系统旨在满足经验丰富的交易者和初学者的需求,配备了广泛的功能来优化您的交易策略并最大化您的利润。 使用 Luna AI Pro 释放您交易策略的全部潜力。 拥抱交易的未来,让先进的人工智能彻底改变您的投资之旅。 体验当今人工智能的力量,加入全球成功交易者的行列。 为什么这个 EA 与众不同: OneChartSetup -> 运行 1 个图表中的所有货币对 个人表现监控:如果表现不佳,每对货币对的风险将自动降低,如果再次盈利,风险将再次增加。 不使用有风险的交易技术,如鞅、网格或具有非常宽止损的交易等 严格的贸易和风险管理 经过验证的真实账户跟踪记录:已经运行一年多 没有虚假/操纵的回测 实时结果(低风险):    https ://www.mql5.com/en/signals/1502590 设置 EA:    https:
该产品的买家也购买
TPSpro RFI Levels MT5
Roman Podpora
4.53 (19)
指示       俄罗斯 -        英语   建议 与指示器一起使用     -       TPSpro 趋势专业版 -   MT4版本       交易中的一个关键要素是做出买卖交易工具决定的区域或水平。尽管主要参与者试图隐藏他们在市场中的存在,但他们不可避免地会留下痕迹。我们的任务是学习如何识别这些痕迹并正确解释它们。 主要功能: 向卖家和买家显示活跃区域! 该指标显示所有正确的初始买入和卖出脉冲水平/区域。激活这些水平/区域后,开始寻找切入点,水平会改变颜色并填充特定阴影。此外,还会显示箭头,以便更直观地了解情况。 显示更高时间范围内的级别/区域(MTF 模式) 添加了使用更高时间间隔显示级别/区域的功能。此外,该指标还具有自动趋势检测功能(   TPSproTREND PRO   )。 用于交易的单独专业的逐步算法。 该算法专为日内交易而设计,既可顺势交易,也可逆势交易。每个活动模板均提供详细说明。 适用于多种时间范围 。 TPSpro RFI 水平指标可用于图表上的任何时间范围,从一分钟(M1)开始一直到每月(MN)。 图形和声音警报。 该指标提供图形和声音指示,
TPSproTREND PrO MT5
Roman Podpora
4.69 (16)
Entry Points Pro for MT5
Yury Orlov
4.46 (130)
这款指标用于 MT5,可提供准确的入场交易信号,且无重绘。 它可应用在任何金融资产:外汇、加密货币、贵金属、股票、指数。 它将提供极其精准的评估,并告诉您何时开仓和平仓的最佳时机。 观看 视频 (6:22),其中包含一个仅处理单一信号的示例,该信号即可值回指标购价! 大多数交易者在 Entry Points Pro 指标的帮助下,在第一个交易周内即改善了他们的交易结果。 订阅我们的 Telegram 群 ! Entry Points Pro 指标的益处。 入场信号无重绘 如果信号出现,并得到确认,则它不会再消失;不像是重绘指标,它会导致重大的财产损失,因为它们可以在显示信号后再将其删除。 无差错开仓 指标算法可令您找到入场交易(买入或卖出资产)的理想时机,从而提高每位交易者的成功率。 Entry Points Pro 可操作任何资产 它允许您在 MT5 平台上交易任何经纪商的加密货币、股票、贵金属、指数、大宗商品和货币。 提供任何方向的信号 Entry Points Pro 指标提供针对任意价格走势的入场交易信号 - 上涨、下跌或横盘(横向)。 最大盈利潜力 离场信号
Quantum TrendPulse
Bogdan Ion Puscasu
5 (13)
介绍 Quantum TrendPulse   ,这是一款终极交易工具,它将 SuperTrend   、   RSI 和 Stochastic 的强大功能整合到一个综合指标中,以最大限度地发挥您的交易潜力。该指标专为追求精准和效率的交易者而设计,可帮助您自信地识别市场趋势、动量变化以及最佳进入和退出点。 主要特点: 超级趋势整合: 轻松跟随当前的市场趋势并乘上盈利浪潮。 RSI 精度: 检测超买和超卖水平,非常适合把握市场逆转时机,可用作 SuperTrend 的过滤器 随机精度: 利用随机振荡在波动的市场中寻找隐藏的机会, 用作超级趋势的过滤器 多时间范围分析: 从 M5 到 H1 或 H4,在不同时间范围内关注市场动态。 可定制的警报: 当您的自定义交易条件得到满足时收到通知,这样您就不会错过任何交易。 无论您是新手还是经验丰富的交易员,   Quantum TrendPulse 都能为您提供所需的优势,帮助您增强策略并自信地进行交易。借助这一强大的指标,将洞察力转化为利润 — 掌控您的交易! ***购买 Quantum TrendPulse,即可免费获得 Quantum Tr
Quantum Trend Sniper
Bogdan Ion Puscasu
4.73 (51)
介绍   量子趋势狙击指标 ,突破性的 MQL5 指标,正在改变您识别和交易趋势反转的方式!由拥有超过13年交易经验的资深交易员团队开发,     量子趋势狙击指标   旨在通过其创新的方式以极高的准确度识别趋势反转,将您的交易之旅推向新的高度。 ***购买量子趋势狙击指标,即可免费获得量子突破指标!*** 当量子突破指标识别出趋势反转时,它会向您发出警报和信号箭头,并建议您三个止盈水平。 它既适合新手交易者,也适合专业交易者。 量子 EA 通道:       点击这里 MT4版本:       点击这里 建议: 时间范围: 所有时间范围。为了获得最佳结果,我们建议在 M15、M30 和 H1 时间范围内使用它。 货币对:欧元兑美元、英镑兑美元、澳元兑美元、欧元兑英镑、, EURAUD,  XAUUSD 账户类型:ECN、Raw 或 Razor,点差极低 经纪时间:任意 经纪商:IC Markets、Pepperstone with Raw 和 Razor 的点差最低 建议止损:50 点 建议止盈水平:20 点、50 点和 100 点 规格: 不重漆! 最
RelicusRoad Pro MT5
Relicus LLC
4.78 (18)
现在$ 147(更新后增加到$ 499) - 无限帐户(PC或Mac) RelicusRoad 用户手册 + 培训视频 + 访问 Private Discord Group + VIP 身份 一种看待市场的新方式 RelicusRoad 是世界上最强大的外汇、期货、加密货币、股票和指数交易指标,为交易者提供保持盈利所需的所有信息和工具。我们提供技术分析和交易计划,帮助每一位交易者取得成功,从初学者到高级。它是一个关键的交易指标,可以提供足够的信息来预测未来的市场。我们相信一个完整的解决方案,而不是图表上几个没有意义的不同指标。这是一个多合一指标,显示无与伦比且非常准确的信号、箭头 + 价格行为信息。 RelicusRoad 基于强大的人工智能,提供缺失的信息和工具来教育您并使您成为交易专家,成为成功的交易者。 几乎所有技术指标都滞后,这意味着它们只能报告已经发生的事情。因此,他们只确认您过去可以看到的价格已经在哪里。我们相信领先指标可以预测未来价格,而无需重新绘制,也不要过度依赖可能改变并导致重新绘制的滞后指标。如果您根据滞后指标进行交易并建立头寸,您就知道您已经大部分时间
AT Forex Indicator MT5
Marzena Maria Szmit
5 (5)
The AT Forex Indicator MT5 is a sophisticated trading tool designed to provide traders with a comprehensive analysis of multiple currency pairs. This powerful indicator simplifies the complex nature of the forex market, making it accessible for both novice and experienced traders. AT Forex Indicator uses advanced algorithms to detect trends, patterns and is an essential tool for traders aiming to enhance their forex trading performance. With its robust features, ease of use, and reliable signal
BookMap HeatMap
Roberto Spadim
1 (2)
This Indicator creates a heatmap based on depth of market of the current symbol or another symbol. Other symbol is useful when you trade futures market and a contract has 'mini' and 'full' split. For example, in Brazil (B3 - BMF&Bovespa), WDO and DOL are future Forex contract of BRL/USD (where 1 DOL = 5 WDO) and big banks work mostly with DOL (where liquidity is important). Please use with M1 timeframe , objects are too small to be displayed at higher timeframes (MT5 limit). The number of level
CBT Quantum Maverick 高效的二元期权交易系统 CBT Quantum Maverick 是一款精心设计的高性能二元期权交易系统,专为追求精准、简单和纪律的交易者打造。无需自定义,该系统经过优化,可直接使用并产生高效结果。只需遵循信号操作,稍加练习即可掌握。 主要特点: 信号精准度: 基于当前K线生成下根K线交易信号,无频繁重绘。 市场多样性: 专为二元期权交易设计,兼容多种经纪商和资产类别,适应不同交易偏好。 兼容性: Deriv Synthetic Charts :适用于任何时间框架。 OTC Charts :来自如 Quotex、PocketOption、Binomo、Stockity、IQOption、Exnova、OlympTrade、Deriv、Binolla 和 Homebroker 的经纪商,可导入 MT5(一周内提供免费导入支持,之后需支付服务费用)。 外汇、加密货币和商品市场 :扩展资产利用。 高收益二元资产 :建议使用90%以上的高回报率资产。 额外优势: 全面的交易计划: 提供系统化和纪律性交易的分步支持计划。 高效时间利用: 每天仅需一
介绍     Quantum Breakout PRO   ,突破性的 MQL5 指标,正在改变您交易突破区域的方式!由拥有超过13年交易经验的资深交易员团队开发,     量子突破 PRO     旨在通过其创新和动态的突破区域策略将您的交易之旅推向新的高度。 量子突破指标将为您提供带有 5 个利润目标区域的突破区域的信号箭头,以及基于突破框的止损建议。 它既适合新手交易者,也适合专业交易者。 量子 EA 通道:       点击这里 重要的!购买后请私信我领取安装手册。 建议: 时间范围:M15 货币对:GBPJPY、EURJPY、USDJPY、NZDUSD、XAUUSD 账户类型:ECN、Raw 或 Razor,点差极低 经纪商时间:GMT +3 经纪商:IC Markets、Pepperstone with Raw 和 Razor 的点差最低 规格: 不重漆! 最多 5 个建议利润目标区域 建议止损水平 可定制的盒子。您可以设置自己的 Box Time Start 和 Box Time End。 接触 如果您有任何疑问或需要帮助,请通过私人消息与我联系。
Golden Spikes Detector
Batsirayi L Marango
3.25 (4)
Golden Spikes Detector This indicator is based on an advanced strategy primarily for trading spikes on Boom and Crash Indices. Complex algorithms were implemented to detect high probability entries only. It alerts on potential Buy and Sell entries. To trade spikes on the Deriv or Binary broker, only take Buy Boom and Sell Cash alerts. It was optimised to be loaded on 5-minute timeframe although multiple timeframe analysis is done in the background. Features ·             Desktop pop up and sound
PZ Swing Trading MT5
PZ TRADING SLU
5 (5)
Swing Trading 是第一个旨在检测趋势方向的波动和可能的反转波动的指标。它使用在交易文献中广泛描述的基准摆动交易方法。该指标研究多个价格和时间向量,以追踪总体趋势方向,并检测市场超卖或超买并准备好进行修正的情况。 [ 安装指南 | 更新指南 | 故障排除 | 常见问题 | 所有产品 ] 市场波动的利润不会被窃取 指示器始终显示趋势方向 彩色价格带代表机会基准 彩色虚线表示可能的反转波动 该指标分析其自身的质量和性能 它实现了一个多时间仪表板 可定制的趋势和波动周期 它实现了电子邮件/声音/推送警报 指示器为非重涂或重涂 什么是摇摆交易 摇摆交易是一种尝试在一天到一周内从证券中获得收益的交易方式,尽管某些交易最终可以保持更长的寿命。摇摆交易者使用技术分析来买入弱点和卖出力量,并有耐心等待这些机会的发生,因为在发生一波抛售浪潮之后购买证券而不是陷入抛售更有意义。 机会基准 关于历史数据的大量研究证明,适合于波动交易的市场倾向于在基线价格带上下交易,基线价格带由图表显示,使用平均真实区间计算得出。波动交易者使用基线,该策略是购买常态和卖出躁狂,或做空常态并掩盖沮丧。在没有疲
Waterfall by Kratus
Justine Kelechi Ekweh
5 (1)
Overview The Waterfall Trading Indicator is a powerful momentum detection tool designed to identify high-probability trading opportunities across multiple timeframes. Built on pure price action analysis, this indicator provides clear, non-repainting signals that are especially effective for binary options and forex trading. Key Features Non-Repainting Signals : Based on real-time price action, ensuring reliable trade signals Multi-Timeframe Compatibility : Effective across all timeframes, with o
Cycle Sniper MT5
Elmira Memish
1 (2)
Cycle Sniper MT5  Cycle Sniper MT4 Version and definitions :  https://www.mql5.com/en/market/product/51950 Important Notes:  MT5 Version does not include Breakout Mode and Late Entry Mode Features. MT5 Version does not include RSI and MFI filter. **Please contact us after your purchase and we will send you the complimentary indicators to complete the system.** This indicator does not send any signal without a reason...You can observe and analyze the indicator and the signals it sends Cycle Sni
KT Renko Patterns MT5
KEENBASE SOFTWARE SOLUTIONS
KT Renko Patterns scans the Renko chart brick by brick to find some famous chart patterns that are frequently used by traders across the various financial markets. Compared to the time-based charts, patterns based trading is easier and more evident on Renko charts due to their uncluttered appearance. KT Renko Patterns features multiple Renko patterns, and many of these patterns are extensively explained in the book titled Profitable Trading with Renko Charts by Prashant Shah. A 100% automated
WOW Market Signal MT5
Nirundorn Promphao
The principle of this indicator is very simple: detecting the trend with Moving Average, then monitoring the return point of graph by using the crossing of Stochastic Oscillator and finally predicting BUY and SELL signal with arrows, alerts and notifications. The parameters are fixed and automatically calculated on each time frame. Example: If you install indicator on EURUSD, timeframe M5: the indicator will detect the main trend with the Moving Average on this timeframe (for example the Moving
Royal Scalping Indicator M5
Vahidreza Heidar Gholami
5 (6)
Royal Scalping Indicator is an advanced price adaptive indicator designed to generate high-quality trading signals. Built-in multi-timeframe and multi-currency capabilities make it even more powerful to have configurations based on different symbols and timeframes. This indicator is perfect for scalp trades as well as swing trades. Royal Scalping is not just an indicator, but a trading strategy itself. Features Price Adaptive Trend Detector Algorithm Multi-Timeframe and Multi-Currency Trend Low
TPA True Price Action indicator reveals the true price action of the market makers through 100% non-repainting signals strictly at the close of a candle! TPA shows entries and re-entries, every time the bulls are definitely stronger than the bears and vice versa. Not to confuse with red/green candles. The shift of power gets confirmed at the earliest stage and is ONE exit strategy of several. There are available now two free parts of the TPA User Guide for our customers. The first "The Basics"
FxaccurateLS
Shiv Raj Kumawat
WHY IS OUR FXACCCURATE LS MT5 THE PROFITABLE ? PROTECT YOUR CAPITAL WITH RISK MANAGEMENT Gives entry, stop and target levels from time to time. It finds Trading opportunities by analyzing what the price is doing during established trends. POWERFUL INDICATOR FOR A RELIABLE STRATEGIES We have made these indicators with a lot of years of hard work. It is made at a very advanced level. Established trends provide dozens of trading opportunities, but most trend indicators completely ignore them! The
ON Trade Gann Squares MT5
Abdullah Alrai
5 (2)
Gann 方块指标是一种强大的市场分析工具,基于 W.D. Gann 在其“市场预测数学公式”一文中介绍的数学概念。该指标融合了与平方数(如 144、90 和 52)有关的 Gann 技术,以及平方 9。此外,它还融入了  关于如何将平方 9 与通道和星形图案结合使用的方法。 用户手册和使用方式: 在使用该指标之前,我们建议您阅读用户手册,并与我们联系以获得任何澄清。您可以在我们的网站上找到完整的用户手册。 该指标提供了 MT5 的完整版本供购买,也提供了 MT4 的免费版本供测试。提供了两个版本的链接供您方便使用。 主要特点和功能: Gann 方块指标为您的交易环境提供了全套工具,使您能够基于几何图案和 Gann 的概念做出明智的决策。以下是主要特点: 平方 9 分析:   该指标可以绘制与平方 9 有关的各种元素,包括水平线、星形图案、网格、Gann 扇形等。这在您的图表上提供了 Gann 的几何概念的视觉表示。 Gann 方块:   该指标绘制了 Gann 方块 52、90 和 144,使您能够可视化和分析它们与价格走势的关系。 自由 Gann 星形图案:   该指标使您能够直接
可以说,这是您可以为MetaTrader平台找到的最完整的谐波价格形成自动识别指标。它检测19种不同的模式,像您一样认真对待斐波那契投影,显示潜在的反转区域(PRZ),并找到合适的止损和获利水平。 [ 安装指南 | 更新指南 | 故障排除 | 常见问题 | 所有产品 ] 它检测19种不同的谐波价格形态 它绘制了主要,衍生和互补的斐波那契投影(PRZ) 它评估过去的价格走势并显示每个过去的形态 该指标分析其自身的质量和性能 它显示合适的止损和获利水平 它使用突破来表明合适的交易 它在图表上绘制所有样式比率 它实现了电子邮件/声音/视觉警报 受斯科特·M·卡尼(Scott M. Carney)的书的启发,该指标旨在满足最纯粹和最熟练的交易者的需求。但是,它采取了一种使交易更容易的方式:在向交易发出信号之前,它会等待Donchian朝正确方向突破,从而使交易信号非常可靠。 斐波那契投影与向量无关 它实现了电子邮件/声音/推送警报 它绘制了ABCD投影 重要提示: 为了符合 Scott M. Carney先生 的商标申诉,某些图案名称已重命名为不言自明的替代方式, Scott M.
Advanced Supply Demand MT5
Bernhard Schweigert
4.5 (14)
任何新手或专业交易者的最佳解决方案! 该指标是一款独特、高质量、且价格合理的交易工具,因为我们已经整合了许多专有功能和新公式。 依据此更新,您将能够显示双重时间帧区域。 您不仅可以显示一个较高的时间帧,还可以同时显示图表时间帧,加上更高的时间帧:显示嵌套时区。 供需双方所有交易者都会喜欢它。 :) 重要信息披露 高级供需的最大潜力,请访问 https://www.mql5.com/zh/blogs/post/720245   想象您的交易如何得以改善,是因为您能够精准定位入场或目标位吗? 构建于新的底层算法,它可以更轻松地识别出买卖双方之间的潜在失衡。 这是因为它以图形方式展示供需最强劲区域,及其过去的表现(显示旧区域)。 这些功能旨在帮助您更轻松地发现最佳入场区域和价位。 现在您可以针对您的交易品种和时间帧来优化和编辑区域强度! 高级供需指标适用于所有产品和时间帧。 它是一个新的公式,非常新的功能是两个区域强度函数可由用户输入进行调整! 这在交易中是一大优势。 当您学习如何使用专有功能,例如带有价格游离最小 X 因子的区域强度时,您能够判断该区域强劲与否。 供需区域用作警报触发器。
TrendMaestro5
Stefano Frisetti
note: this indicator is for METATRADER4, if you want the version for METATRADER5 this is the link:  https://www.mql5.com/it/market/product/108106 TRENDMAESTRO ver 2.4 TRENDMAESTRO recognizes a new TREND in the bud, he never makes mistakes. The certainty of identifying a new TREND is priceless. DESCRIPTION TRENDMAESTRO identifies a new TREND in the bud, this indicator examines the volatility, volumes and momentum to identify the moment in which there is an explosion of one or more of these data a
MetaForecast M5
Vahidreza Heidar Gholami
5 (2)
MetaForecast能够根据价格数据中的谐波来预测和可视化任何市场的未来走势。虽然市场不总是可预测的,但如果价格中存在模式,MetaForecast可以尽可能准确地预测未来。与其他类似产品相比,MetaForecast通过分析市场趋势可以生成更精确的结果。 输入参数 Past size (过去的尺寸) 指定MetaForecast用于创建生成未来预测模型的柱数量。该模型以一条黄色线绘制在所选柱上。 Future size (未来的尺寸) 指定应预测的未来柱数量。预测的未来以粉色线表示,并在其上绘制了蓝色回归线。 Degree (程度) 此输入确定了MetaForecast将在市场上进行的分析级别。 Degree 描述  0 对于程度0,建议使用较大的值来设置“过去的尺寸”输入,以覆盖价格中的所有高峰、低谷和细节。  1 (建议的) 对于程度1,MetaForecast可以理解趋势,并通过较小的“过去的尺寸”生成更好的结果。  2 对于程度2,除了趋势,MetaForecast还可以识别反转点。对于大于1的程度,必须使用较高的“细节”和“噪音减少”输入值。  大于2 不建议使用大于
Blahtech Supply Demand MT5
Blahtech Limited
4.54 (13)
Was: $299  Now: $149  Supply Demand uses previous price action to identify potential imbalances between buyers and sellers. The key is to identify the better odds zones, not just the untouched ones. Blahtech Supply Demand indicator delivers functionality previously unavailable on any trading platform. This 4-in-1 indicator not only highlights the higher probability zones using a multi-criteria strength engine, but also combines it with multi-timeframe trend analysis, previously confirmed swings
CONTACT US  after purchase to get the Indicator Manual. Try Now—Limited 50% Discount for First 10 Buyers! Download the  Metatrader 4 Version Read the product description carefully before purchasing the product.  Due to regulatory restrictions, our service is unavailable in certain countries such as India, Pakistan, and Bangladesh. William Delbert Gann (W.D. Gann) was an exceptional market analyst, whose trading technique was based on a complex blend of mathematics, geometry, astrology, and anc
PZ Mean Reversion MT5
PZ TRADING SLU
3 (2)
采用专业和量化方法进行均值回归交易的独特指标。它利用了价格以可预测和可衡量的方式转移并返回均值这一事实,这允许明确的进入和退出规则大大优于非量化交易策略。 [ Installation Guide | Update Guide | Troubleshooting | FAQ | All Products ] 清晰的交易信号 非常容易交易 可定制的颜色和尺寸 实现性能统计 优于大多数交易策略 显示合适的止损和止盈水平 它实现了电子邮件/声音/视觉警报 这个怎么运作 该指标从更高的时间范围测量完全可定制的移动平均线的标准偏差,并使用趋势跟踪方法精确地找到交易。交易是通过深入当前图表的价格行为发现的,并在价格返回到平均价格区间时关闭,根据您选择的更高时间范围计算。由于其编码方式,该指标将远离高波动性和强劲趋势市场,并且仅在可预测的情况下进行交易,在可接受的波动性与方向性比率范围内,回归均值是可行的。 指标剖析 绿线是更高时间范围内的移动平均线(也就是平均值) 虚线区域是移动平均线周围的典型价格区间 蓝线是看涨交易的突破价格 红线是看跌交易的突破价格 交易是针对均值进行的,并在典型的价格
Blahtech Market Profile MT5
Blahtech Limited
5 (10)
Was: $249  Now: $149   Market Profile defines a number of day types that can help the trader to determine market behaviour. A key feature is the Value Area, representing the range of price action where 70% of trading took place. Understanding the Value Area can give traders valuable insight into market direction and establish the higher odds trade. It is an excellent addition to any system you may be using. Inspired by Jim Dalton’s book “Mind Over Markets”, this indicator is designed to suit the
Elliot Waves Analyzer Pro
Viktor Weidenthal
2.67 (3)
Elliot Waves Analyzer Pro calculates Elliot Waves to Help Identify Trend direction and Entry Levels. Mainly for Swing Trading Strategies. Usually one would open a Position in trend direction for Wave 3 or a Correction for Wave C . This Indicator draws Target Levels for the current and next wave. Most important Rules for Elliot Wave Analysis are verified by the Indicator.  The Pro version analyzes Multiple Timeframes and shows the Subwaves and Target-Levels.   For an Overview  " Elliot Waves Anal
Royal Wave Pro M5
Vahidreza Heidar Gholami
3.5 (4)
Royal Wave is a Trend-Power oscillator which has been programmed to locate and signal low-risk entry and exit zones. Its core algorithm statistically analyzes the market and generates trading signals for overbought, oversold and low volatile areas. By using a well-designed alerting system, this indicator makes it easier to make proper decisions regarding where to enter and where to exit trades. Features Trend-Power Algorithm Low risk Entry Zones and Exit Zones Predictions for Overbought and Over
作者的更多信息
Pivot on Candle of the Day
David Ben Svaiter
5 (1)
How many times have you looked for a PIVOT that works on a specific candle every day? Many traders like to estimate the direction of the day's trend based on a specific time each day, such as 30 minutes after the market opens, or at 12 noon, and so on. This indicator allows you to specify a certain time (hour and minute) and plots a pivot from that time to the next day at the same time. It shows five lines based on that specific candle/hour: median, maximum, minimum, support and resistance.
FREE
Keltner Enhanced
David Ben Svaiter
Keltner-Enhanced improves the accuracy and readability of Keltner Channels with many options for adjusting them and more five price calculations beyond the META default. The Keltner-E indicator is a banded indicator similar to Bollinger Bands and Moving Average Envelopes. They consist of an upper envelope above a midline and a lower envelope below the midline.  The main occurrences to look out for when using Keltner Channels are breakouts above the Upper Envelope or below the Lower Envelope.
FREE
Trend On Close
David Ben Svaiter
TrendOnClose is a sophisticated indicator designed for Binary market investors, focusing on statistical analysis of trends and counter-trends within specific candle cycles. Each cycle is defined by the candle CLOSE price, establishing the trend direction (UP/DOWN - BULL/BEAR) for subsequent statistical analysis until the start of the next cycle. The statistical analysis operates with two configurations: ⦁ Statistical Goal as SUBSEQUENT CANDLE: The algorithm focuses on the subsequent candle withi
HAshi-E is an enhanced way to analyze Heiken-Ashi signals. Briefing: Heiken-Ashi is particularly valued for its ability to filter out short-term volatility, making it a preferred tool for identifying and following trends, helps in decision-making regarding entry and exit points, and assists in distinguishing between false signals and genuine trend reversals. Unlike traditional candlestick charts, Heiken-Ashi candles are calculated using average values of previous bars, creating a smoother, mo
The Enhanced ADXW
David Ben Svaiter
Designed by Welles Wilder for daily commodity charts, the ADXW is now used in various markets by technical traders to assess the strength of a trend or even a trend for short- or long-term trades. The ADXW uses a positive (DI+) and negative (DI-) directional indicator in addition to its trend line (ADX). According to Wilder, a trend has strength when the ADX signal is above 25; the trend is weak (or the price has no trend) when the ADX is below 20. The absence of a trend does not mean that th
On-Balance Volume (OBV) is a technical indicator that relates volume and price to identify price movements. The basic idea behind OBV is that changes in volume generally precede price changes. The indicator accumulates volumes for periods when the price closes higher and subtracts volumes for periods when the price closes lower. This results in a value used to identify the direction of the asset's trend. The interpretation of the OBV is simple: a rising OBV suggests that buyers are willing to
In the realm of technical analysis, ParbMA emerges as a highly intuitive tool for examining the Parabolic SAR trend . This innovative approach leverages a customizable line, distinguished by its versatility in color, shape, and width options. Such flexibility enhances visual analysis and significantly aids in strategizing and decision-making. The ParbMA (Parabolic Moving Average) is a custom technical indicator that combines the concepts of J. Welles Wilder's Parabolic SAR (Stop and Reverse) a
Slow AMA
David Ben Svaiter
Compared to simple or exponential moving averages, slow adaptive trend lines might offer a more nuanced view of the trend by adjusting their sensitivity based on market conditions. However, their slow nature might also mean they are late in signaling reversals when market conditions change rapidly - and that is the difference between them and our SlowAMA . SlowAMA was designed to be a better long-term trend indicator than EMA and other Moving Averages. It uses our JurMA calculations, reducing
HAshi-E is an enhanced way to analyze Heiken-Ashi signals. Briefing: Heiken-Ashi is particularly valued for its ability to filter out short-term volatility, making it a preferred tool for identifying and following trends, helps in decision-making regarding entry and exit points, and assists in distinguishing between false signals and genuine trend reversals. Unlike traditional candlestick charts, Heiken-Ashi candles are calculated using average values of previous bars, creating a smoother, mo
Pivot on Day Range
David Ben Svaiter
How many times have you looked for a PIVOT that works on a specific timeframe every day? Many traders like to estimate the direction of the day's trend based on a specific time interval every day, such as from 2 hours before the NYSE opens to 1 hour after, or from the NYSE opens to 30 minutes after. This indicator allows you to specify a certain time interval (hour and minute) and plots a pivot from that interval to the next day in the same time interval. It shows five lines based on this: me
VIDYA Enhanced
David Ben Svaiter
The VIDYA-ENHANCED indicator (Variable Index Dynamic Average) is a technical analysis tool used to identify trends and sideways movements. It dynamically adjusts its sensitivity based on market volatility, using the Chande Momentum Oscillator as a volatility index. This feature allows VIDYA-ENHANCED to be more agile during periods of significant price movements, while remaining more stable during less volatile phases.  Features: - Select the price from 12 options - 5 more than the Metatrader
筛选:
无评论
回复评论
版本 1.6 2024.01.24
- Minor improvements.