Optimum Points MT4
- Göstergeler
- Yuriy Lyachshenko
- Sürüm: 1.0
- Etkinleştirmeler: 10
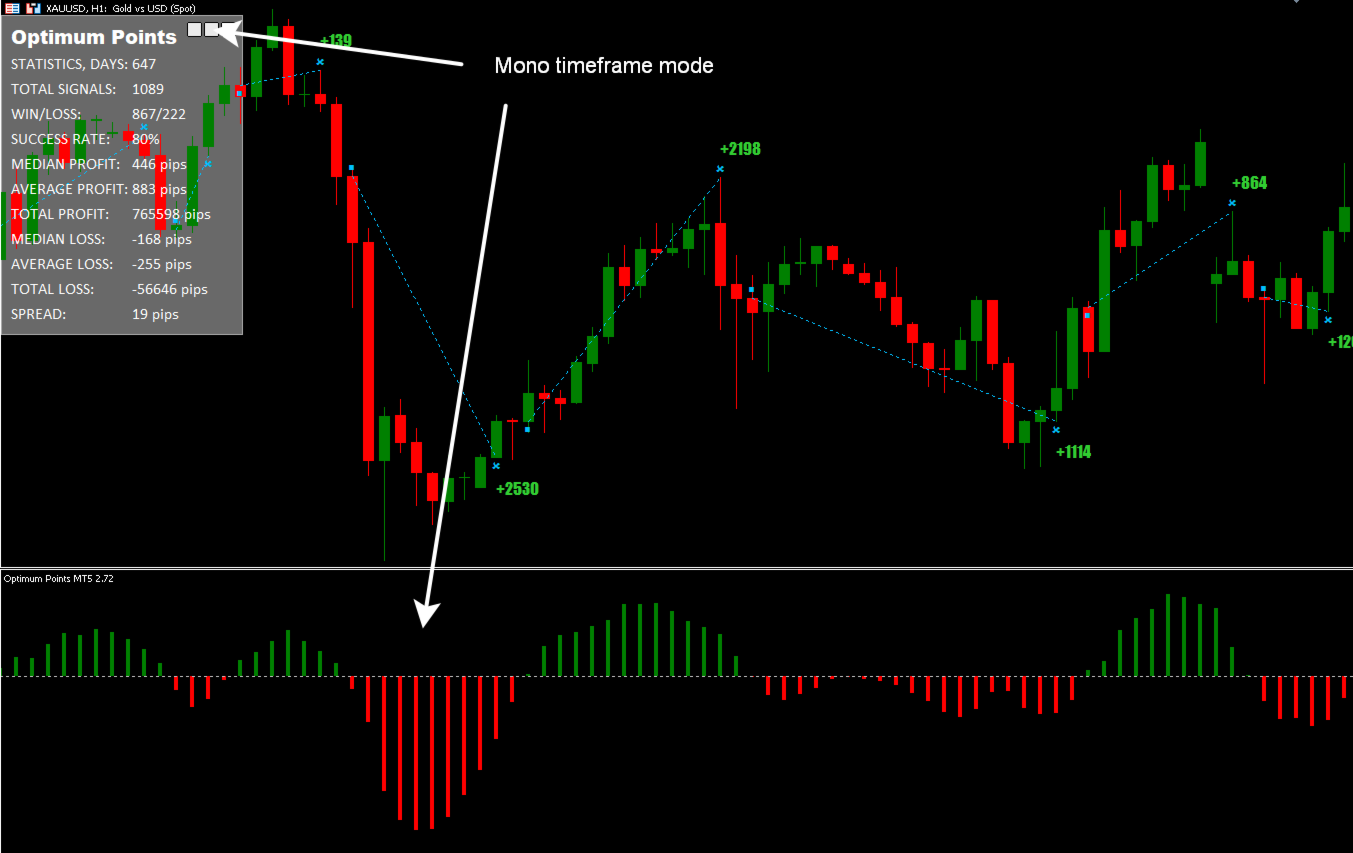
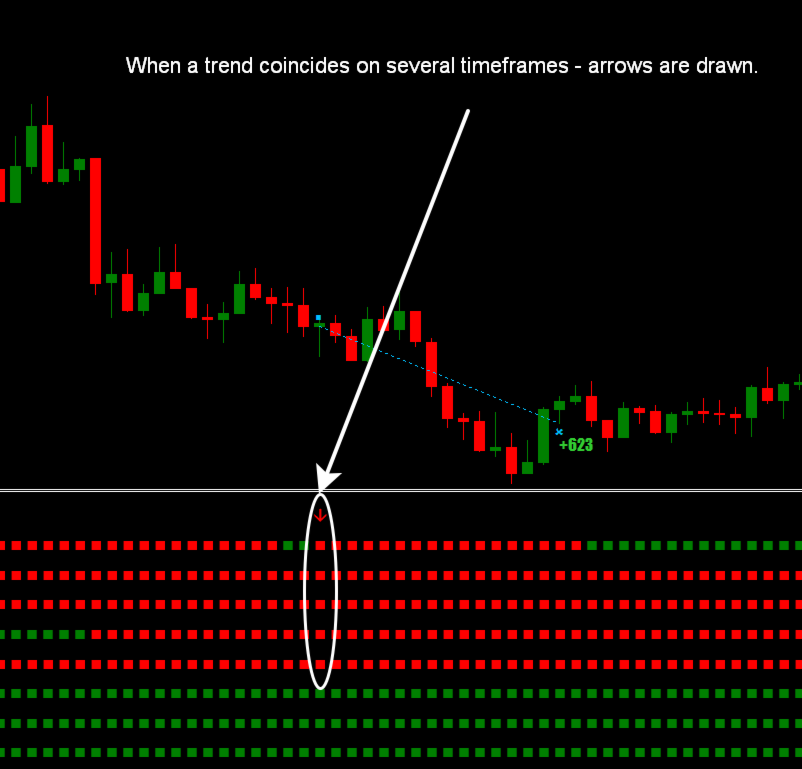
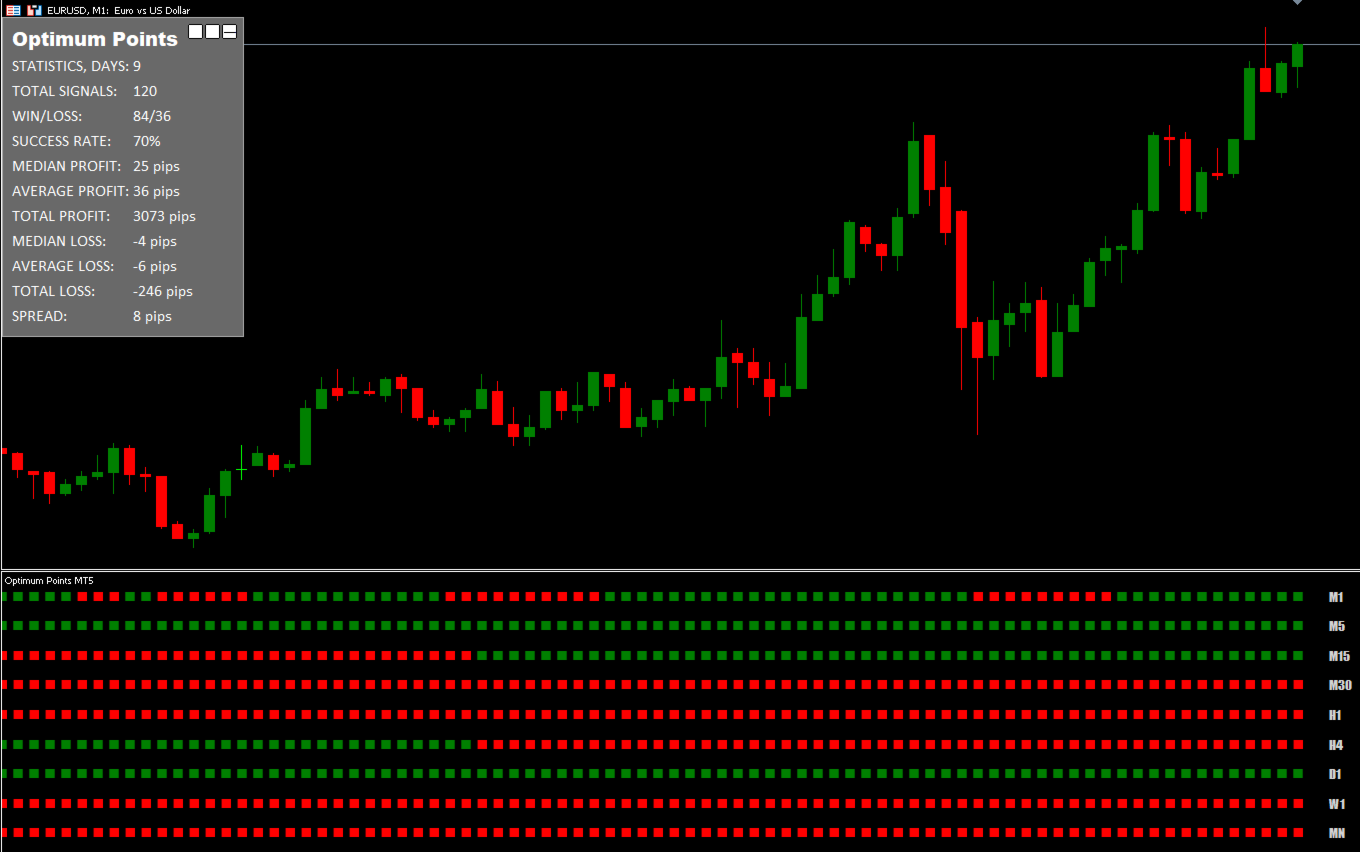
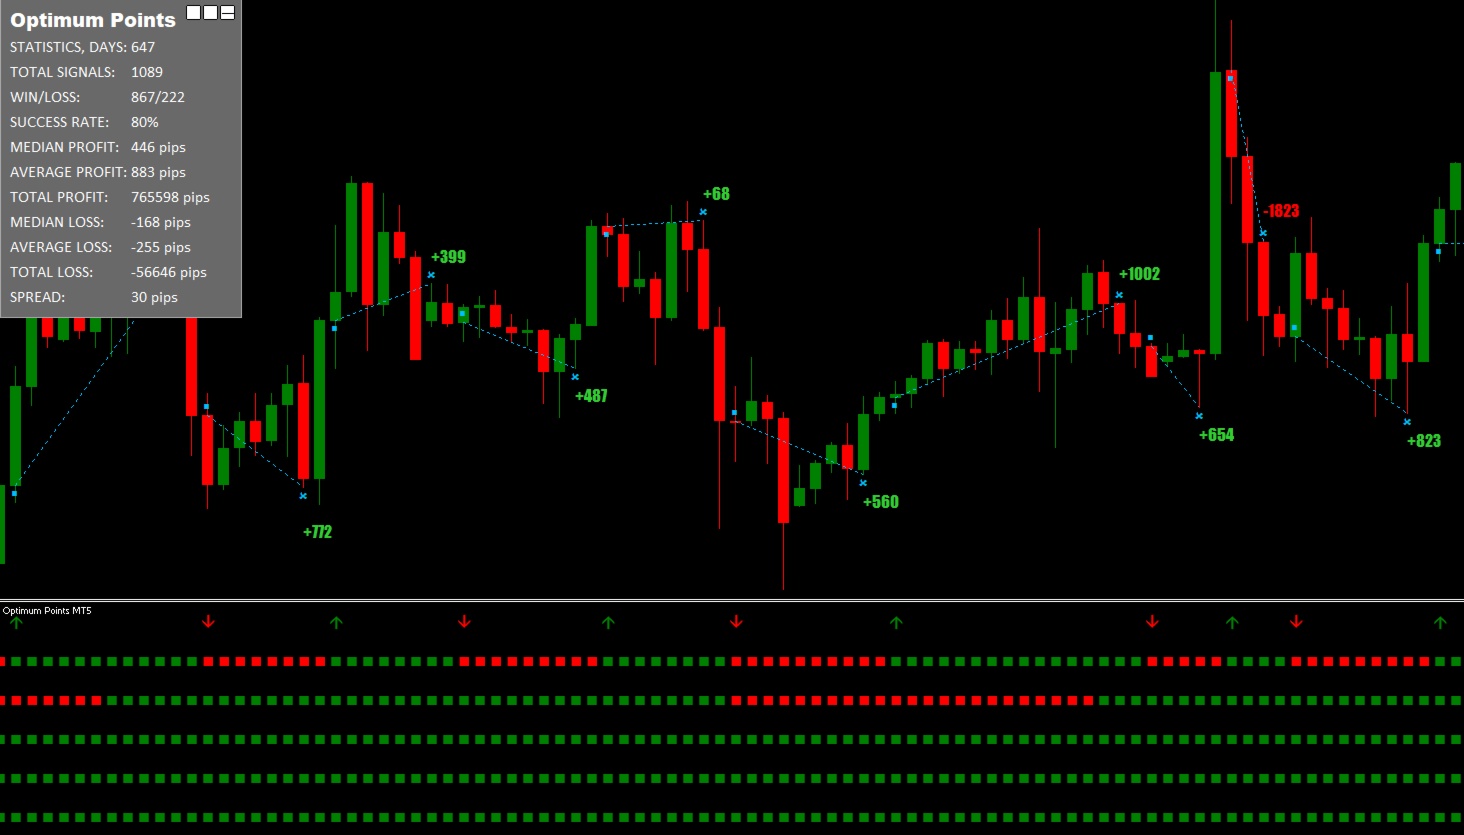
Gösterge, tek bir pencerede birden fazla zaman dilimindeki trend yönünü gösterir. Birkaç zaman diliminden gelen eğilim çakışırsa, oklar çizilir. Ayrıca, geçerli zaman dilimindeki eğilimi gösteren histograma da geçebilirsiniz.
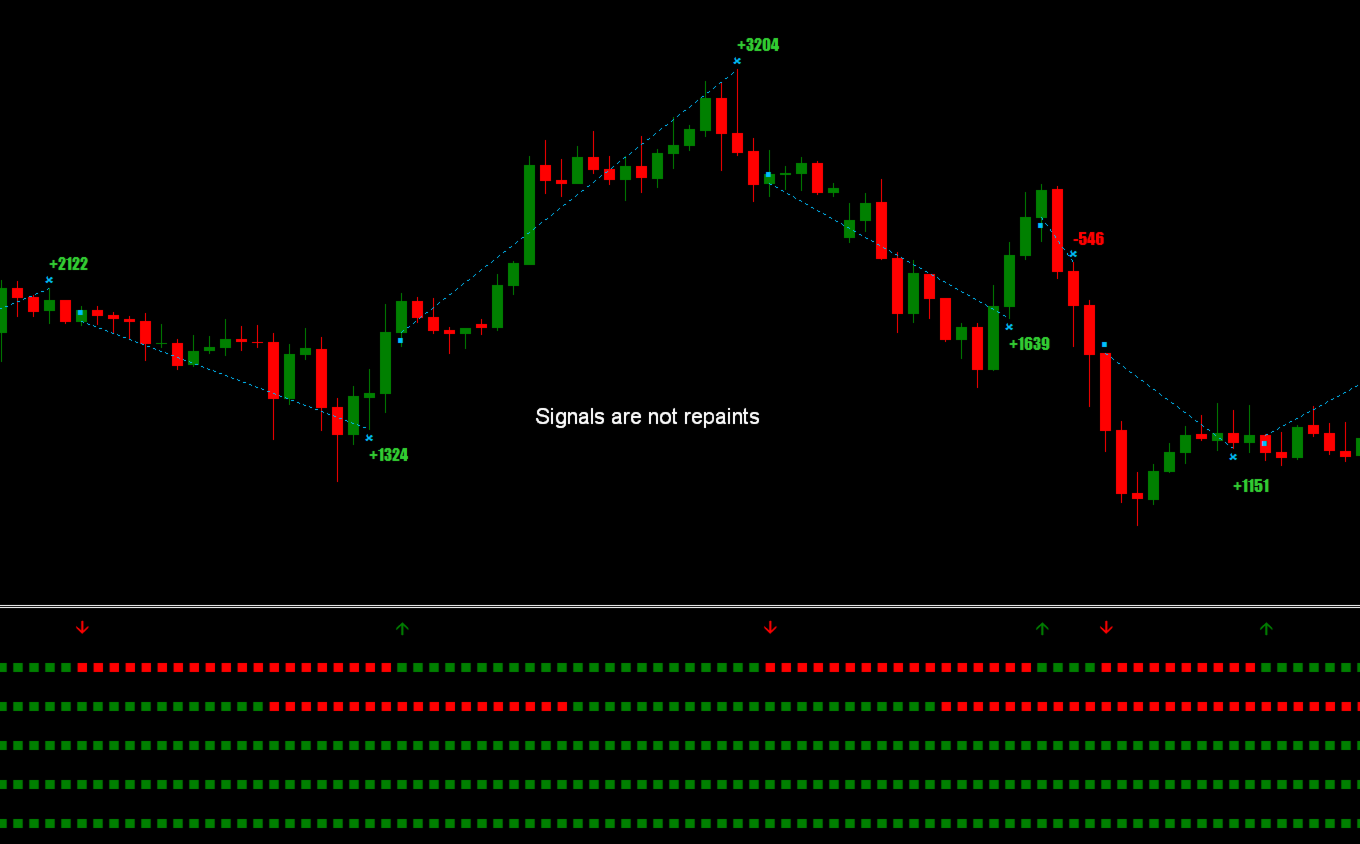
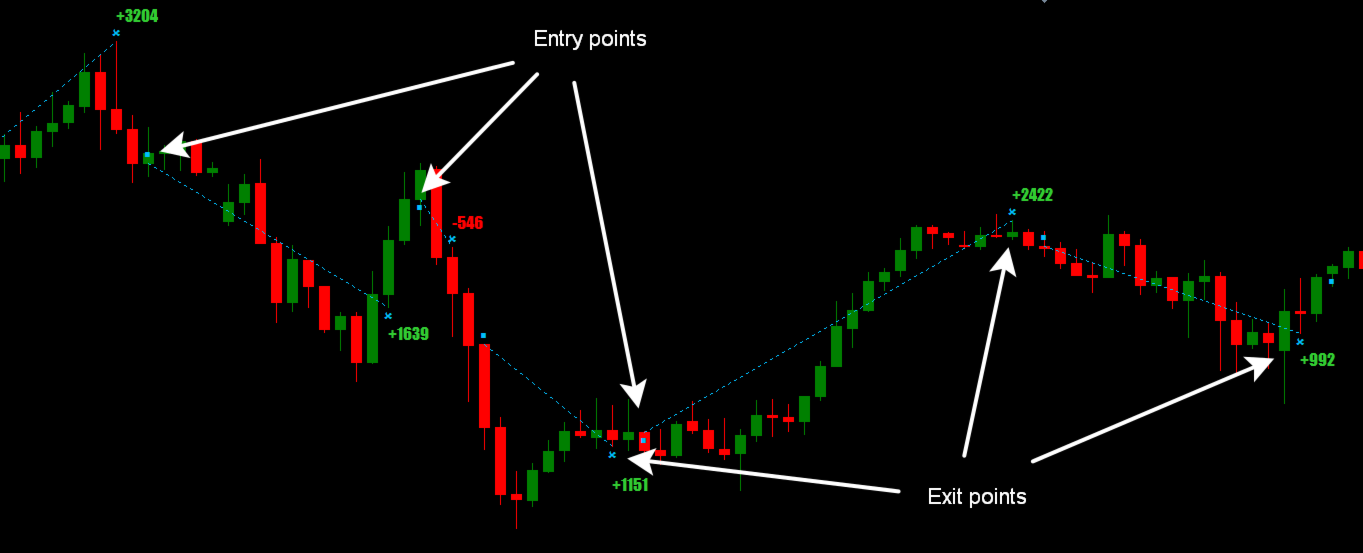
Gösterge, grafik üzerinde giriş noktaları ve yaklaşık çıkış noktaları çizer.
Uyarı: Gösterge çoklu zaman dilimi olduğundan, strateji test cihazında kullanılırken, gerekli tüm zaman dilimleri için teklifler önceden indirilmelidir. Test cihazında kotasyonların uzun süre indirilmesini beklememek için, başlangıç tarihini 2025.01.01 ve Modeli “Yalnızca açık fiyat” veya “Kontrol noktaları” koyabilirsiniz.
Özellikler
- Bu gösterge yeniden çizilmez. Geçmiş grafikte görüntülenenler gerçek zamanlı olarak görüntülenecektir.
- Herhangi bir varlığın ticaretini yapmak için kullanılabilir: kripto para birimi, hisse senetleri, metaller, endeksler, emtialar ve para birimleri.
- Tüm zaman dilimlerinde çalışır.
- Giriş sinyalleri yeni bir mumun açılışında görünür ve yeniden çizilmez.
- Bir anlaşmadan çıkmak için sinyaller geçici olarak verilir, çünkü genellikle bir anlaşmayı daha fazla karla kapatabilirsiniz.
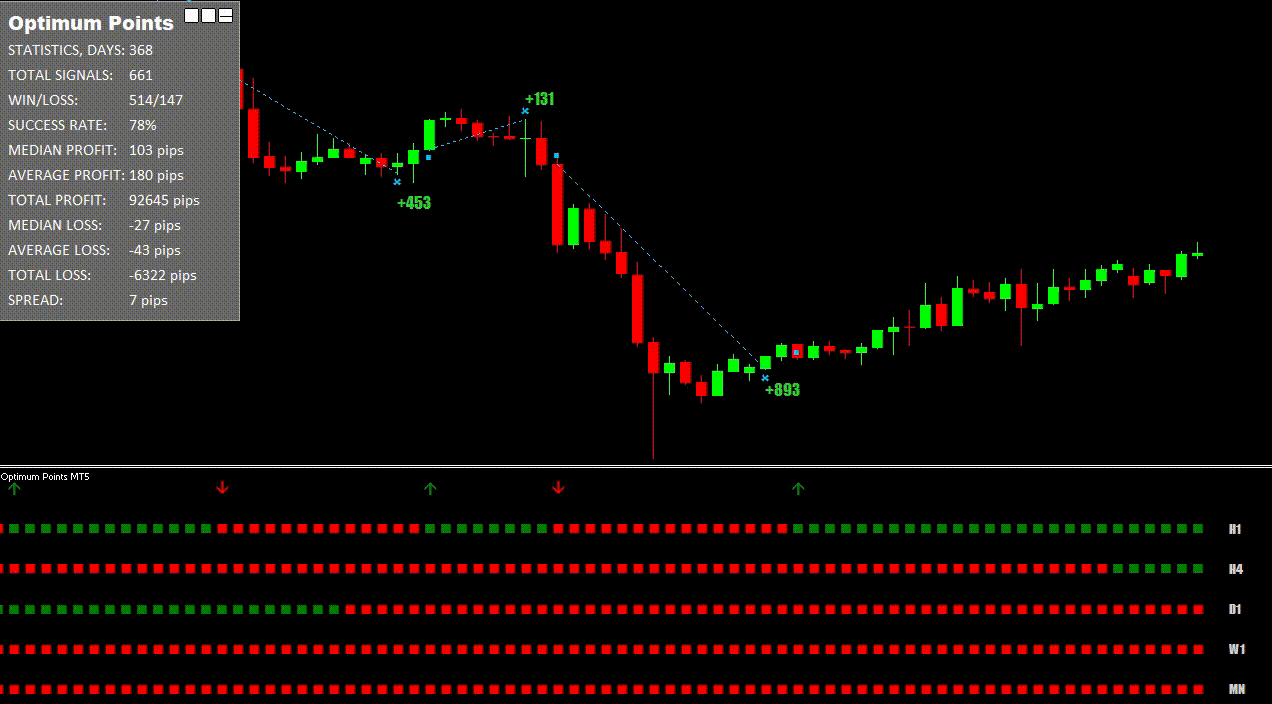
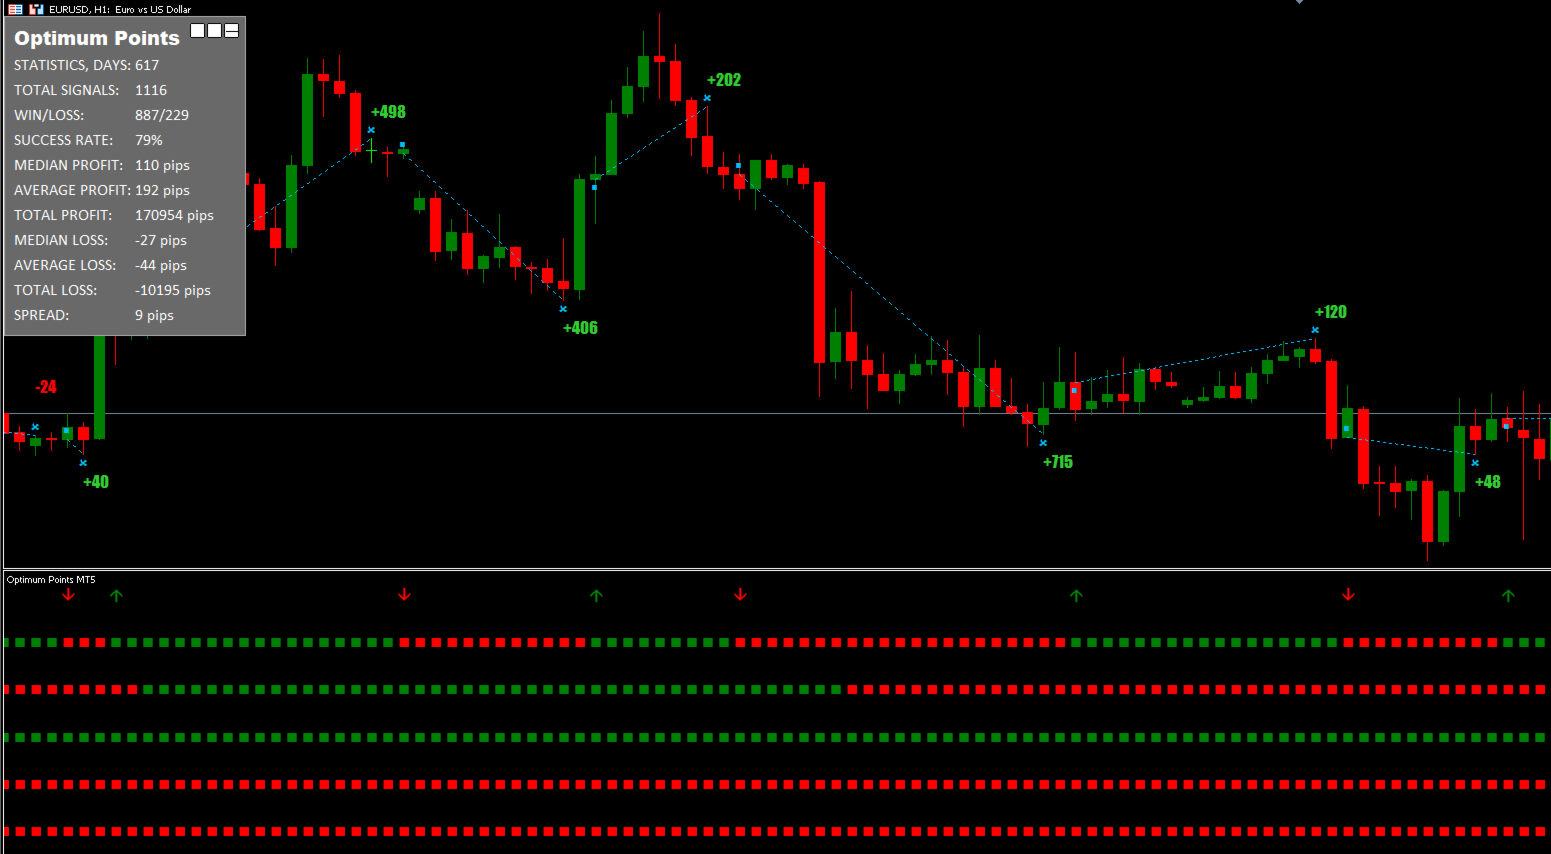
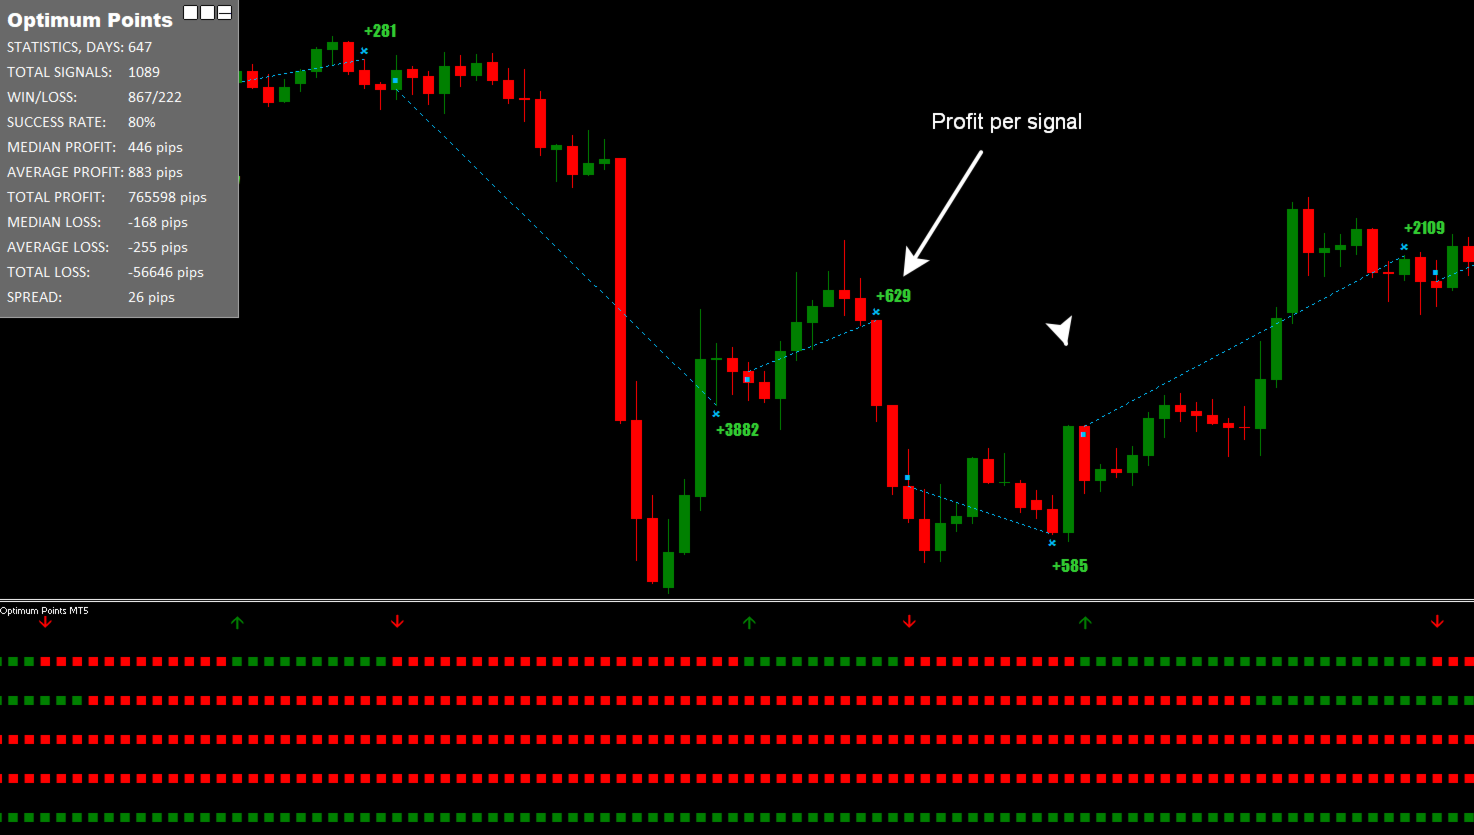
- Sol üstte, en aza indirilebilen ayrıntılı bir işlem istatistikleri paneli vardır.
- Trendin yönünü belirleyen hareketli ortalamayı hesaplamak için özel bir formül kullanır.
- Bir ticarete girmek için bir sinyalin görünümünü kaçırmamak için Uyarı penceresinde ve Push ile bir bildirim alabilirsiniz.
- Yeni başlayanlardan uzmanlara kadar her seviyeden kullanıcı için.
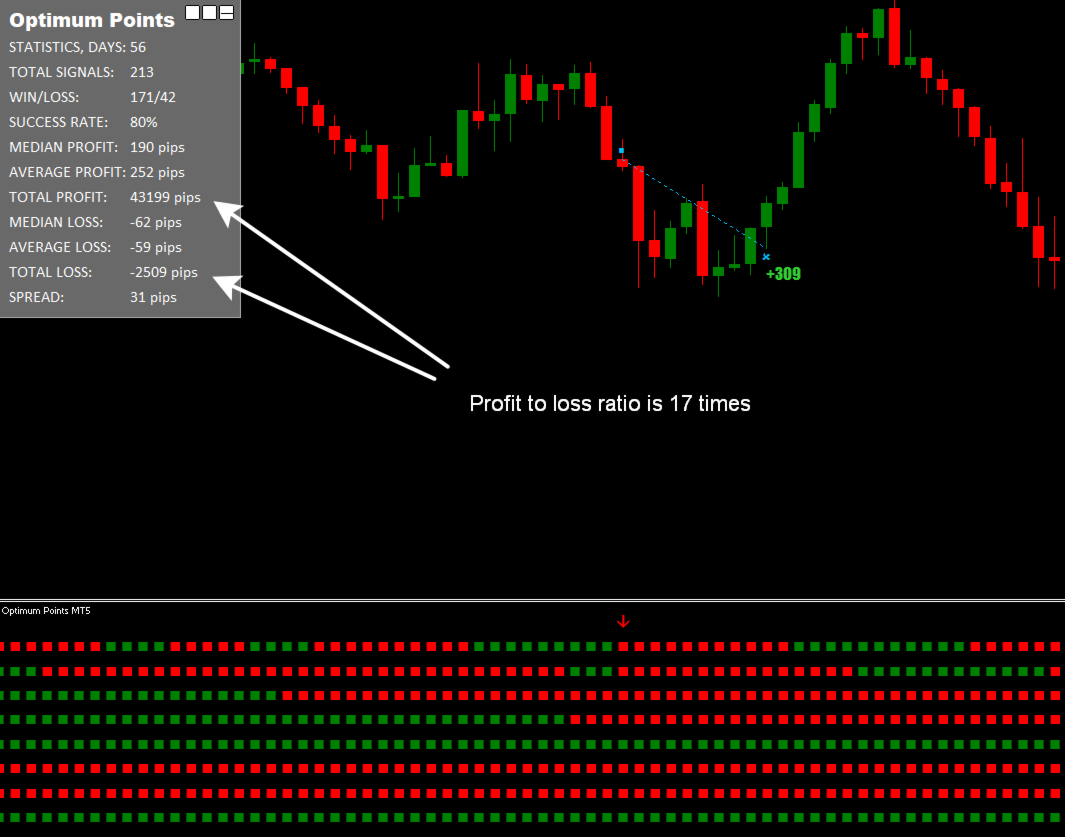
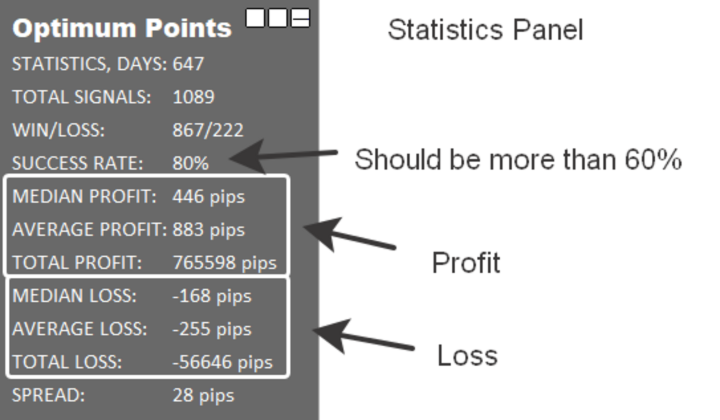
İstatistik paneli
- Sinyal geçmişinin alındığı gün sayısı.
- İstatistiklerin verildiği toplam sinyal sayısı.
- Kârlı ve kârsız sinyallerin sayısının oranı.
- Toplam sinyal sayısından karlı sinyallerin yüzdesi.
- Sinyale göre medyan kar.
- Sinyale göre ortalama kâr.
- Tüm sinyaller için toplam kâr.
- Sinyale göre medyan zarar.
- Sinyale göre ortalama zarar.
- Tüm sinyallerdeki toplam kayıp.
- Güncel yayılım.
Ayar parametreleri
| Period | gösterge hassasiyeti, ne kadar hassas olursa o kadar fazla sinyal |
| M1-MN1 coincidences | trend çakıştığında okların çizildiği zaman dilimlerinin seçimi |
| Font size | istatistik panelindeki metin boyutu |
| Show entry/exit points | giriş ve çıkış noktalarını açık/kapalı gösterin |
| Use alert notification | bildirim açılır penceresini ve sesli bildirimi açıp kapatın |
| Use push notification | anlık bildirimi açma/kapama |
Herhangi bir sorunuz veya zorluğunuz varsa bana özel olarak mesaj atmaktan çekinmeyin.