Optimum Points MT4
- Indicatori
- Yuriy Lyachshenko
- Versione: 1.0
- Attivazioni: 10
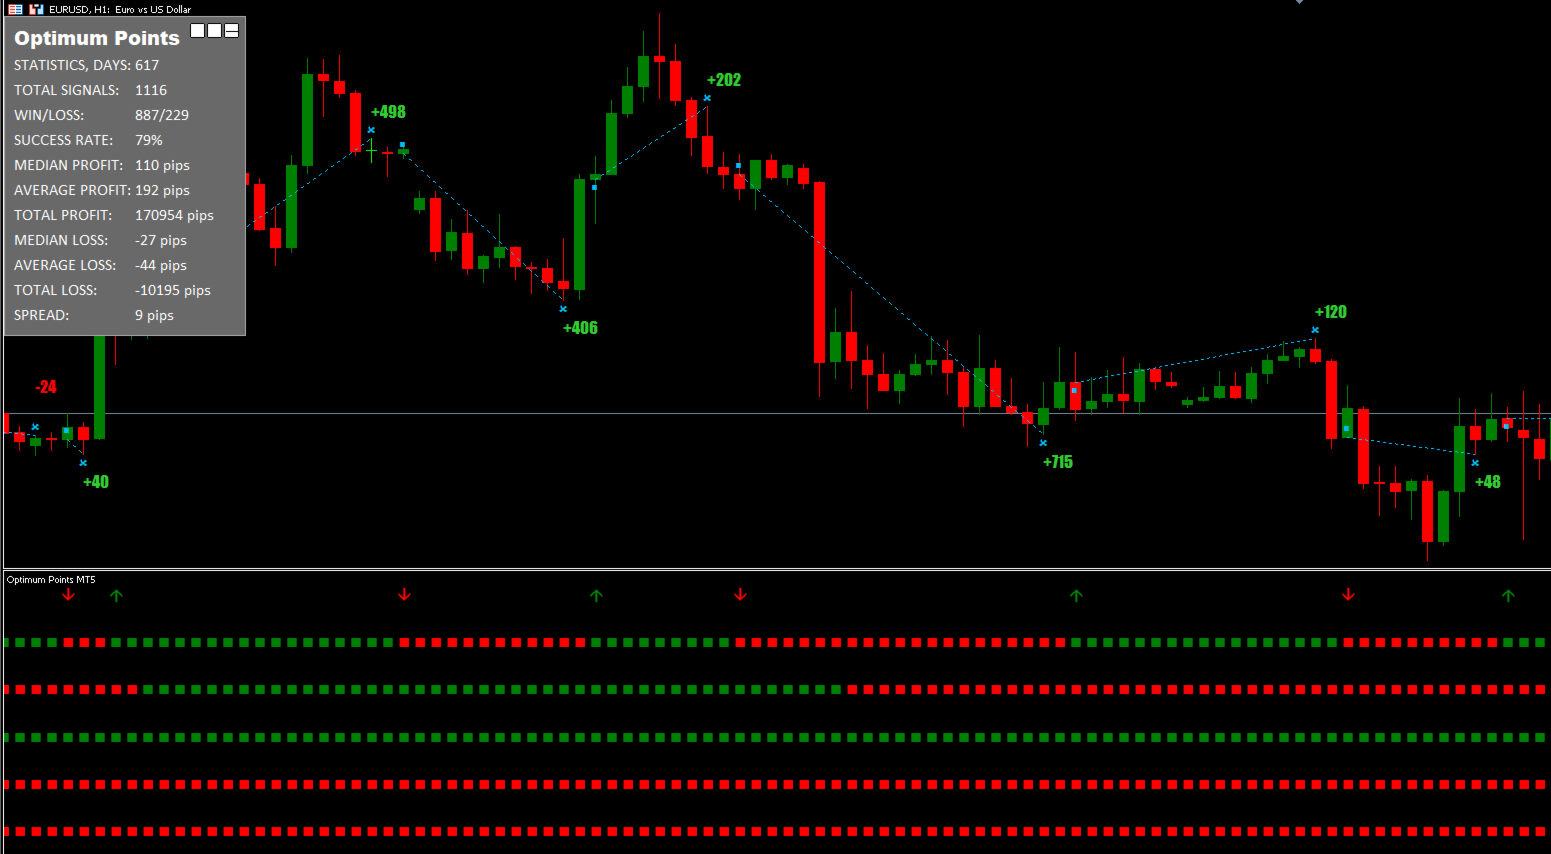
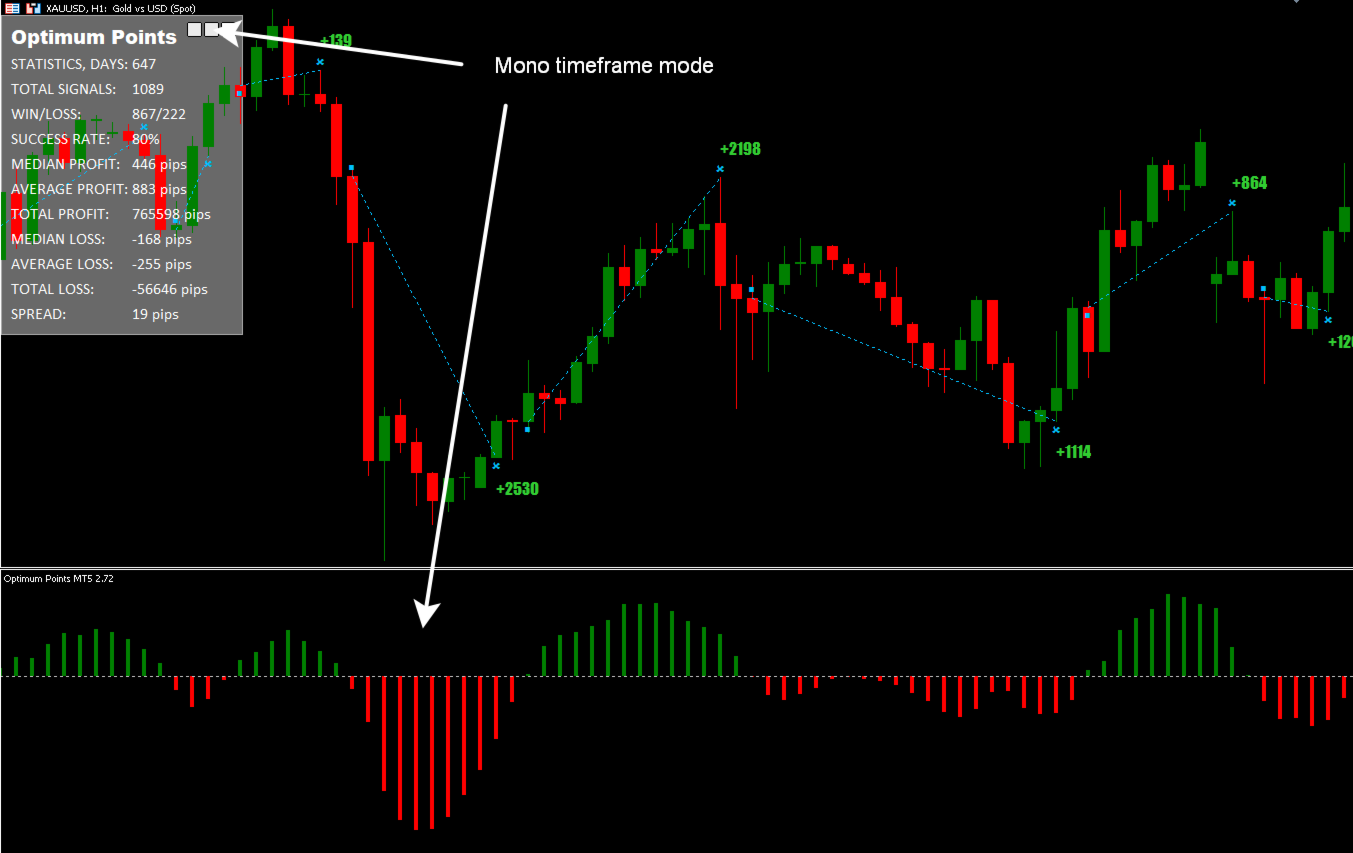
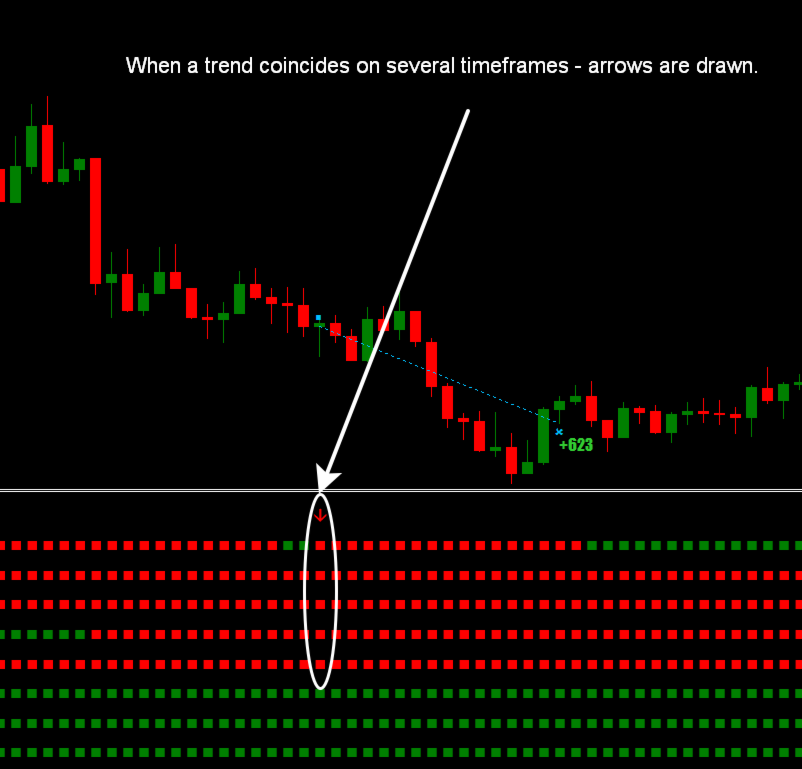
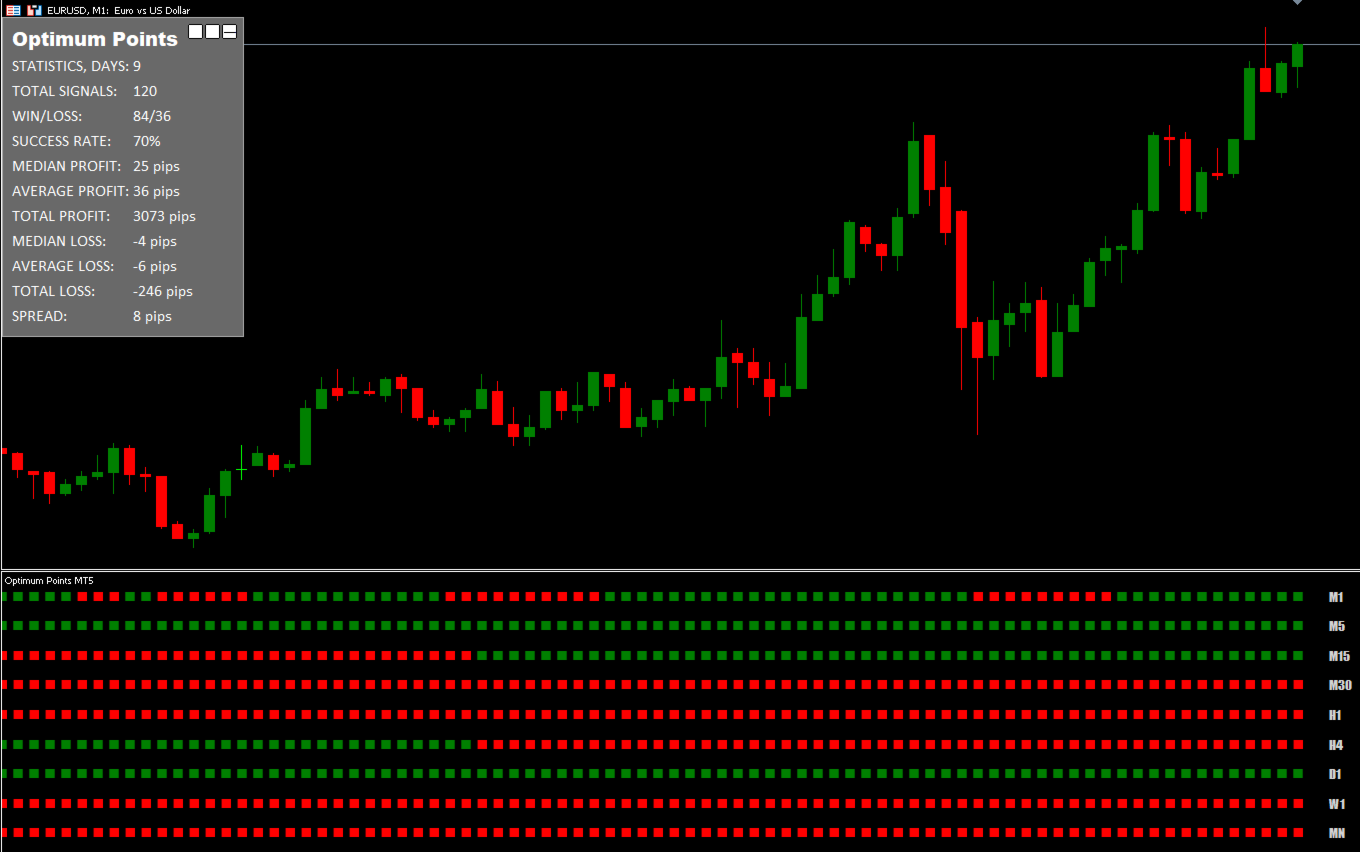
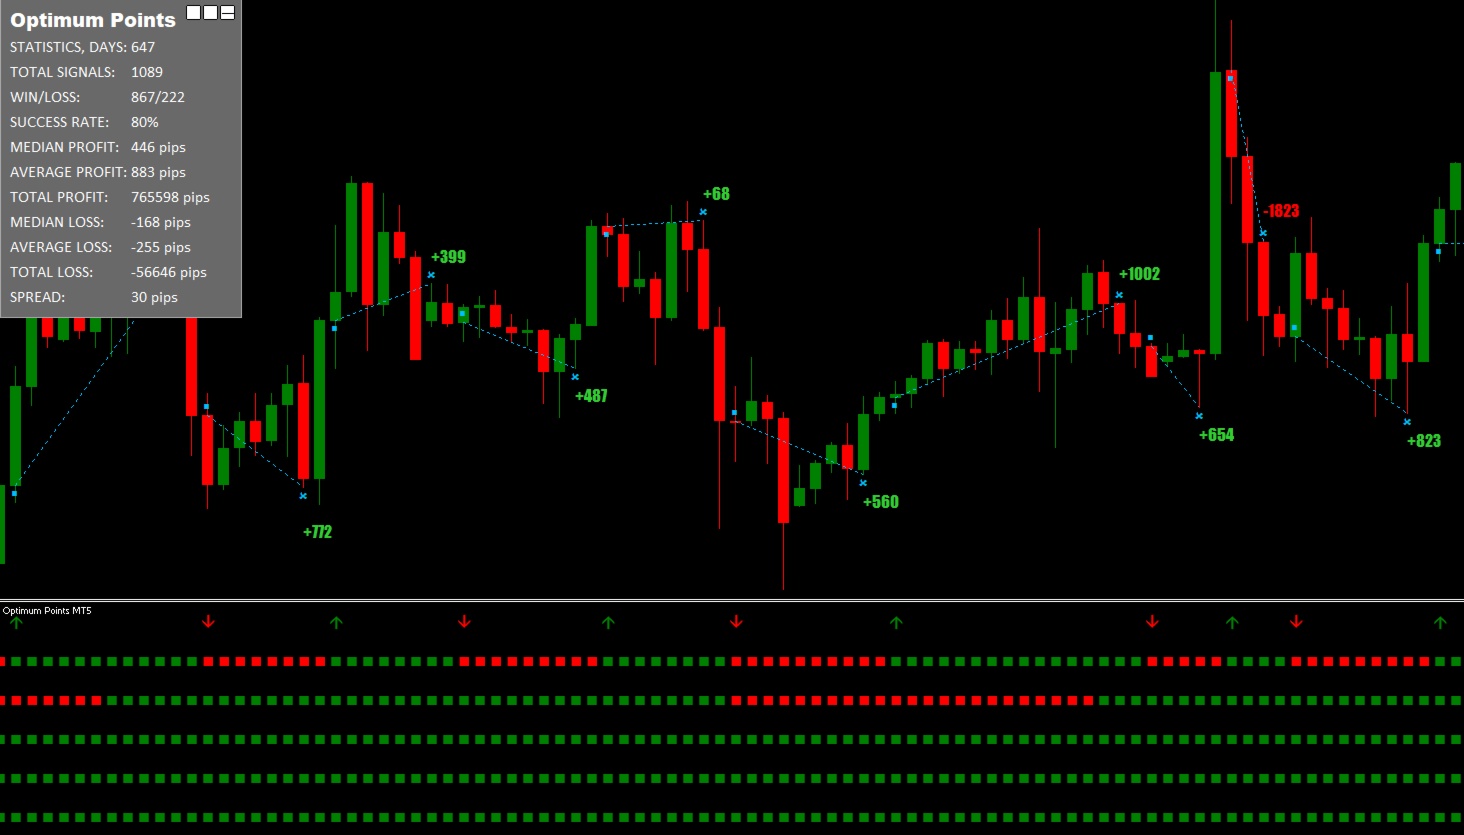
L'indicatore mostra la direzione del trend da più timeframe in un'unica finestra. Se il trend di diversi timeframe coincide, vengono disegnate delle frecce. È anche possibile passare all'istogramma, che indica il trend sul timeframe corrente.
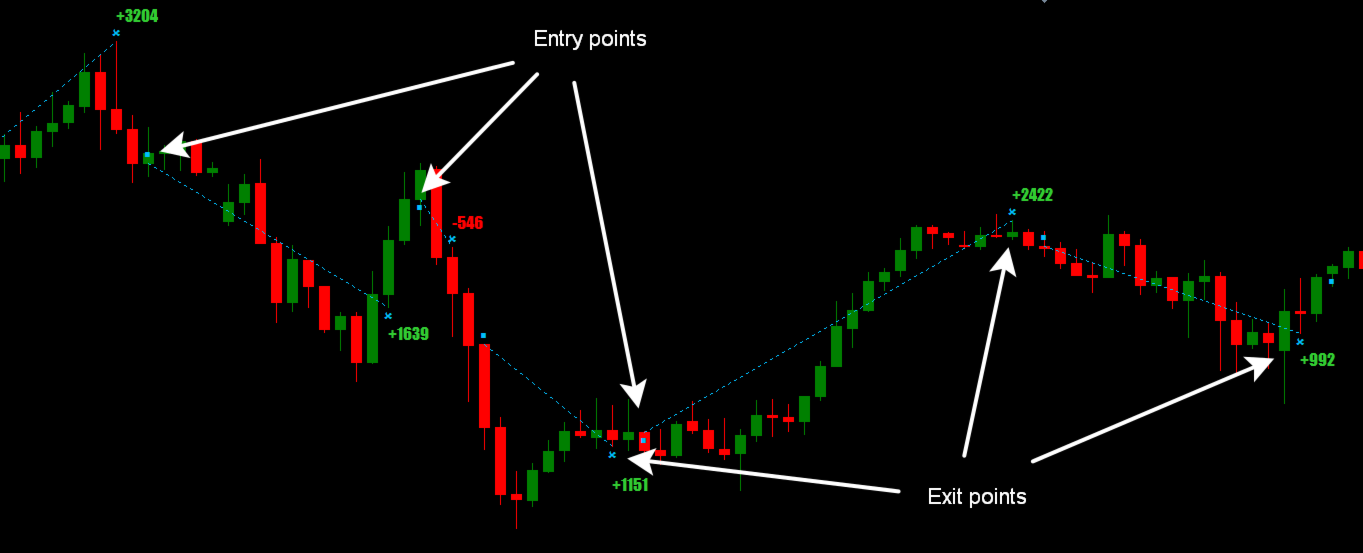
L'indicatore disegna sul grafico i punti di entrata e i punti di uscita approssimativi.
Attenzione: poiché l'indicatore è multi-timeframe, quando lo si utilizza nel tester della strategia è necessario scaricare in anticipo le quotazioni per tutti i timeframe necessari. Per non attendere un lungo download di quotazioni nel tester, è possibile inserire la data di inizio 2025.01.01 e il modello “Solo prezzo aperto” o “Punti di controllo”.
Versione dell'indicatore per MT5
Caratteristiche
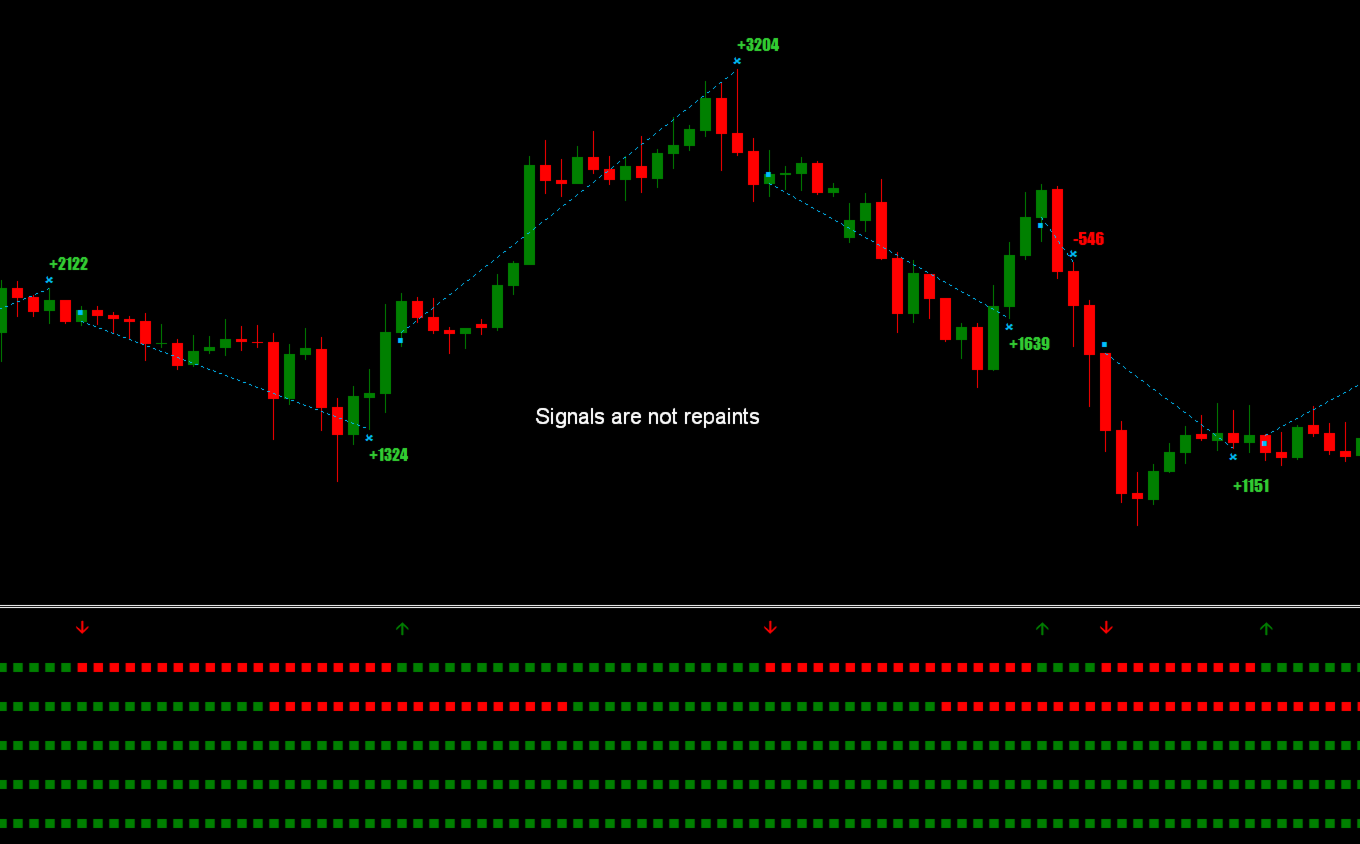
- Questo indicatore non ridisegna. Ciò che viene visualizzato sul grafico storico sarà visualizzato in tempo reale.
- Può essere utilizzato per negoziare qualsiasi asset: criptovalute, azioni, metalli, indici, materie prime e valute.
- Funziona con tutti i timeframe.
- I segnali di entrata appaiono all'apertura di una nuova candela e non vengono ridisegnati.
- I segnali per l'uscita da un'operazione sono forniti in modo provvisorio, perché spesso è possibile chiudere un'operazione con un profitto maggiore.
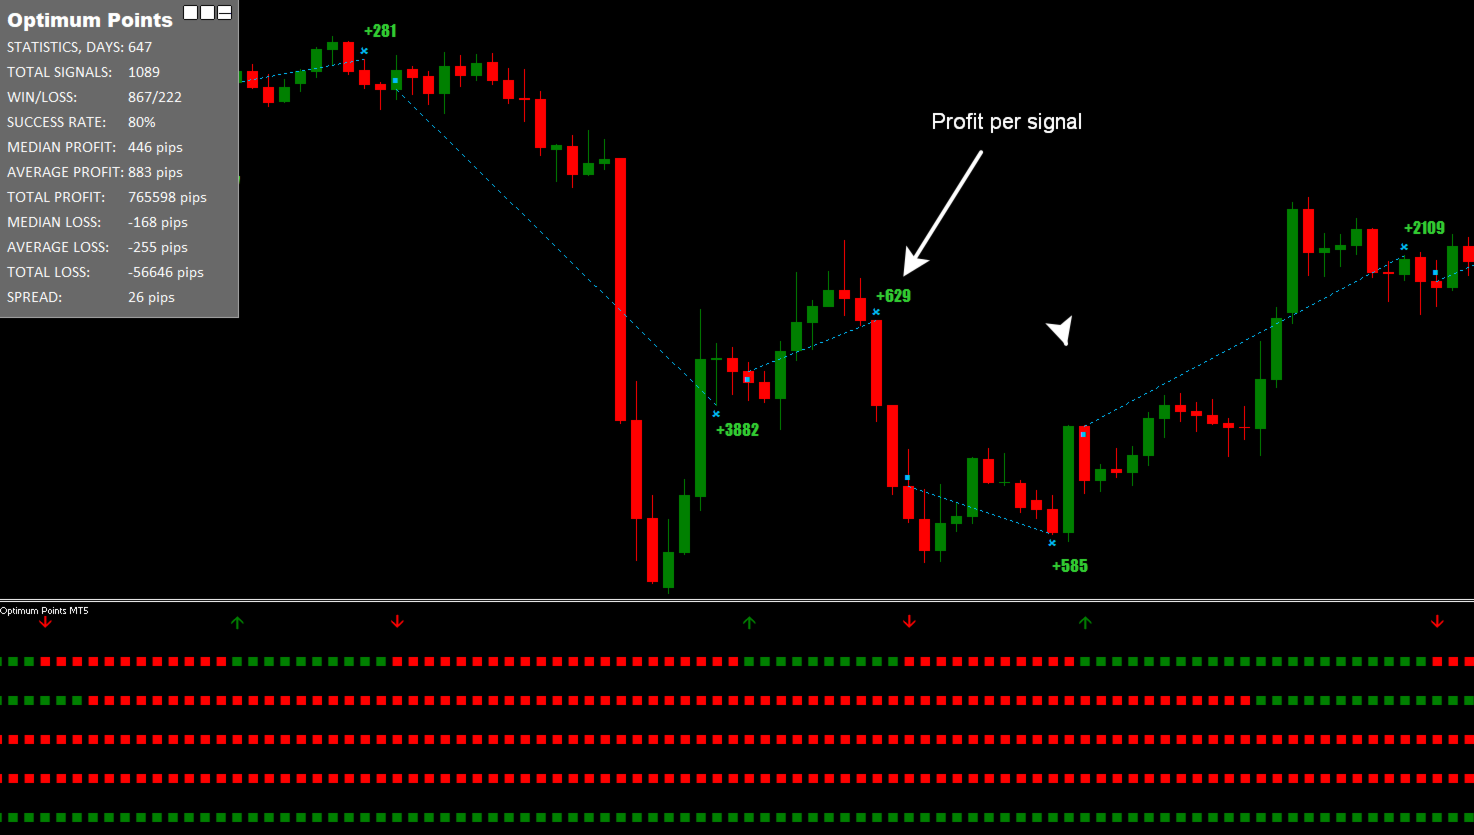
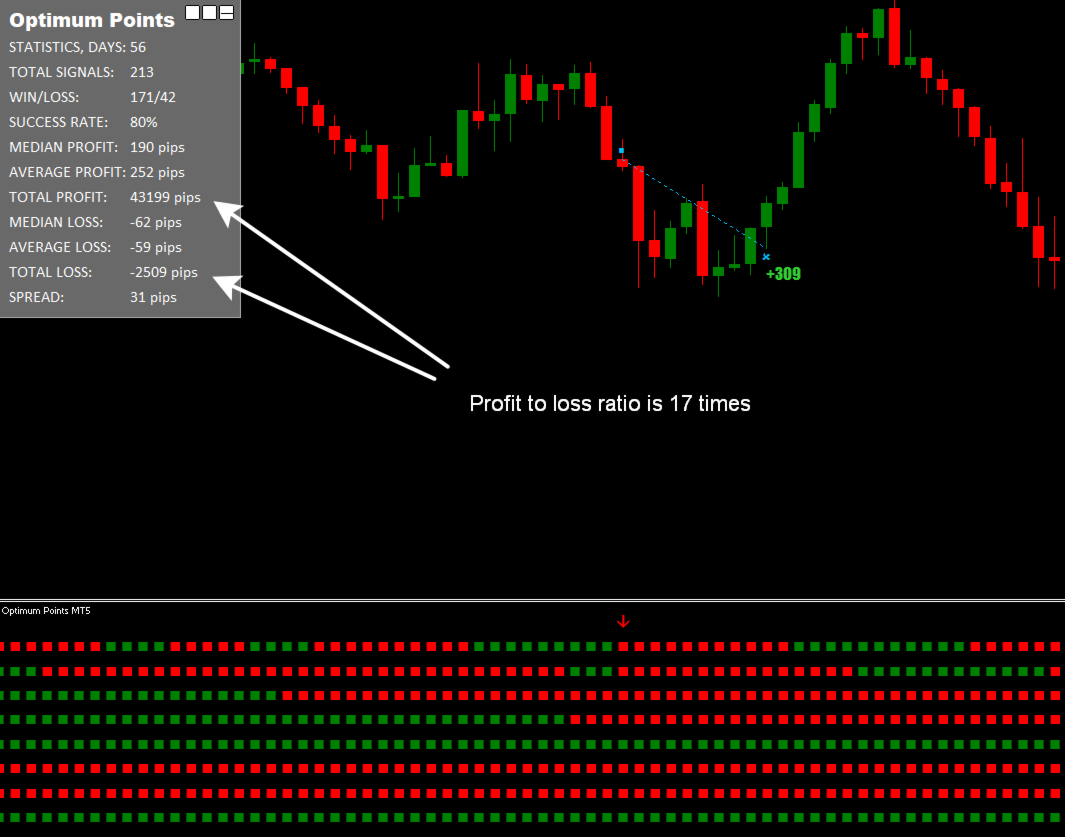
- In alto a sinistra si trova un pannello dettagliato di statistiche sulle transazioni, che può essere minimizzato.
- Utilizza una formula speciale per calcolare la media mobile, che determina la direzione del trend.
- Per non perdere la comparsa di un segnale di entrata nel trading, è possibile ricevere una notifica nella finestra Alert e tramite Push.
- Per utenti di tutti i livelli, dai principianti agli esperti.
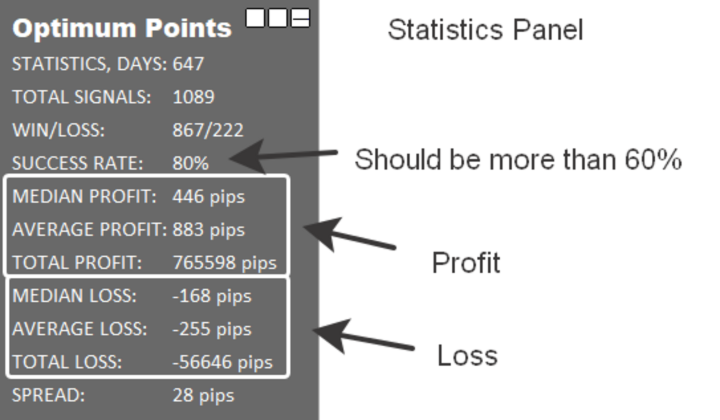
Pannello delle statistiche
- Numero di giorni da cui viene presa la cronologia dei segnali.
- Numero totale di segnali per i quali viene fornita una statistica.
- Rapporto tra il numero di segnali redditizi e non redditizi.
- Percentuale di segnali redditizi rispetto al numero totale di segnali.
- Profitto mediano per segnale.
- Profitto medio per segnale.
- Profitto totale per tutti i segnali.
- Perdita mediana per segnale.
- Perdita media per segnale.
- Perdita totale su tutti i segnali.
- Spread attuale.
Parametri delle impostazioni
| Period | sensibilità dell'indicatore, maggiore è la sensibilità, maggiore è il numero di segnali |
| M1-MN1 coincidences | selezione dei timeframe, sui quali vengono disegnate le frecce quando il trend coincide |
| Font size | dimensione del testo nel pannello delle statistiche |
| Show entry/exit points | attiva/disattiva la mostra i punti di entrata e di uscita |
| Use alert notification | attiva/disattiva la finestra pop-up di notifica e la notifica sonora |
| Use push notification | attiva/disattiva la notifica push |
Sentitevi liberi di inviarmi un messaggio privato per qualsiasi domanda o difficoltà.