• Genel bakış
  • İncelemeler
  • Yorumlar

Volatility Breakout Indicator

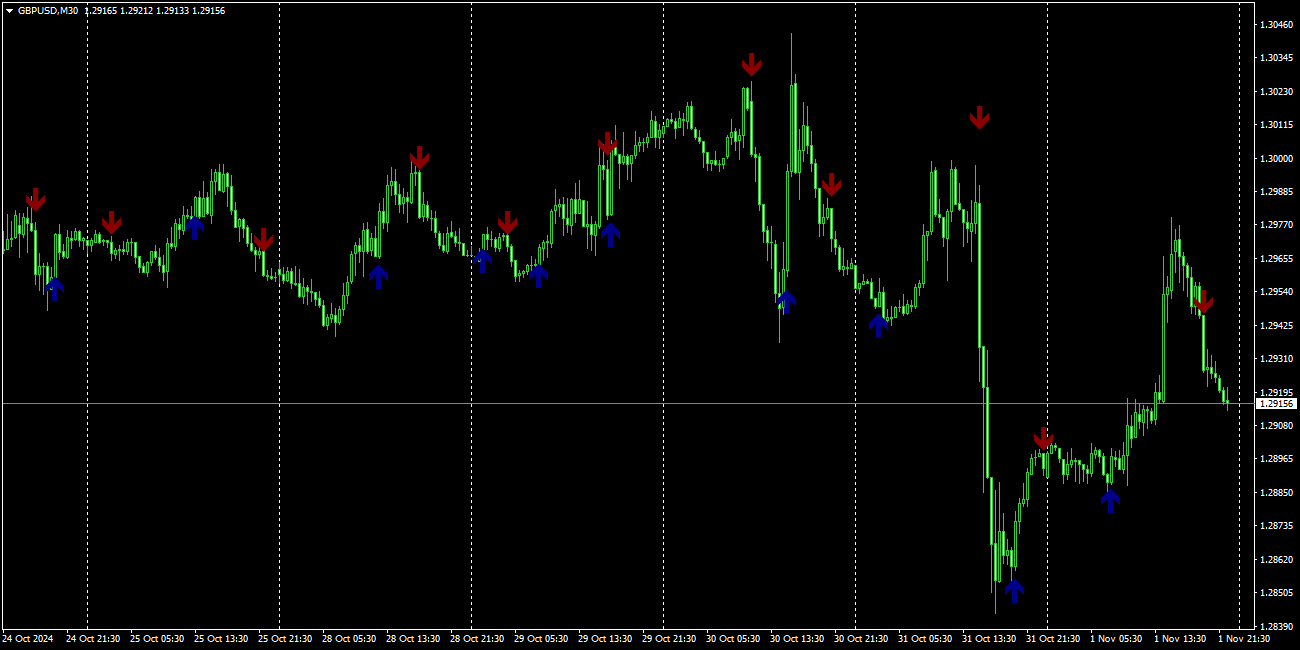
Volatilite Kırılma Göstergesi dönüm noktalarını belirleyen bir trend göstergesidir. Göstergenin çalışma prensibi başlangıçtaki trendin dönüş noktalarını bulmaya dayanmaktadır.
ATR volatilite göstergelerine dayandığı için çizgi geçişlerinde olduğu gibi fiyatın tersine dönmesini ve bir miktar ilerlemesini beklemez. ATR'ye endeksli volatilite tersine çevirme yöntemini kullanarak trend değişimini belirler.
Herhangi bir finansal araç ve zaman diliminde kullanılabilir.
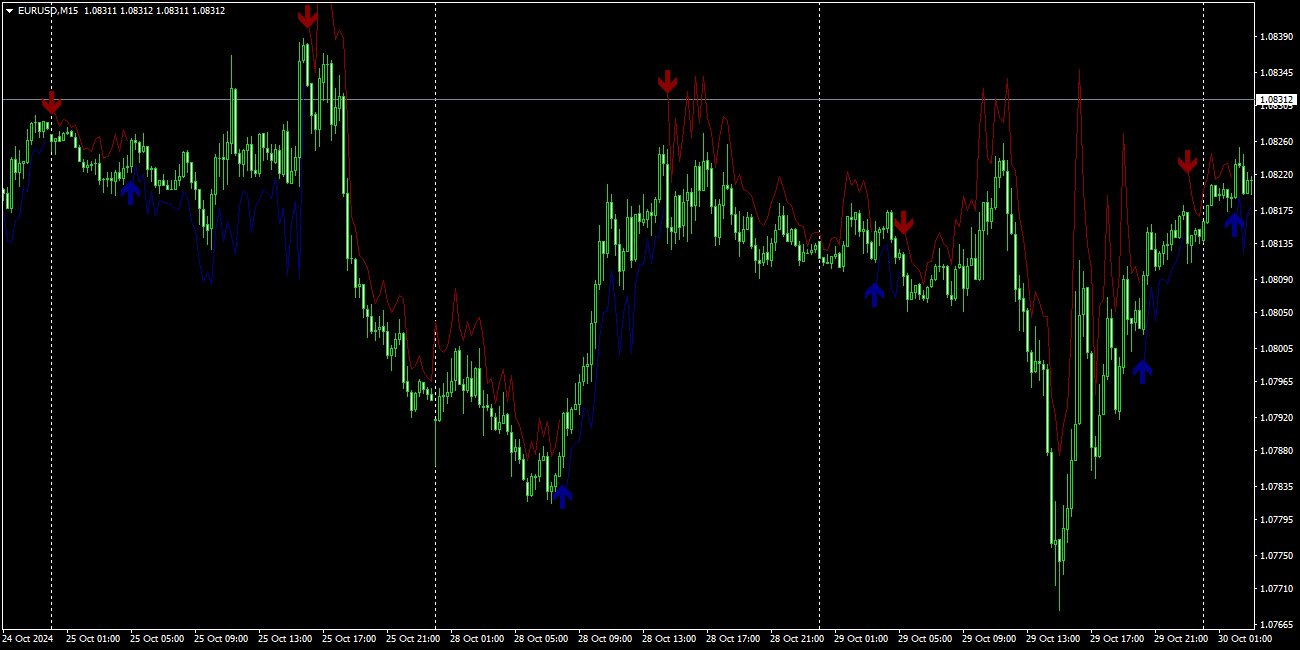
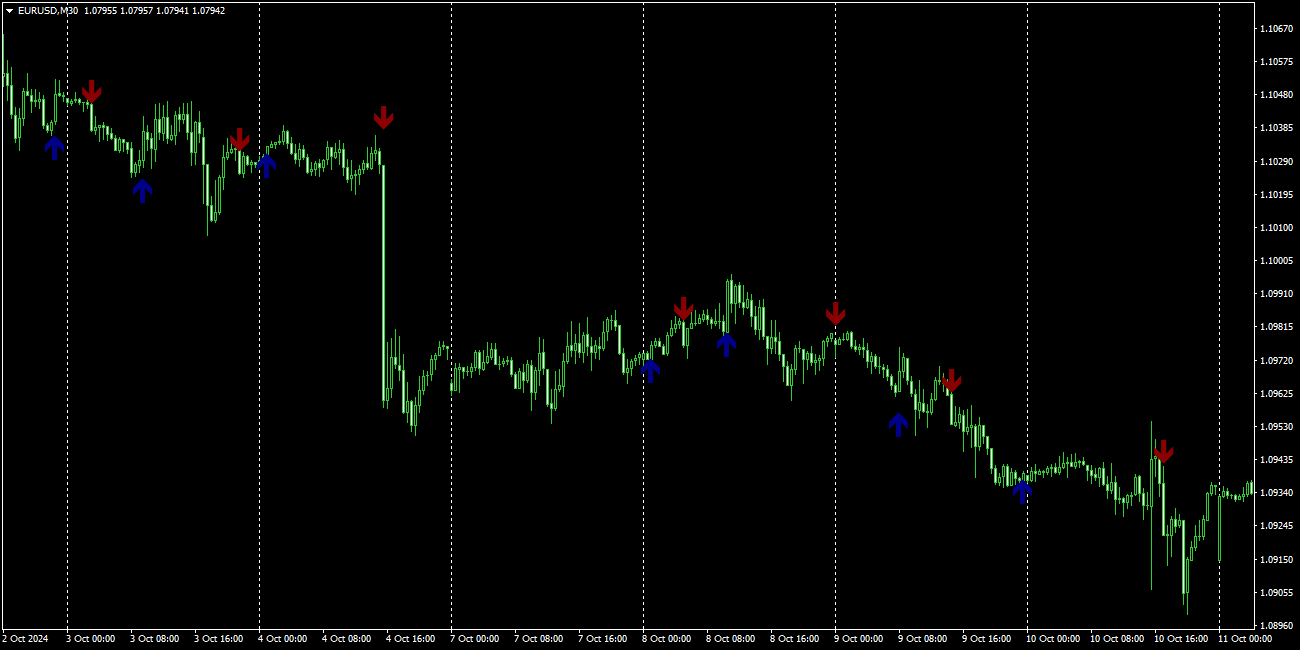
Oklar yalnızca mum kapandıktan sonra görünür ve asla yeniden renklenmez.
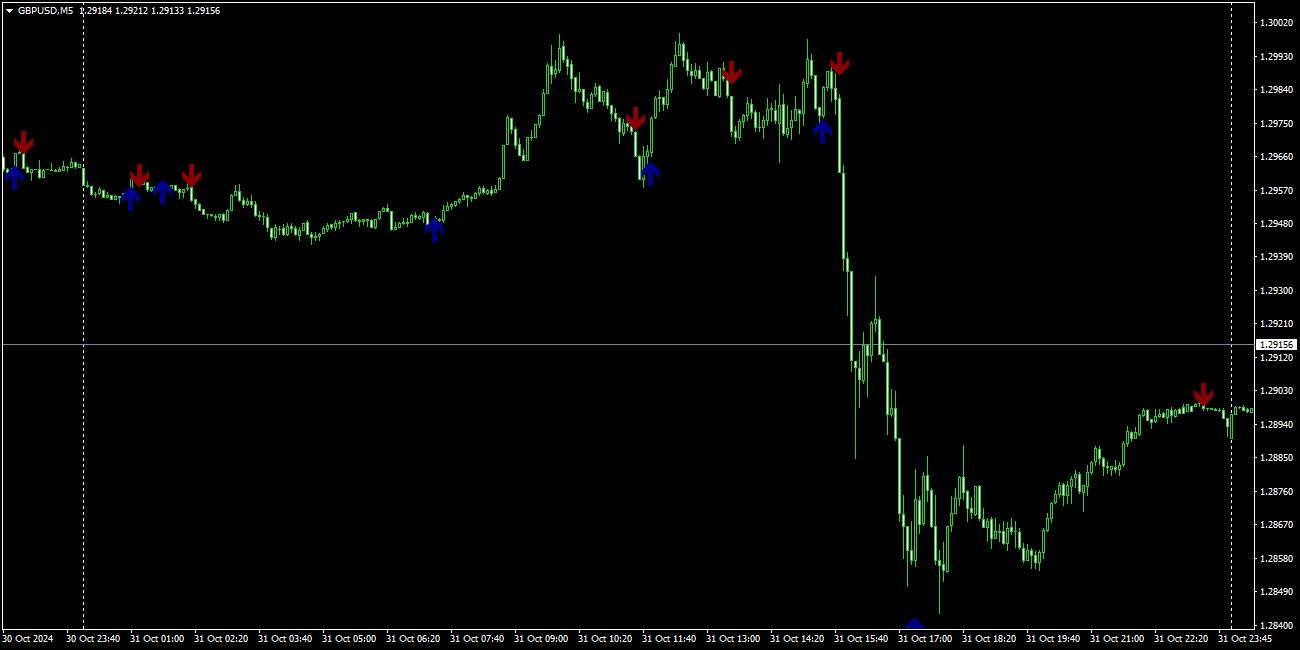
Bir veya iki zaman diliminde bağımsız bir gösterge olarak, H1 - H4 zaman dilimlerinde trendi belirlemek ve M5 - M15 zaman dilimlerinde açık emirler olarak kullanılabilir.
Oklar için çeşitli uyarı türleri içerir.
Mavi oklar - yukarı çevirin, Kırmızı oklar - aşağı çevirin. Çizgilerin görüntülenmesini açabilirsiniz.


Göstergenin çalışması, ticaret araçlarına ve zaman dilimlerine uyum sağlamak için değiştirilmesi gereken 2 parametre ile düzenlenir:


  1. Volatility Index (0,8-2) - trend dönüşlerinin sıklığını ayarlar (maksimum frekanstan minimuma)
  2. ATR period (1-100) - hesaplamalarda hangi ATR döneminin kullanılacağı (daha büyük bir dönem yumuşatma sağlar)
Önerilen ürünler
This indicator shows the levels and signal dots of the Doji pattern. The indicator allows traders to easily determine possible location of a price rebound. Doji is a candlestick with Open and Close price equal, or almost equal. It should also have shadows of approximately the same size on both sides. Doji denotes the balance between buyers and sellers, or the absence of major players, or level testing. This pattern can mean both a reversal and a continuation of the trend. Indicator Parameters I
CycleIdentifier
Amyr Shryf Mhmd Salh
The Cycle Identifier MT4 indicator is a great choice of custom indicator for both short-term and long-term traders. The Cycle Identifier MT4 generates filtered price action signals to assist traders to identify when the conditions are right to open buy and sell positions. How it works The Cycle Identifier MT4 indicator displays on a separate indicator chart below the main chart where it draws an oscillating gray line. This gray line is characterized by upward and downward spikes that are accompa
The indicator allows you to trade binary options. The recommended time frame is М1 and the expiration time is 1 minutes. The indicator suitable for auto and manual trading. A possible signal is specified as a arrows above/under a candle. You should wait until the candle closes! Arrows are not re-painted Trade sessions: London and New York section Currency pairs: AUD/CAD Working time frame: M1 Expiration time: 1 minute The indicator also shows good results when using the martingale strategy - "Ma
FREE
ProfRobotrading'in All Market Channels göstergesi, ekranda oluşan tüm işlem kanallarını otomatik olarak oluşturur ve görüntüler. Bu gösterge, mevcut tüm kanal stratejilerinde işlem yapmak için çok uygundur ve tüm enstrümanlara ve zaman dilimlerine uygulanabilir. Ekran görüntüsüne bakın - size daha fazlasını anlatacaktır :) ProfRoboTrading web sitemizde daha fazla bilgi mevcuttur. The All Market Channels indicator from ProfRobotrading automatically builds and displays all formed trading chann
Liquidity Buy Sell Signal Indicator is a no-nonsense, no delay, no repaint indicator ! Liquidity pools together with a trend filter is the most powerful and reliable signal according to me (with the correct parameters depending on the timeframe used) It selects buy/sell entry signals based on liquidity in the market. The time range to scan for liquidity can be set in the parameters. Liquidity is an important aspect in the market, especially for institutional investors, as they need lots of liqu
a novel indicator by the maker of velvet.                                                                                                                                                                                                                                                                                                                                                                                                                                                                           
FREE
Inside Bars
Paul Geirnaerdt
The Inside Bars indicator shows Inside Bars, the Breakout Zone and Breakouts thereof. Inside Bars are an important price action pattern. The price action of an Inside Bar is completely covered by the price action of the previous bar. Inside Bars are most often used on higher timeframes. Settings Inside Bars default settings are good enough most of the time. Feel free to fine tune them to your needs. ATR factor to skip large candles - very large candles should be filtered as they often cover othe
Smart Reversal Signal  is a professional indicator for the MetaTrader 4 platform; it has been developed by a group of professional traders. This indicator is designed for Forex and binary options trading. By purchasing this indicator, you will receive: Excellent indicator signals. Free product support. Regular updates. Various notification options: alert, push, emails. You can use it on any financial instrument (Forex, CFD, options) and timeframe. Indicator Parameters Perod - indicator calculat
One of the Price Action patterns called PinBar is implemented in a custom indicator. Usually means a large candle with a small body and a large tail. Such candles appear at the end of a movement or candles that indicate a continuation of the trend. The peculiarity of this PinBar indicator is that it determines the pattern on all timeframes. Information output by arrows is organized for the active timeframe and additionally for timeframes H1, H4, D1.
50+ Candlestick Patterns, Simulated Trading Results, Top Five Performers Candle Analysis extends Candlesticks Pattern Analysis by not only identifying Patterns but also recording the Past Performance of the Patterns. What it Does:- Identifies and plots results on chart Displays Top Patterns for both Bullish and Bearish type.  Log can be printed in experts tab to see Simulated Trading results Displays All or Selected Patterns Alerts on Pattern formation More detailed information in Blog
Upper and Lower Reversal - Tersine dönme anlarının erken tahminine yönelik sistem. Üst ve alt fiyat hareket kanallarının sınırlarında fiyat dönüm noktalarını bulmanızı sağlar. Gösterge asla sinyal oklarının konumunu yeniden renklendirmez veya değiştirmez. Kırmızı oklar alış sinyali, Mavi oklar ise satış sinyalidir. Herhangi bir zaman dilimine ve ticaret aracına göre ayarlanır Gösterge yeniden çizilmez, yalnızca mum kapandığında çalışır. Sinyaller için çeşitli uyarı türleri vardır Göstergenin k
Market Structure Zig Zag
Lesedi Oliver Seilane
4.63 (27)
Free Market structure zig zag to assist in price action trading the screenshots describe how to use and how to spot patterns new version comes with alerts, email alert and  push notification alert can be used on all pairs  can be used on all timeframes  you can add additional confirmation indicators the indicator shows you your higher high and low highs as well as your lower lows and lower highs  the indication makes price action analysis easier to spot.
FREE
This indicator Master XR indicator.Indicator displays trend movement. Indicator calculates automatically line. Features FiltPer - displays indicator period. deviation - displays indicator deviation. deviation2 - displays indicator deviation. How to understand the status: If (Timeframe M1-H1) FiltPer = 100; If ( Timeframe H4-MN) FiltPer = 5-20; ////////////////////////////////////////////////////////////////////////////////////////////////////////////////////////////////////////////////////// //
Bu göstergenin amacı, tüm zaman dilimlerinde Murray seviyelerini bulmak ve bunları güçlü Murray seviyelerine (+2, +1, 8, 4, 0, -1, -2) dayalı sinyal seviyelerini içeren birleşik seviyeler halinde birleştirmektir. Zaman dilimi ne kadar küçük olursa, birleşik seviyeyi hemen görme şansınız o kadar artar. Renkli olarak vurgulanacaktır. İmleci herhangi bir sayının üzerine getirirseniz, seviyenin hangi zaman dilimine ait olduğuna dair bir araç ipucu görünecektir. Ancak her zaman en solda geçerli zaman
Trend Scanner looks at the Market watchlist and Checks to see if there are trending cases between three (3) timeframes selected by the user. The analysis can assist in finding pairs to focus on for a particular session where a trader may need to have a bias in terms of direction to place trades for a particular system which requires multiple timeframe filtration of bar momentum. 3 Main indicators are involved: Moving Average, MACD and Heiken Ashi. User is able to select timeframes available on
Witch Hat for Binary Options is an indicator for binary options based on analysis of Bollinger Bands and RSI, using a modulated strategy with indicator settings using complex filters. This indicator never repaints, it has an almost accurate answer for you to make the entries. There are two ways for you to analyze your entry, when an arrow appears you have more than 90% chance of hits, and the other way is the lines that it automatically draws and its trend line. It has surprisingly strong sup
Ligma binary
Tanzid Ahmed Chonchol
The Ligma Binary Indicator is a sophisticated tool designed to assist traders in identifying key price action patterns that offer high-probability trade opportunities. This indicator is based on a unique strategy that detects isolated candles or “lonely” candles, which occur in trending markets and are often followed by strong price reversals or continuations. Key Features: Trend Detection: The indicator uses a Simple Moving Average (SMA) to identify the prevailing market trend (uptrend or downt
Chart Patterns Detect 15 patterns (Ascending Triangle, Descending Triangle, Rising Wedge, Falling Wedge, Bullish Flag, Bearish Flag, Bullish Rectangle, Bearish Rectangle Symmetrical triangle, Head and Shoulders, Inverted Head and Shoulders, Triple top, Triple Bottom, Double Top, Double Bottom) Use historical data to calculate the probability of each pattern to succeed (possibility to filter notification according to the chance of success) gives graphic indication about the invalidation level and
Özellikle scalping için tasarlanmış, volatilite dürtülerini tanımlayabilen ve sürelerini gösterebilen teknik bir gösterge. Göstergenin işlevselliğini herhangi bir ticaret aracına uygulamanıza olanak tanıyan, manuel ayarlar için esnek parametrelere sahiptir. Kullanılması Önerilen Zaman Çerçeveleri M5, M15, M30, H1 ve H4'tür. Birkaç tür uyarı vardır. Mumun kapanışında tüm sinyaller asla değişmez veya yeniden renklenmez. Gösterge yukarıdan aşağıya parametrelerle yapılandırılır. Trend Length - Aşa
The main idea of this indicator is rates analysis and prediction by Fourier transform. Indicator decomposes exchange rates into main harmonics and calculates their product in future. You may use the indicator as a standalone product, but for better prediction accuracy there is another related indicator - FreqoMaster - which uses FreqoMeterForecast as a backend engine and combines several instances of FreqoMeterForecast for different frequency bands. Parameters: iPeriod - number of bars in the ma
KT Horizontal Lines MT4
KEENBASE SOFTWARE SOLUTIONS
In MetaTrader, plotting multiple   horizontal lines   and then tracking their respective price levels can be a hassle. This indicator automatically plots multiple horizontal lines at equal intervals for setting price alerts, plotting support and resistance levels, and other manual purposes. This indicator is suitable for Forex traders who are new and looking for chances to make quick profits from buying and selling. Horizontal lines can help traders find possible areas to start trading when the
MultiCurrency Indicators is a multi-currency indicator which calculates the values of multiple standard indicators for each of the 8 major currencies: EUR, GBP, AUD, NZD, USD, CAD, CHF, JPY. Advantages of the indicator Calculation is performed for 8 virtual charts of the currencies: EUR, GBP, AUD, NZD, USD, CAD, CHF, JPY; Show the currency strength, which does not depend on the currency pair; It allows determining the strongest and the weakest currencies at any moment, it also sorts currencies
ADX arrow N
Pavel Shutovskiy
ADX arrow Bu gösterge, ADX göstergesinin sinyallerini (Ortalama Yön Hareket İndeksi) grafikte nokta olarak görüntüler. Bu, sinyallerin görsel olarak tanımlanmasını kolaylaştırır. Göstergede ayrıca uyarılar (açılır mesaj kutuları) ve e-postaya sinyal gönderme bulunur. Parametre: Period  - ortalama süresi. Apply to  - hesaplamalar için kullanılan fiyat: Close, Open, High, Low, Median (high+low)/2, Typical (high+low+close)/3, Weighted Close (high+low+close+close)/4. Alert  - uyarıları etkinleşt
Smart Line is a trend indicator. It helps you find trend reversal points. This trading strategy is designed for trend trading. The indicator algorithm accurately determines the trend on various trading instruments, at different time intervals. The Smart Line indicator can be used as an additional tool, or as the main one. The color of the indicator lines changes depending on the current trend, as well as built-in indicators of possible entries in the position, indicated by arrows. Parameters
Reverse Martingale, also known as the "Paroli" betting system, is a gambling strategy used primarily in games of chance such as roulette, blackjack, or even sports betting. Unlike the traditional Martingale system, where a player doubles their bet after a loss, the Reverse Martingale involves increasing the bet after a win and reducing it after a loss. This strategy is often employed by individuals hoping to take advantage of winning streaks and capitalize on short-term gains. Here's how the Rev
Future Candle One Candle is an arrow indicator of candlestick patterns, based on the calculation of historical statistics. It identifies and calculates patterns consisting of one candle. Advantages of the indicator Gives information about the next candle right now; The indicator values are based on statistical data on the history of the current instrument; Forecasts and displays the result of trading based on its signals; The colors of the indicator have been selected for a comfortable operatio
Standard Trend Lines (Automatic). This indicator draws highly accurate trend lines. It draws Trend Lines automatically. This Trend Lines indicator was made by observing lot of discussions made about Trend Lines in forum. The Trend Lines can also be used to create Expert Advisor. Latest valid Trend Lines are drawn on Chart. Trend Lines Work on basis of OHLC price data.
Follow The Line PRO
Oliver Gideon Amofa Appiah
3.67 (3)
FOLLOW THE LINE (PRO VERSION) This powerful indicator is the full and complete version of my free indicator called "Follow The Line". IT IS BASED ON the popular maxim that: "THE TREND IS YOUR FRIEND" It gives alarms and alerts of all kinds. IT DOES NOT REPAINT and can be used for all currency pairs and timeframes. AVOID FALSE SIGNALS: BUY ONLY when price closes above the green line and the green line is above the blue channel. SELL ONLY when price closes below the pink line and the pink line i
Future Candle Two Candle is an arrow indicator of candlestick patterns, based on the calculation of historical statistics. It identifies and calculates patterns consisting of two candles. Advantages of the indicator Gives information about the next candle right now; The indicator values are based on statistical data on the history of the current instrument; Forecasts and displays the result of trading based on its signals; The colors of the indicator have been selected for a comfortable operati
Future Candle Three Candle is an arrow indicator of candlestick patterns, based on the calculation of historical statistics. It identifies and calculates patterns consisting of three candles. Advantages of the indicator Gives information about the next candle right now; The indicator values are based on statistical data on the history of the current instrument; Forecasts and displays the result of trading based on its signals; The colors of the indicator have been selected for a comfortable ope
Bu ürünün alıcıları ayrıca şunları da satın alıyor
Gann Made Easy
Oleg Rodin
4.79 (112)
Gann Made Easy , bay teorisini kullanarak ticaretin en iyi ilkelerine dayanan, profesyonel ve kullanımı kolay bir Forex ticaret sistemidir. WD Gann. Gösterge, Zararı Durdur ve Kâr Al Seviyeleri dahil olmak üzere doğru SATIN AL ve SAT sinyalleri sağlar. PUSH bildirimlerini kullanarak hareket halindeyken bile işlem yapabilirsiniz. Lütfen satın aldıktan sonra benimle iletişime geçin! Alım satım ipuçlarımı ve harika bonus göstergelerini ücretsiz olarak sizinle paylaşacağım! Muhtemelen Gann ticaret y
Dynamic Forex28 Navigator
Bernhard Schweigert
5 (4)
Dynamic Forex28 Navigator - Yeni Nesil Forex Ticaret Aracı. ŞU ANDA %49 İNDİRİM. Dynamic Forex28 Navigator, uzun zamandır popüler olan göstergelerimizin evrimidir ve üçünün gücünü tek bir göstergede birleştirir: Gelişmiş Döviz Gücü28 Göstergesi (695 inceleme) + Gelişmiş Döviz İMPULS ve UYARI (520 inceleme) + CS28 Kombo Sinyalleri (Bonus). Gösterge hakkında ayrıntılar https://www.mql5.com/en/blogs/post/758844 Yeni Nesil Güç Göstergesi Ne Sunuyor?  Orijinallerde sevdiğiniz her şey, şimdi yeni
Gold Stuff
Vasiliy Strukov
4.86 (249)
Gold Stuff, özellikle altın için tasarlanmış bir trend göstergesidir ve herhangi bir finansal enstrümanda da kullanılabilir. Gösterge yeniden çizilmez ve gecikmez. Önerilen zaman dilimi H1. Bu göstergede tam otomatik Uzman Danışman EA Gold Stuff çalışır. Profilimde bulabilirsiniz. Ayarları ve kişisel bir bonusu almak için satın alma işleminden hemen sonra benimle iletişime geçin!  Güçlü Destek ve Trend Tarayıcı göstergemizin ücretsiz bir kopyasını pm'den alabilirsiniz. Ben! AYARLAR Ok Çiz -
-   Real price is 80$   - 40% Discount ( It is 49$ now ) - Lifetime update free Contact me for instruction, add group and any questions! Related Products:  Bitcoin Expert , Gold Expert - Non-repaint - I just sell my products in Elif Kaya profile, any other websites are stolen old versions, So no any new updates or support. Introduction The breakout and retest strategy is traded support and resistance levels. it involves price breaking through a previous level.  The break and retest strategy is
Gold Venamax MT4
Sergei Linskii
5 (1)
Gold Venamax   - bu en iyi hisse senedi teknik göstergesidir. Gösterge algoritması bir varlığın fiyat hareketini analiz eder ve oynaklığı ve potansiyel giriş bölgelerini yansıtır. Gösterge özellikleri: Bu, rahat ve karlı ticaret için Magic ve iki Blok trend oku içeren süper bir göstergedir. Grafikte blokları değiştirmek için Kırmızı Düğme görüntülenir. Magic, gösterge ayarlarında ayarlanır, böylece göstergeyi farklı Blokları görüntüleyen iki grafiğe yükleyebilirsiniz. Gold Venamax farklı ok t
Lux Trend
Mohamed Hassan
5 (3)
After purchase, please contact me to get your trading tips + more information for a great bonus!   Lux Trend is a professional strategy based on using Higher Highs and Lower Highs to identify and draw Trendline Breakouts! Lux Trend  utilizes two Moving Averages to confirm the overall trend direction before scanning the market for high-quality breakout opportunities, ensuring more accurate and reliable trade signals. This is a proven trading system used by real traders worldwide, demonstrating
Scalper Inside PRO
Alexey Minkov
4.76 (63)
!SPECIAL SALE! An exclusive indicator that utilizes an innovative algorithm to swiftly and accurately determine the market trend. The indicator automatically calculates opening, closing, and profit levels, providing detailed trading statistics. With these features, you can choose the most appropriate trading instrument for the current market conditions. Additionally, you can easily integrate your own arrow indicators into Scalper Inside Pro to quickly evaluate their statistics and profitability
Currency Strength Wizard , başarılı ticaret için size hepsi bir arada çözüm sağlayan çok güçlü bir göstergedir. Gösterge, birden çok zaman dilimindeki tüm para birimlerinin verilerini kullanarak şu veya bu forex çiftinin gücünü hesaplar. Bu veriler, şu veya bu para biriminin gücünü görmek için kullanabileceğiniz, kullanımı kolay para birimi endeksi ve para birimi güç hatları biçiminde temsil edilir. İhtiyacınız olan tek şey, işlem yapmak istediğiniz tabloya göstergeyi eklemektir ve gösterge size
Golden Trend Indicator
Noha Mohamed Fathy Younes Badr
4.9 (10)
Golden Trend indicator  is The best indicator for predicting trend movement this indicator never lags and never repaints and never back paints    and give  arrow buy and sell    before the candle appear  and it will help you and  will make your trading decisions clearer its work on all currencies and  gold and crypto and all time frame This unique  indicator uses very secret algorithms to catch the  trends, so you can trade using this indicator and see the trend clear on charts  manual guide and
FX Levels MT4
Daniel Stein
5 (2)
FX Levels: Tüm Piyasalar İçin Son Derece Hassas Destek ve Direnç Hızlı Bakış Döviz kurları, endeksler, hisseler veya emtialar gibi herhangi bir piyasada güvenilir destek ve direnç seviyeleri belirlemek mi istiyorsunuz? FX Levels geleneksel “Lighthouse” yöntemini ileri düzey bir dinamik yaklaşımla birleştirerek neredeyse evrensel bir doğruluk sağlar. Gerçek broker deneyimimize ve otomatik günlük güncellemeler ile gerçek zamanlı güncellemelerin birleşimine dayalı olarak, FX Levels size dönüş nok
Smart Set up Levels
Mohit Dhariwal
5 (1)
Smart Set up leve l is a very powerful indicator based on the concept of order blocks and set up entries with proper fvg and breakouts to make a very nice level to enter like a pro trader. Very easy to use interface and friendly to enter on buy and sell signals. Works Best on M15 Time frame on Gold, Bitcoin and Fx pairs. Daily 4-5 trades on each pair  Works great on gold like a pro on M15 It is non repainting nor lagging It is very powerful indicator giving precise entries and prop acts can be c
Scalper Vault
Oleg Rodin
5 (29)
Scalper Vault , başarılı bir scalping için ihtiyacınız olan her şeyi size sağlayan profesyonel bir scalping sistemidir. Bu gösterge, forex ve ikili opsiyon tüccarları tarafından kullanılabilecek eksiksiz bir ticaret sistemidir. Önerilen zaman çerçevesi M5'tir. Sistem size trend yönünde doğru ok sinyalleri sağlar. Ayrıca size üst ve alt sinyaller ve Gann piyasa seviyeleri sağlar. Göstergeler, PUSH bildirimleri dahil her türlü uyarıyı sağlar. Göstergeyi satın aldıktan sonra lütfen benimle iletişim
IX Power MT4
Daniel Stein
4.71 (7)
IX Power: Endeksler, Emtialar, Kripto Paralar ve Forex Piyasaları için İçgörüler Genel Bakış IX Power , endeksler, emtialar, kripto paralar ve forex sembollerinin gücünü analiz etmek için tasarlanmış çok yönlü bir araçtır. FX Power , tüm kullanılabilir döviz çiftlerinin verilerini kullanarak döviz çiftleri için maksimum doğruluk sağlarken, IX Power yalnızca temel sembolün piyasa verilerine odaklanır. Bu, IX Power 'ı forex dışındaki piyasalar için ideal ve daha basit forex analizleri için güven
MTF Supply Demand Zones
Georgios Kalomoiropoulos
4.83 (23)
Yeni Nesil Otomatik Arz ve Talep Bölgeleri. Her Grafikte Çalışan Yeni ve Yenilikçi Algoritma. Tüm Bölgeler Piyasanın Fiyat Hareketine Göre Dinamik Olarak Oluşturulmaktadır. İKİ TÜR UYARI --> 1) FİYAT BİR BÖLGEYE ÇIKTIĞINDA 2) YENİ BİR BÖLGE OLUŞTURDUĞUNDA Bir tane daha işe yaramaz gösterge almazsın. Kanıtlanmış Sonuçlarla eksiksiz bir Ticaret Stratejisi elde edersiniz.     Yeni özellikler:     Fiyat Arz/Talep Bölgesine ulaştığında uyarılar     Yeni bir Arz/Talep Bölgesi oluşturulduğunda
Easy Breakout
Mohamed Hassan
5 (9)
After your purchase, feel free to contact me for more details on how to receive a bonus indicator called VFI, which pairs perfectly with Easy Breakout for enhanced confluence!   Easy Breakout is a powerful price action trading system built on one of the most popular and widely trusted strategies among traders: the Breakout strategy ! This indicator delivers crystal-clear Buy and Sell signals based on breakouts from key support and resistance zones. Unlike typical breakout indicators, it levera
PRO Renko Sistemi, RENKO grafikleri ticareti için özel olarak tasarlanmış son derece hassas bir ticaret sistemidir. Bu, çeşitli ticaret araçlarına uygulanabilen evrensel bir sistemdir. Sistemi etkin piyasa sana doğru ters sinyallerine erişim hakkı denilen ses nötralize eder. Göstergenin kullanımı çok kolaydır ve sinyal üretiminden sorumlu tek bir parametreye sahiptir. Aracı, seçtiğiniz herhangi bir ticaret aracına ve renko çubuğunun boyutuna kolayca uyarlayabilirsiniz. Yazılımımla karlı bir
FX Volume
Daniel Stein
4.59 (34)
FX Volume: Bir Broker’ın Perspektifinden Gerçek Piyasa Duyarlılığını Deneyimleyin Kısa Özet Trading yaklaşımınızı bir adım öteye taşımak ister misiniz? FX Volume , perakende traderlar ile brokerların nasıl konumlandığını gerçek zamanlı olarak sunar—COT gibi gecikmeli raporlardan çok daha önce. İster istikrarlı kazançları hedefliyor olun, ister piyasada daha güçlü bir avantaj arayın, FX Volume önemli dengesizlikleri belirlemenize, kırılmaları (breakout) doğrulamanıza ve risk yönetiminizi iyileş
Altın Trend   - bu iyi bir hisse senedi teknik göstergesidir. Gösterge algoritması, bir varlığın fiyat hareketini analiz eder ve oynaklığı ve potansiyel giriş bölgelerini yansıtır. En iyi gösterge sinyalleri: - SATIŞ için = kırmızı histogram + kırmızı KISA işaretçi + aynı yönde sarı sinyal oku. - AL için = mavi histogram + mavi UZUN işaretçi + aynı yönde aqua sinyal oku. Göstergenin faydaları: 1. Gösterge yüksek doğrulukta sinyaller üretir. 2. Onaylanmış bir ok sinyali yalnızca trend deği
Özel MT4 göstergemizle başarılı forex ticaretinin sırrını keşfedin! Forex piyasasında nasıl başarıya ulaşacağınızı hiç merak ettiniz, riski en aza indirirken sürekli olarak kar kazandınız mı? İşte aradığınız cevap! Ticaret yaklaşımınızda devrim yaratacak tescilli MT4 göstergimizi tanıtmamıza izin verin. Benzersiz çok yönlülük Göstergemiz, Renko ve RangeBar Mum oluşumlarını tercih eden kullanıcılar için özel olarak tasarlanmıştır. Bu grafik türlerinin birçok deneyimli tüccar tarafından tercih e
Beast Super Signal
Dustin Vlok
4.73 (89)
Kârlı ticaret fırsatlarını kolaylıkla belirlemenize yardımcı olabilecek güçlü bir forex ticaret göstergesi mi arıyorsunuz? Beast Super Signal'den başka bir yere bakmayın. Bu kullanımı kolay trend tabanlı gösterge, sürekli olarak piyasa koşullarını izleyerek yeni gelişen trendleri araştırır veya mevcut trendlere atlar. Canavar Süper Sinyali, tüm dahili stratejiler birbiriyle uyumlu ve %100 örtüştüğünde bir al ya da sat sinyali vererek ek onay ihtiyacını ortadan kaldırır. Sinyal oku uyarısını aldı
Sizlere ON Trade Waves Patterns Harmonic Elliot Wolfe'u tanıtmaktan mutluluk duyarız. Bu, manuel ve otomatik yöntemleri kullanarak piyasada çeşitli desenleri tespit etmek için tasarlanmış gelişmiş bir göstergedir. İşte nasıl çalıştığı: Harmonik Desenler: Bu gösterge, grafiğinizde görünen harmonik desenleri tanımlayabilir. Bu desenler, Scott Carney'in "Harmonic Trading vol 1 & 2" adlı kitabında açıklandığı gibi harmonik ticaret teorisini uygulayan tüccarlar için önemlidir. Onları manuel olarak ç
System Trend Pro
Aleksandr Makarov
5 (2)
System Trend Pro - This is the best trend trading indicator!!! You can get this indicator for free -  Quantum Entry PRO The indicator no repaint!!!  The indicator has   MTF   mode, which adds confidence to trading on the trend (   no repaint   ). How to trade? Everything is very simple, we wait for the first signal (big arrow), then wait for the second signal (small arrow) and enter the market in the direction of the arrow. (See screens 1 and 2.) Exit on the opposite signal or take 20-30 pips
FX Power MT4 NG
Daniel Stein
4.94 (18)
FX Power: Daha Akıllı Ticaret Kararları için Para Birimlerinin Gücünü Analiz Edin Genel Bakış FX Power , her piyasa koşulunda başlıca para birimlerinin ve altının gerçek gücünü anlamak için vazgeçilmez bir araçtır. Güçlü para birimlerini alıp zayıf olanları satarak, FX Power ticaret kararlarınızı basitleştirir ve yüksek olasılıklı fırsatları ortaya çıkarır. İster trendlere sadık kalın ister Delta'nın aşırı değerlerini kullanarak tersine dönüşleri öngörün, bu araç ticaret tarzınıza mükemmel bir
M1 Arrow
Oleg Rodin
5 (16)
Piyasanın iki temel ilkesine dayanan bir gün içi stratejisi. Algoritma, ek filtreler kullanarak hacimlerin ve fiyat dalgalarının analizine dayanmaktadır. Göstergenin akıllı algoritması, yalnızca iki piyasa faktörü bir araya geldiğinde bir sinyal verir. Gösterge, daha yüksek zaman çerçevesinin verilerini kullanarak M1 grafiğinde belirli bir aralıktaki dalgaları hesaplar. Ve dalgayı doğrulamak için gösterge, hacme göre analizi kullanır. Bu gösterge hazır bir ticaret sistemidir. Bir tüccarın ihtiya
MetaBands M4
Vahidreza Heidar Gholami
5 (3)
MetaBands uses powerful and unique algorithms to draw channels and detect trends so that it can provide traders with potential points for entering and exiting trades. It’s a channel indicator plus a powerful trend indicator. It includes different types of channels which can be merged to create new channels simply by using the input parameters. MetaBands uses all types of alerts to notify users about market events. Features Supports most of the channel algorithms Powerful trend detection algorith
Enigmera
Ivan Stefanov
5 (7)
ENIGMERA: Pazarın Kalbi Önemli: MQL5.com demosu Strategy Tester'da çalışır ve Enigmera'nın tüm işlevlerini tam olarak yansıtmayabilir. Daha fazla bilgi için açıklamayı, ekran görüntülerini ve videoyu kontrol edin. Herhangi bir sorunuz varsa, bana mesaj göndermekten çekinmeyin! Göstergenin kodu tamamen yeniden yazılmıştır. 3.0 sürümü, yeni işlevler ekler ve göstergenin başlangıcından bu yana biriken hataları giderir. Giriş Bu gösterge ve ticaret sistemi, finansal piyasalara dikkat çekici bir ya
Advanced Supply Demand
Bernhard Schweigert
4.91 (294)
CURRENTLY 26% OFF !! Best Solution for any Newbie or Expert Trader! This indicator is a unique, high quality and affordable trading tool because we have incorporated a number of proprietary features and a new formula. With this update, you will be able to show double timeframe zones. You will not only be able to show a higher TF but to show both, the chart TF, PLUS the higher TF: SHOWING NESTED ZONES. All Supply Demand traders will love it. :) Important Information Revealed Maximize the potentia
Apollo BuySell Predictor , birkaç ticaret modülü içeren profesyonel bir ticaret sistemidir. Bir tüccara benzersiz kırılma bölgeleri, fibonacci tabanlı destek ve direnç seviyeleri, pivot trend çizgisi, geri çekilme hacmi sinyalleri ve herhangi bir tüccarın günlük olarak ihtiyaç duyduğu diğer yararlı özellikleri sağlar. Sistem herhangi bir çift ile çalışacaktır. Önerilen zaman dilimleri M30, H1, H4'tür. Gösterge, H4'ten daha yüksek zaman dilimleri dışında diğer zaman dilimleriyle de çalışabilir. B
Supply Demand Analyzer
Suvashish Halder
5 (5)
Supply Demand Analyzer is an advanced trading indicator meticulously designed for the precise identification, analysis, and management of supply and demand zones. By integrating real-time data and advanced algorithms, this tool enables traders to recognize market phases, price movements, and structural patterns with unparalleled accuracy. It simplifies complex market dynamics into actionable insights, empowering traders to anticipate market behavior, identify trading opportunities, and make info
Trend Screener
STE S.S.COMPANY
4.78 (93)
Trend Göstergesi, Trend Alım Satım ve Filtreleme için Çığır Açan Benzersiz Çözüm, Tüm Önemli Trend Özellikleriyle Tek Bir Araç İçinde Yerleştirildi! Forex, emtialar, kripto para birimleri, endeksler ve hisse senetleri gibi tüm sembollerde/araçlarda kullanılabilen %100 yeniden boyamayan çoklu zaman çerçevesi ve Çoklu para birimi göstergesidir. SINIRLI SÜRELİ TEKLİF: Destek ve Direnç Tarama Göstergesi sadece 50$ ve ömür boyu mevcuttur. (Orijinal fiyat 250$) (teklif uzatıldı) Trend Screener, grafik
Yazarın diğer ürünleri
Trend göstergeleri, finansal piyasalarda işlem yaparken kullanılan teknik analiz alanlarından biridir. Angular Trend Lines indikatörü - trend yönünü kapsamlı bir şekilde belirler ve giriş sinyalleri üretir. Mumların ortalama yönünü yumuşatmanın yanı sıra Trend çizgilerinin eğim açısından da yararlanılır. Eğim açısının hesaplanmasında Gann açılarının inşa ilkesi esas alındı. Teknik analiz göstergesi mum çubuğu yumuşatması ile grafik geometrisini birleştirir. İki tür trend çizgisi ve ok vardır: K
Grafikleri yapılandıran ve döngüsel fiyat hareketlerini belirleyen teknik bir gösterge. Herhangi bir grafik üzerinde çalışabilirim. Birkaç çeşit bildirim var. Grafiğin kendisinde ek oklar var. Tarihe yeniden bakmadan, mumun kapanışına dair çalışmalar. M5 ve üzeri TF önerilir. Kullanımı ve yapılandırması kolay parametreler. Farklı parametrelere sahip 2 indikatörü kullanırken, bunları diğer indikatörler olmadan da kullanabilirsiniz. 2 giriş parametresi vardır Döngüsellik ve Sinyal Süresi Bu 2 pa
Point Trend Indicator - Trendin yönünü belirleyebilen ve güçlendiğini gösterebilen, trendin üst ve alt seviyelerinin göstergesi. Trend yönü yuvarlak noktalarla belirlenir; noktalar sıfır çizgisinin üzerindeyse trend yükseliş, altındaysa trend düşüş yönündedir. Yön hareketindeki artış oklarla gösterilmiştir. Manuel ayarlama için tek parametreye sahiptir - Trend yönünün süresi.   Olasılıklar Tüm zaman dilimlerinde çalışır Her türlü finansal araca uyum sağlar (Forex, Hisse Senetleri, Metaller, Kri
Volatility Trend System - girişler için sinyaller veren bir ticaret sistemi. Oynaklık sistemi, trend yönünde doğrusal ve noktasal sinyaller ve ayrıca yeniden çizme ve gecikme olmaksızın trendden çıkmak için sinyaller verir. Trend göstergesi, orta vadeli trendin yönünü izler, yönünü ve değişimini gösterir. Sinyal göstergesi volatilitedeki değişikliklere dayalıdır ve piyasa girişlerini gösterir. Gösterge, çeşitli uyarı türleri ile donatılmıştır. Çeşitli alım satım araçlarına ve zaman dilimlerine
Forex için manuel ticaret ve teknik analiz göstergesi. İşlem gününün açılış seviyesini gösteren bir trend göstergesi ve giriş noktalarını belirlemek için bir ok göstergesinden oluşur. Gösterge yeniden renklenmez; mum kapandığında çalışır. Sinyal okları için çeşitli uyarı türleri içerir. Herhangi bir grafikte, alım satım aracında veya zaman diliminde çalışacak şekilde yapılandırılabilir. Çalışma stratejisi trend boyunca fiyat hareketlerini aramaya dayanmaktadır.  " Buy " işlemleri yapabilmek
Wave Reversal Indicator - denge çizgisi etrafındaki yön ve fiyat dönüşlerini belirler. Gösterge dalga hareketlerini ve trend artışlarını gösterir. Tüccarın nerede takip edileceğine dair tavsiyeler verir, ticaret stratejisinin takip edilmesine yardımcı olur. Gün içi veya orta vadeli bir stratejiye ektir. Hemen hemen tüm parametreler her zaman dilimi için seçilir ve otomatik olarak değişir; manuel ayarlama için tek parametre dalga boyudur. M5, M15, M30, H1, H4'ü kullanmak için en uygun zaman dili
FREE
Scalping Entry Points - fiyat hareketlerine uyum sağlayabilen ve yeniden çizmeden alım satımları açmak için sinyaller verebilen manuel bir alım satım sistemidir. Gösterge, merkezi destek ve direnç seviyesine göre trendin yönünü belirler. Nokta göstergesi, girişler ve çıkışlar için sinyaller sağlar. Manuel gün içi ticaret, ölçeklendirme ve ikili opsiyonlar için uygundur. Tüm zaman dilimlerinde ve ticaret enstrümanlarında çalışır. Gösterge birkaç türde uyarı verir. ürün nasıl kullanılır Mavi çiz
Volatility Trend System , girişler için sinyaller sağlayan bir ticaret sistemidir. Volatilite sistemi, trend yönünde doğrusal ve nokta sinyallerinin yanı sıra, yeniden çizme veya gecikme olmadan trendden çıkış sinyallerini de verir. Trend göstergesi orta vadeli trendin yönünü izler, yönünü ve değişimini gösterir. Sinyal göstergesi oynaklıktaki değişikliklere dayanır ve piyasaya girişleri gösterir. Gösterge çeşitli uyarı türleri ile donatılmıştır. Çeşitli ticaret araçlarına ve zaman dilimlerine
An indicator that determines the point levels of price resistance. The arrows indicate price bounces in the indicated directions. Arrows are not redrawn formed on the current candle, shown on the previous candle for convenience.      It has one setting - the formation intensity: If the parameter is smaller, most of the signals are formed in a wide trend. If the parameter is larger, signals are formed in a narrower trend. Input parameters Formation Intensity - Arrow Formation Intensity Number B
Line Breakouts - Trend ticareti için sistem. Dönem ve düzeltme işlevi kullanılarak herhangi bir grafiğe ve ticaret aracına uyarlanabilecek bir trend tanımlayıcı içerir. Ve destek ve direnç seviyelerinin belirleyicisi. Fiyat direnç çizgisinin altında olduğunda Satış işlemlerini açın ve fiyat destek çizgisinin üzerinde olduğunda Alım işlemlerini açın. Zararı durdur çizgilerden birkaç noktaya yerleştirilmelidir, Kâr Al zaman dilimine göre birkaç mumdan (3-10-15) sonra sabitlenmelidir. Gösterge yeni
Arrow indicator with trend filter. Generates trend input without delays or delays - on the emerging candle. Suitable for use on any trading tools and timeframes. Easy to use, contains the direction of the trend in the form of a histogram lines and signal generator. Input parameters Period Trend Line - Period of the Histogram Line Signal Generator Period - If the period is longer, then the arrows are less Play sound Display pop-up message Send push notification Send email Sound file signal - Fi
Lines Channel Pro
Vitalyi Belyh
5 (1)
The "Lines Channel Pro" indicator determines price reversals from the High/Low channel. Contains a built-in trend finder, signal lines, entry and exit points. The recommended timeframe for M15 to work is D1. For each timeframe and trading instrument, depending on the volatility, it is necessary to select individual settings. Does not redraw calculations. Input parameters Use Channel trend filter - Turn on/off the trend filter Channel trend period - Trend filter period (from 8 and above) Line
" ZigZag on Trend " göstergesi, fiyat hareketinin yönünü belirlemenin yanı sıra bir çubuk ve pip hesaplayıcıdır. Zikzak şeklinde sunulan bir trend çizgisi ile fiyatın yönünü izleyen bir trend göstergesi ve trend yönünde geçen çubuk sayısını ve dikey ölçekteki nokta sayısını hesaplayan bir sayaçtan oluşur. (Hesaplamalar çubuğun açılmasıyla yapılır) Gösterge yeniden çizilmez. Kolaylık sağlamak için renkli çubuklar veya çizgiler şeklinde tasarlanmıştır. Tüm TF'lerde kullanılabilir, ancak en iyisi M
Channel Cluster
Vitalyi Belyh
5 (1)
Cluster indicator working in the price channel. For operation, the indicator builds a channel line - (dashed line). Inside the channel, cluster sections are determined that determine the direction of the price movement - (histograms in two directions), start with large arrows. Small arrows are plotted above / below each histogram - indicator increase volatility. The indicator does not redraw the values. Works on any tools and timeframes. Entrances are made when large arrows appear, inside small
Oscillatory price direction indicator for Forex. It has 2 operating modes - trend and scalping. The trend mode of operation allows you to determine the direction of the market movement in the medium term. The scalping mode works by determining the price movement in the short term. Consists of a blue line, from which the balance between the directions of the price and signal green / red line. The green line shows the direction of the price up, and the red line shows the direction of the price dow
Zig-Zag indicator with additional signals for inputs. Visually easy to use: The red zig-zag line is an uptrend. The blue zig-zag line is a downward trend. Arrows in the form of additional signals. Works on any trading pairs. On any timeframe. Not redrawn. Input parameters Zig-Zag Period - Zig-zag period (from 5) Signal Period - period of signal arrows (from 3) Alerts for signals Play sound - Sound alert Display pop-up message - Notification by message on the screen Send push notification
Signal indicator that displays price reversals from the upper and lower corners of the chart. It is adjusted for different volatility and timeframes by one parameter - Gradation . Works on any trading pairs. The recommended timeframe for use is from M15 and higher. Not redrawn. If necessary, I will help you choose the optimal setting. Input parameters Gradation - from 0 and higher. If the parameter is larger, arrows are displayed at shorter price intervals. Alerts for signals Play sound - S
Linear indicator for trend trading together with scalping method. The yellow line is used to calculate the long-term price trend. As the yellow line moves, a scalper signal line is applied - a thin red one. A zero level is applied to confirm signals. If the yellow line crossed the zero level upwards, the trend is up. If the yellow line crossed the zero level from top to bottom, the trend is down. The signal red line works in a similar way, only its sensitivity to price movements is higher. Re
Candles Scalper is an indicator of scalping signals. Designed for use on flat and average price movements, showing price reversal directions. It works the same on long trends, but with fewer signals. Suitable for use on timeframes more than M15, the optimal timeframe is M15, M30, H1. Arrows serve as input signals, and dots serve to stop the signal. Sell signals are blue, stops are blue. Buy signals are brown, stops are red. There is 1 parameter in the "Signal index" settings - the index of the
A technical indicator that calculates its readings based on trading volumes. It has an oscillatory line that follows the change in volumes. Large arrows on the line indicate reversal values. A channel is built around the line with small arrows showing the strengthening of price movement in the direction of increasing volumes. The indicator does not redraw values. Works on any instrument and timeframe. It can complement any trading strategy by finding a trend or make entries in the direction of a
This indicator is based on a trend guide line and a special oscillator, defining entry points at the moments of potential price movement. The indicator does not redraw. Works on any instrument. The most preferred time frames to use are M5, M15, M30, H1, H4. The guide trend line of the indicator gives an idea about the movement of the market. When the green line crosses the zero level from top to bottom - the market is bearish when it crosses from bottom to top - bull market. The oscillator is
A trend indicator showing the strength of bulls and bears in a trading range. Consists of two lines: The green line is a balanced overbought/oversold condition. The red line is the direction of trading activity. Does not redraw calculations. Can be used on all Symbols/Instruments/Time Frames. Easy to use and set up. How to use the indicator and what it determines. The basic rule is to follow the direction of the red line: if it crosses the green line from the bottom up, the market is dominat
Developed methods for trading collected in one indicator. In the form of arrows, it defines entries in the direction of the trend. It has 2 types of arrows - trend and signal guides, informing about the potential movement in the direction of the trend. Works without redrawing, ready for use on all symbols/tools. The most suitable time frames to use are M15, M30, H1, H4. How to use The indicator finds the direction of the trend in the form of a signal arrow, a graphic rectangle stretches along
Ticaret ve piyasa yönünü tahmin etmek için döngüsel gösterge. Fiyatın döngüsel davranışını osilatör biçiminde gösterir. Osilatörün üst ve alt sınırlarından bir geri dönüş olduğunda, işlem açılmasına yönelik sinyaller verir. Histogram biçiminde trendin yumuşatılmış gücünü gösterir.  Ölçeklendirmeden gün içi işlemlere kadar her türlü ticaret stratejisini tamamlayacak.  Gösterge yeniden çizilmez.  Tüm sembollerde/aletlerde kullanıma uygundur.  Kısa vadeli işlemler için uygun zaman dilimleri M5, M1
Max Min Reversal Arrows - an arrow reversal indicator for predicting price movement. The indicator is built on the support and resistance levels at the local lows and highs of the price. Product features Arrows appear on the current candle. The indicator does not redraw. Can be used on all time frames and trading instruments. Recommended timeframes to use M30, H1, H4. The dotted lines are the support and resistance levels within the signal. Price movement from these levels means a reversal. Pr
Scalping Entry Points - fiyat hareketlerine uyum sağlayabilen ve yeniden çizmeden alım satımları açmak için sinyaller verebilen manuel bir alım satım sistemidir. Gösterge, merkezi destek ve direnç seviyesine göre trendin yönünü belirler. Nokta göstergesi, girişler ve çıkışlar için sinyaller sağlar. Manuel gün içi ticaret, ölçeklendirme ve ikili opsiyonlar için uygundur. Tüm zaman dilimlerinde ve ticaret enstrümanlarında çalışır. Gösterge birkaç türde uyarı verir. ürün nasıl kullanılır Mavi çiz
Fiyat kanalının göstergesi ve içindeki kesme noktası oluşturucu. Kullanım süresine göre fiyatın konumu hakkında fikir verir. Giriş ve çıkış anlarını belirleyen kanal sınırları ve sıçrama noktaları boyunca oluşturulmuş düzleştirilmiş trend sıçrama çizgileri içerir. Çeşitli ticaret enstrümanları ve zaman dilimleri üzerinde çalışır. gösterge ile nasıl çalışılır Kanal kesme çizgisini takip edin, mavi çizgi yukarı girişler, pembe çizgi aşağı girişler. Giriş noktaları mevcut mum üzerinde oluşturulur
Candle Binary Scalper , forex ve ikili opsiyonlar için teknik analiz ürünüdür. Bir ticaret sisteminde birleştirilmiş birkaç teknik gösterge içerir. Ölçeklendirme ve ikili opsiyonlar için bir trend içinde manuel ticaret için uygundur. Tüm zaman dilimlerinde ve ticaret enstrümanlarında çalışır. Yüksek volatilite durumunda M15, M30, H1 ve H4, M5 ve M1 ticareti için Önerilen Zaman Çerçeveleri kullanılmalıdır. Birkaç uyarı türü vardır. ürün nasıl kullanılır Her Zaman Çerçevesi için en uygun ayarlar
Binary Lines , para birimleri, emtialar, kripto para birimleri, hisse senetleri, endeksler ve herhangi bir finansal araç için teknik bir analiz göstergesidir. İkili opsiyonlar veya Forex ölçeklendirme için kullanılabilir. Giriş ve çıkış noktalarını sabit aralıklarla gösterir ve tüccarlar olası işlemlerin sonuçları hakkında gerekli bilgileri. Giriş noktaları, mumun en başında, MA çizgisi yönünde, süre boyunca oluşturulur. çubuklardaki işlemler manuel olarak ayarlanabilir ve herhangi bir finansal
İşlem hacimlerine ilişkin okumaları hesaplayan teknik bir gösterge. Histogram biçiminde, ticaret enstrümanının hareket gücünün birikimini gösterir. Yükseliş ve düşüş yönleri için bağımsız hesaplama sistemlerine sahiptir. Herhangi bir ticaret enstrümanı ve zaman dilimi üzerinde çalışır. Herhangi bir ticaret sistemini tamamlayabilir. Gösterge değerlerini yeniden çizmez, sinyaller mevcut mum üzerinde görünür. Kullanımı kolaydır ve grafiği yüklemez, ek parametre hesaplamaları gerektirmez. Değiştiril
Filtrele:
İnceleme yok
İncelemeye yanıt