Wilders MACD
- Göstergeler
- Marco Antonio Cruz Dawkins
- Sürüm: 1.0
- Etkinleştirmeler: 5
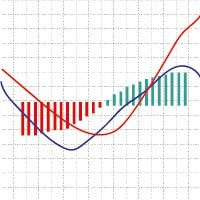
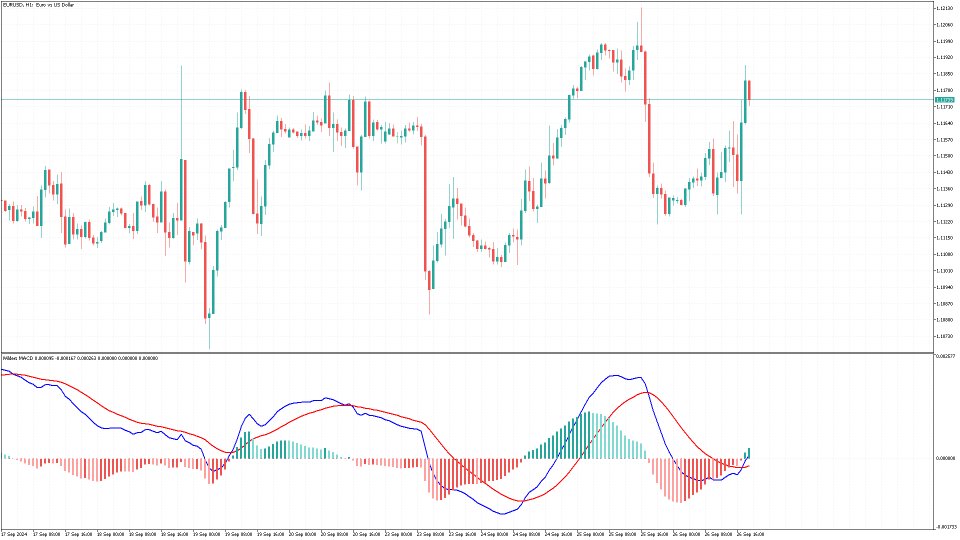
Wilder's MACD (Moving Average Convergence Divergence) is a variation of the traditional MACD indicator, incorporating Wilder's smoothing technique for more accurate trend signals. The indicator consists of three main components:
-
MACD Line: This is the difference between two Exponential Moving Averages (EMAs) — a "Fast" EMA and a "Slow" EMA. The default periods are typically 12 for the Fast EMA and 26 for the Slow EMA.
-
Signal Line: A smoothed version of the MACD Line using Wilder's Moving Average (usually with a 9-period average). This line helps identify buy/sell signals when it crosses the MACD Line.
-
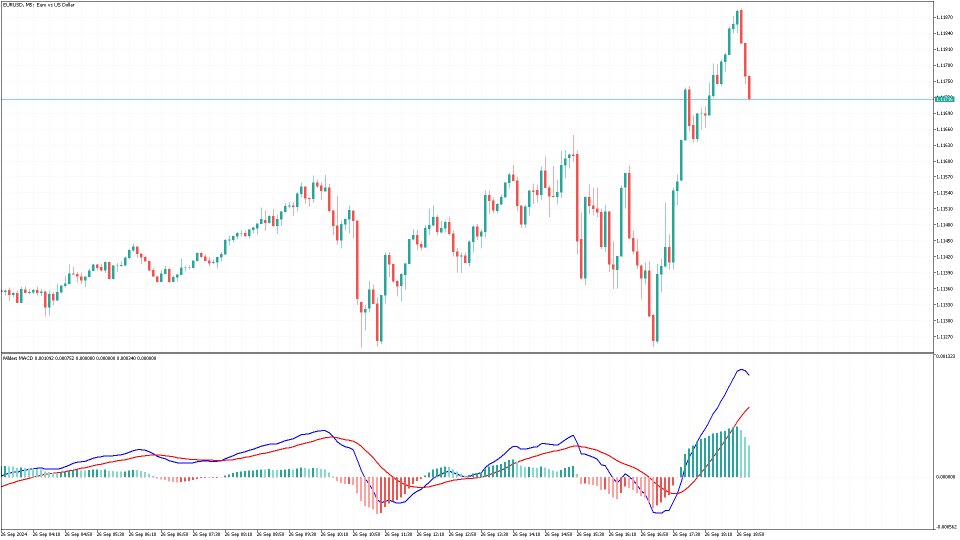
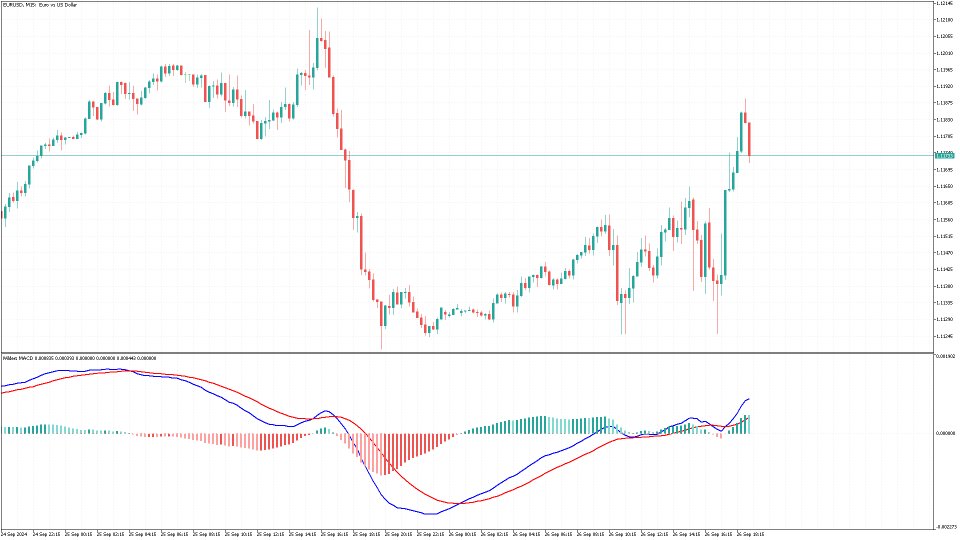
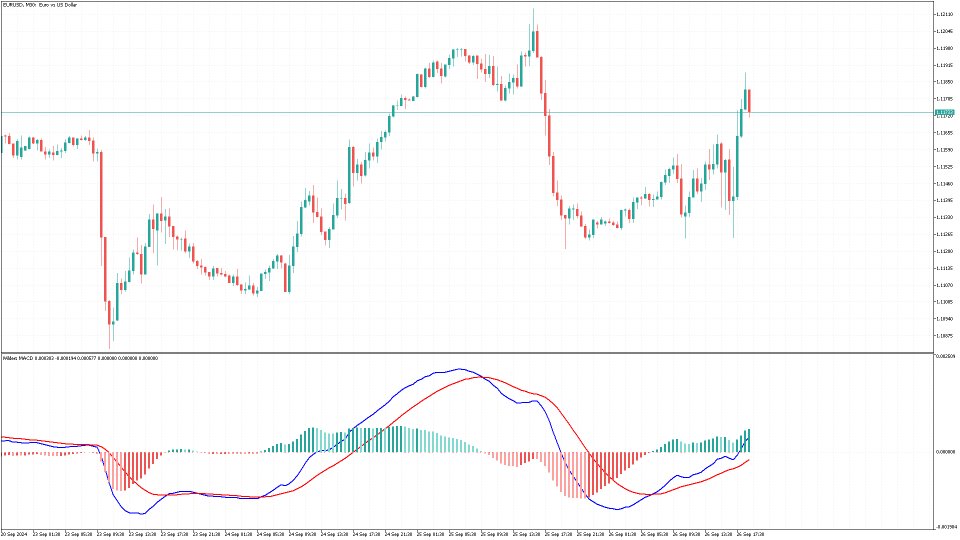
Histogram: Represents the difference between the MACD Line and the Signal Line. It visually shows the convergence or divergence between the two lines. When the MACD is greater than the Signal Line, the histogram is positive (green), and when the Signal Line is greater than the MACD, the histogram is negative (red).
In this implementation, colors vary based on the strength of the trend:
- Rising Green: Indicates that the MACD is above the Signal Line and increasing.
- Diminishing Green: A lighter green shade, showing that the MACD is above the Signal Line but decreasing in strength.
- Falling Red: Indicates that the Signal Line is above the MACD and the gap is increasing.
- Diminishing Red: A lighter red shade, showing that the Signal Line is above the MACD but the gap is narrowing.
Wilder’s MACD offers traders a smoothed version of the standard MACD, which helps in identifying potential trend reversals and reducing noise in volatile market conditions. It’s particularly useful in identifying momentum shifts and possible entry and exit points for trades.
