Available Range Bands
- Göstergeler
- Ricardo Alexandre Laurentino
- Sürüm: 1.0
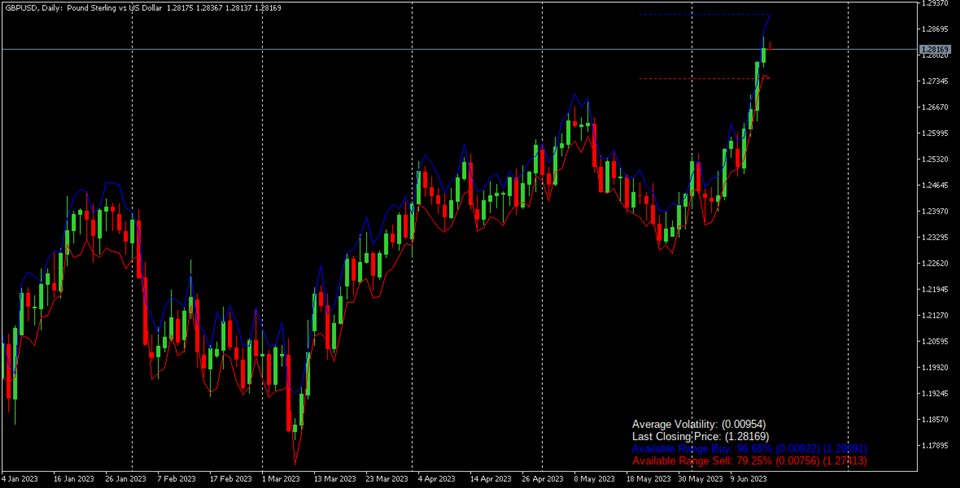
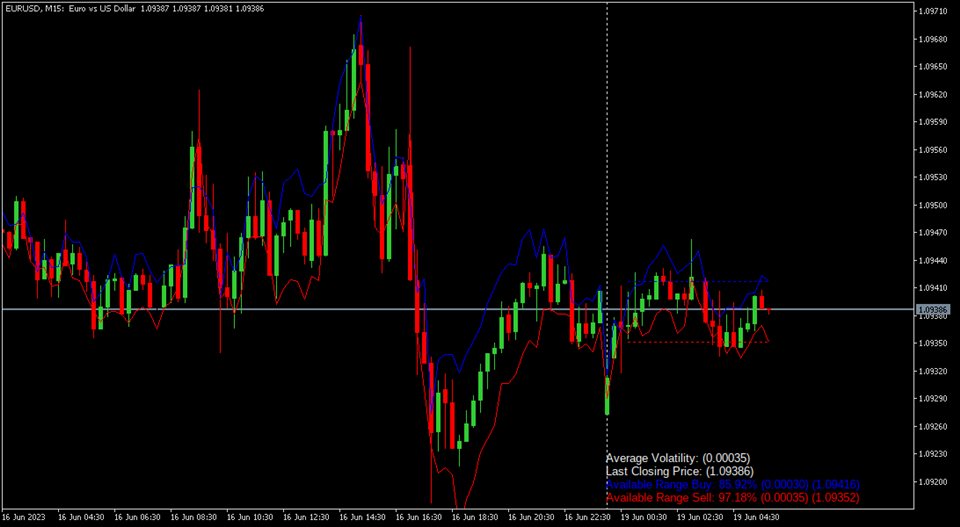
The Available Range Bands Technical Indicator draws two lines on the chart indicating the maximum limits (bands) expected for buying and selling for the current period (candle). These limits can be accessed by buffers 0 and 1 respectively.
In addition, it displays in the lower right corner the current average values of the real volatility, the last price, the predicted range of movement available for buying (% and points) and the predicted range of movement available for selling (% and points).
The calculation is simple: It is the last maximum or minimum price + or - the moving average of the real volatility of the last "x" periods. Where "x" is the number of periods informed in the indicator's input parameters.
For example: in Day Trade operations, the indicator in the daily time frame will display the movement range available for an operation until the end of the day considering the arithmetic mean of the real volatility of the number of periods stored in the input parameters. This information can be useful for the trade to evaluate and decide whether or not it is feasible to enter a new buy or sell position or whether it should already close a current position considering the average range of real volatility.
The history is displayed in the form of bands, making it possible to evaluate the behavior of the real range of each period in comparison with the predicted average.


