Ricardo Alexandre Laurentino / Satıcı
Yayınlanmış ürünler

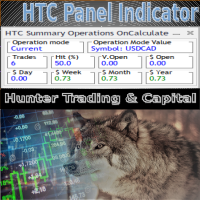
HTC Panel Indicator is an operational summary dashboard for use in conjunction with trading EA.
It provides a concise summary of the current year's trades, open positions and profit history.
The summary can be filtered by the current chart asset, by the ID (magic number) of an EA or by all trades performed in the year.
The panel must be inserted into the chart as an indicator, making it possible to add it to a chart that already has a trading EA.
FREE

The Graphic Alignment Context (GAC) Technical Indicator measures the vertical difference of the simple average price of a financial instrument in the context of three different timeframes determined by a defined number of bars or candles (periods) to determine the strength of the buy or sell trend. sale. Ascending average prices indicate Buying strength (1), Descending average prices indicate Selling strength (-1) and any scenario different from the previous two conditions indicates Neutrality
FREE

The Available Range Bands Technical Indicator draws two lines on the chart indicating the maximum limits (bands) expected for buying and selling for the current period (candle). These limits can be accessed by buffers 0 and 1 respectively.
In addition, it displays in the lower right corner the current average values of the real volatility, the last price, the predicted range of movement available for buying (% and points) and the predicted range of movement available for selling (% and points
FREE
Yayınlanan sinyaller
1. HTCSRForex
- Büyüme
- -100%
- Aboneler
- 0
- Haftalar
- 109
- İşlemler
- 1642
- Kazanç
- 47%
- Kâr faktörü
- 0.93
- Maks. düşüş
- 100%