YouTube'dan Mağaza ile ilgili eğitici videoları izleyin
Bir ticaret robotu veya gösterge nasıl satın alınır?
Uzman Danışmanınızı
sanal sunucuda çalıştırın
sanal sunucuda çalıştırın
Satın almadan önce göstergeyi/ticaret robotunu test edin
Mağazada kazanç sağlamak ister misiniz?
Satış için bir ürün nasıl sunulur?
MetaTrader 5 için yeni Uzman Danışmanlar ve göstergeler - 65
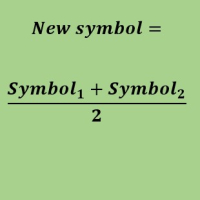
Create a new custom symbol based on average of Multiple arbitrary symbols (for MT5)
An Expert Advisor (EA) used to create custom symbol by averaging multiple input symbols (e.g. EURUSD and GBPUSD) and provide real-time updates. This is an MT4 "offline" chart equivalent which is very simple to use.
You can attach any MT5 compatible indicator or template to this new symbol and perform your technical analysis. You can back-test any EA on this new custom symbol in strategy tester. for example

Trend Paneli, kullanıcı tarafından seçilen on çifti kullanarak M1 - D1 zaman çerçevelerinin onaylanmış bir trend yönünü gösterecek basit ve kullanışlı bir araçtır.
Gösterge, herhangi bir stratejiye/şablona yön teyidi eklemek için tasarlanmıştır ve ardından grafiği farklı bir çift veya zaman dilimine hızlı bir şekilde değiştirmek için temiz bir etkileşimli arayüz olarak çalışır. Grup sohbeti : https://www.mql5.com/en/users/conorstephenson
Kurulum tavsiyesi ve ücretsiz bir Uzman Danışman için
FREE

Bu gösterge, ağırlık katsayıları olarak sözde "kötü" sayıları kullanır. Karşıtları, bu göstergede de sunulan "iğrenç" sayılardır. Sayıların bu iki sınıfa bölünmesi, belirli bir sayının ikili gösterimindeki birim sayısı ile belirlenen Hamming ağırlığı ile ilişkilidir. Bu sayıları ağırlıklandırma faktörleri olarak kullanmak, trend izleyen bir göstergeyle sonuçlanır. Ayrıca, iğrenç sayılar daha hassas bir gösterge verir ve kötü sayılar muhafazakar bir gösterge verir. Aralarındaki fark çok büyük de

Altın Tanrı makine öğrenimini kullanır. Mantık olarak OHLC ticareti yapan XAUUSD 1 HR zaman çerçevesi veya diğer zaman çerçeveleri üzerinde işlem yapın. Girişlerde bakiye riskini ayarlayın, varsayılan olarak %5. Alınacak maksimum lotları kontrol edin. Tüm esnaf durur ve kar alır. Bu EA aktif olarak ticaret yapar. Bir demo üzerinde işlem yapın ve bu göstergelere dayalı olmadığı için yaşayın. Gerçek zamanlı olarak deneyin, göstergeleri kullanan pek çok EA gibi değil. Bu EA göstergeleri kullanmaz

EA Goldlytic use a trend built-in indicator. It's specifically designed for trading the XAUUSD (GOLD) but can be used with other assets (forex, crypto...).
The Expert Advisor opens an order based on a signal from the indicators and fixes the profit at a certain level with the ability to open order basket For best results, it is recommended to cancel the direction of trade on the EA panel on the chart Since this is a trend-following Expert Advisor, we recommend disabling the Expert Advisor in

The Outside The Box (OTB) is a complete trading system that provides the user with immense trading ability by highlighting on the chart areas where the trader should prepare to Re-enter the trend after pullbacks (Pullback trading strategy) Take partial/complete profit(Profit taking strategy), and Trade breakouts (Stock breakout strategy) - We have updated the indicator to show/hide Micro breakout areas around the major breakouts (Micro Breakouts). The above is supported by an alert system to no

The indicator plots a trend channel using the technique by Gilbert Raff. The channel axis is a first-order regression. The upper and lower lines show the maximum distance the Close line had moved away from the axis line. Therefore, the upper and lower lines can be considered as resistance and support lines, respectively. A similar version of the indicator for the MT4 terminal
As a rule, most movements of the price occur within a channel, going beyond the support or resistance line only for a s
FREE
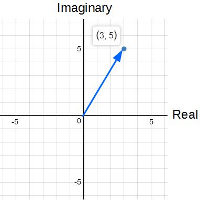
ComplexVector is an indicator based on market analysis using the mathematical apparatus of complex numbers. The essence of the indicator is that it, with clear impulses, indicates the points in time when it is necessary to make decisions. The impulses are like a cardiogram showing the heartbeat of the market.
For example: it may be the moment of planning a new entry. this may be the moment to exit the position. if you work with a series that is in a drawdown, you are recommended to close it i

Binance Futures (Vadeli İşlemler) datalarını anlık olarak Metatrader 5 de görebilir ve üzerinde Metatraderın size sağlamış olduğu tüm özelliklerini kullanmanıza imkan sağlar. Binance Vadelide listelenen tüm sembollerin datasına ulaşabilirsiniz. Saat dilimini ayarlamayı unutmayın. Binance saat 00:00 UTC. Kendi ülkenize göre düzeltmeniz gerekiyor. Türkiye için 3 Bedava olan Binance Future Symbol List eklentisini önceden yüklemeniz gerekmekte. https://www.mql5.com/tr/market/product/82891 Yükleme y

Binance Future ( Binance Vadeli ) da listelenen sembolleri Metatrader5 piyasa gözlemine ekler. Ücretsiz bu dosya ile tüm liste saliseler içinde listeleyebilirsiniz. Demo hesabınıza kolayca kurabilirsiniz Binance Future Tick için yüklenmesi gereken ilk dosyadır ve ücretsiz sunulmaktadır. Araçlar menüsü / Seçenekler / Uzman Danışmanlar / Listelenen URL'ler için WebRequest kullan seçeneğini seçmeniz gerekli
Metatrader'a eklemek için videoları izleyebilirsiniz.
FREE

The tool is intended to help traders who cannot look at the chart all the time, or who use several charts, the trader can mark regions of interest as supports and resistances and as soon as the price approaches these regions an audible warning and on the screen will be presented for the trader to take some action, in addition the tool can automatically mark the highs and lows of the day and time.
FREE

1. Торговая стратегия Что делает советник: Советник следит за некотоными индикаторами и при определенном условии (или условиях) помещать торговый запрос (на продажу или покупку) в зависимости от условий. Стратегия:
Используем индикатор Moving Average (скользящие средние) с периодом 8 (вы можете выбрать любой период, но в данной стратегии мы будем использовать период 8). Советник покупает, если 8-периодная скользящая средняя (далее для удобства будем называть ее MA-8) возрастает и текущая цена з
FREE

Think of the Super Fractal Indicator as the Bill WIlliams Indicator on Steroids. Indicator Abilities: 1. Adjust Candle around Fractal High or Low. 2. Adjust Lookback period and only plot for a specific number of history candles avoiding cluttering your trading desk. 3. The Indicator uses buffers so you call and use it from any EA.
Note : The higher the candles around Fractal, the stronger the Turning point anfd viceversa is true.
FREE

The ADX indicator (average directional index) is a technical tool designed to measure the strength of a market trend. The ADX indicator is used for various purposes such as measuring the strength of a trend, finding a trend and a trading range, and as a filter for various Forex trading strategies.
Some of the best trading strategies are based on following the market trend. There are also strategies through which traders make profit by trading against the trend. In any case, if you can identif

Very powerful indicator! converted from TradingView with upgraded alerts and added notifications. Ideal use in EAs.
Use as a supplementary Indicator to confirm your entries, but it is as good on it's own.
The indicator consists of 3 different Trend Meters and a 2 Trend Bars which are used to confirm trend
How to Use:
The more Trend meters are lit up the better =>>
-more GREEN COLOR at one bar means more confirmation to open buy trade,
- more RED COLOR signals for one bar = more

The purpose of the inidcator is to identify the reversal point.
The blue arrow is buy signal and the yellow star is its stop loss. The red arrow is sell signal and the yellow star is its stop loss. Please note that the singal is against trend,it could be continual fail. Alert feature: if there is a signal, the indicator will send alerts of popup window,email or mobile push. Inputs: Popup Window Alert: it is false in default Email Alert : it is false in default Mobile Push Alert: it is false in

The Spots Indicator can be used for Entering and Exiting your trades based on the common candlestick patterns such as: engulfing, hanging man, doji etc. It is designed to publish desktop and mobile notification every time a signal is triggered. However, it is worth noting that this indicator is recommended to be used with other indicator for confirming the entries. It is best to use it with the Investment Castle Trend Lines indicator and the Supply and Demand indicator .
FREE

Indicator alerts for Dual Relative strength index rsi. Large rsi preset at 14 is below 30 small rsi preset at 4 is below 10 for buy bullish signals .
Large rsi preset are 14 is above 70 small rsi preset at 4 is above 90 for sell bearish signals . Includes mobile and terminal alerts. draws lines when alerts.
This indicator can help identify extremes and then the tops or bottoms of those extremes .
FREE
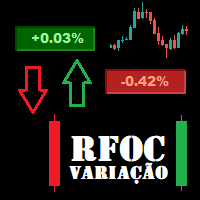
O Produto RFOC Variação Diária apresenta a função de indicar no gráfico a variação, em porcentagem, do preço em relação ao preço de fechamento do dia anterior.
O indicador permite configurar 100% da coloração para variações de alta, baixa e neutra (0.00%).
O painel com a apresentação da variação diária do preço fica fixada na parte superior do gráfico, e se ajusta automaticamente no centro da janela.
FREE

Funciona como bandas de bollinger normais. Criado por Joe Ross, é um setup de maior risco por ser contra-tendência. Pode ser usado para Day Trade, Swing Trade e Position. Para identificar, é necessário inserir no gráfico as Bandas de Bollinger, com uma Média Móvel Simples de 20 períodos e largura (desvio) 2. Verifica-se um fechamento de determinado candle abaixo da banda inferior de Bollinger. Se o próximo candle fechar dentro das Bandas, marca-se a máxima dele. O rompimento dessa máxima será o
FREE
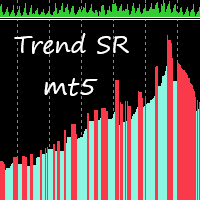
This indicator takes input from Support and Resistance levels, combined with a special trend filter. Easily spot tops and bottoms, and trade with more confidence. Great for scalping. This indicator can be used on all time frames and pairs. Features alert function.
No need to set up the indicator.
How to use: Simply attach to any chart. Zoom chart out completely. Red histogram line color = Selling opportunities. Blue histogram line color = Buying opportunities. See pictures below. To spot high
Tool converted from tradingview indicator. Modified version with pivot points calculated in a more intuitive way.
This tool displays relative volatility and directional trend. Excellent way to pickup diversions and reversals. Length can be lowered to 11 or 13 in settings to show price range.
Can be used to identify patterns such as parallel channels and likely direction of price action.
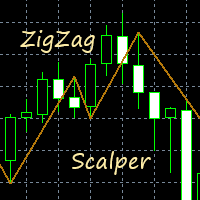
This indicator gives you a modified ZigZag, combined with a trend filter. Great for scalping. Perfect for channel trading. Features alert functions. No need to set up the indicator. How to use: Simply attach to any chart. Buy when the golden line stops below the price. Sell when the golden line stops above the price. It also helps to keep the audible alert set to true. Best results when checking two or more timeframes before entering trades on the lower time frames. Use as you see fit for your

This Expert trades macd crosses , using ADX and AC. Designed for 4hr EURUSD trading but able to trade major pairs. Code is designed for speedy metatrader optimisation using open price testing as ea uses open prices on indicators used. EA identifies trends with specific momentum and exits using the ADX or stop loss. Please optimise using out of sample data. preset at 0.1 lots best to start with 0.01 lots.
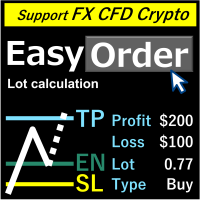
Genel bakış Sadece satırları hareket ettirin, lot, kayıp kesim miktarını doldurarak otomatik olarak hesaplanır. Aşağıda sekiz para birimi hesaplanabilir. (USD, EUR, GBP, JPY, AUD, NZD, CHF, NZD) Sabit denge miktarı veya oranı seçilebilir. Risk ödüllerini hesaplayın. Piyasa siparişi, sınır siparişi ve durdurma siparişi otomatik olarak uygulanır. FX, CFD ve kripto para birimini destekler. Dikkat
"Ücretsiz demo" işe yaramaz. Demo sürümünü bir sonraki sayfadan indirebilirsiniz.
https://www.mq

Bu Uzman Danışman, Trend Dalgası göstergesini kullanır ve yeni bir dalga trend hareketinin başlangıcını ve sonunu belirleyebilir. Bir osilatör olarak, gösterge aşırı alım ve aşırı satım bölgelerini tanımlar. Kısa vadeli fiyat dönüşlerini yakalamak için harika çalışıyor ve tüm işlemleri kârla kapatmak için bir martingale stratejisi kullanıyor. Daha doğru işlemler için herhangi bir çiftte m15 veya daha yüksek zaman diliminde varsayılan ayarları kullanın! Riskten korunmaya izin veren bir hesaba iht
Bu ticaret uzmanının temel amacı, takip eden durdurma işlevlerini yerine getirmektir. Pozisyonları açmaz veya kapatmaz, sadece setler ve hareketler kar alır ve zararı durdurur. Kar al ve zararı durdur hesaplamak için fiyat hareketi istatistikleri ve D. Bernoulli'nin ahlaki beklentisi kullanılır. Bu nedenle, uzman tarafından belirlenen yeni seviyeler, risk/ödül oranı açısından (mümkün olanın) en iyi seçeneğini sunar. Ticaret robotunun parametrelerine bakalım.
Tracked Symbols - EA tarafından

Merkezi Pivot Menzil seviyeleri, merkezi bir pivot noktasının etrafında oluşturulur.
Merkezi pivotla ilgili bu seviyeler, sayısız piyasa davranışını ve olası sonuçları belirlemek için kullanılabilir.
Merkezi pivottan uzaklık ve önceki gün seviyelerine göre yeni seviyelerin oluşturduğu fiyat, takip eden günlerin trend yönünü ve gücünü belirlemek için kullanılabilir.
Merkezi Pivot Aralıkları, destek ve direnç görevi görebilir, stop loss koyacağınız bir kılavuz sunar ve ayrıca fiyatın devam
FREE

Kurumsal Düzeyler / Banka Düzeyleri ... Psikolojik Düzeyler / Çeyrek Teorisi.
Bu gösterge otomatik olarak "000, 200, 500 ve 800" seviyelerinde çizecektir, benim "Kurumsal Seviyeler" olarak bildiğim şey VEYA, çizelgeye "000, 250, 500 ve 750" seviyelerini de çizebilir.
Kurumsal Seviye ticareti / Çeyrek teorisini nerede öğrendiğinize bağlı olarak, bunları farklı isimler olarak bilebilirsiniz, esasen ana fikir, bu seviyelerin çoğu forex piyasasında güçlü destek ve direnç noktaları olarak harek
FREE

WAPV ADH Arz ve Talep Forex Göstergesi, (Wyckoff Academy Wave Market) adlı bir dizi Göstergenin parçasıdır. WAPV ADH Forex Arz ve Talep Göstergesi MT5 için alıcılar ve satıcılar arasında kazanan tarafı belirlemeyi amaçlamaktadır. Okuması çok basittir, yeşil çizgi kırmızı çizginin üzerinde olduğunda talep komuta altındadır, kırmızı çizgi yeşil çizginin üzerinde olduğunda arz komuta altındadır. Yeşil ve kırmızı çizgiler ne kadar pozitifse, hacim girişi o kadar yüksek, sıfıra veya negatife o kadar

“Pratik olarak herkes bizi dürüstlük için affedebilir: ve diyelim ki, yetersiz profesyonel bir oyun ve hatta yetersiz profesyonel şiir. Bunun birçok örneği var. Ama dürüstlük ortadan kalktığında hiçbir şey affedilmez.”
Golden Rings - Forex finansal robotu, mevcut trend yönü belirsiz olduğunda istikrarsız piyasalarda bile karlı işlemler bulmak için seçenekler sunar. Karları en üst düzeye çıkarmak ve olası kayıp olasılığını azaltmak için en iyi eğilimi izleyecektir.
MetaTrader 4 ve MetaTrader
Yardımcı program, fare tekerleğini kaydırarak herhangi bir göstergenin herhangi bir parametresini kontrol eder. Bu yardımcı programı yükleyebilir ve herhangi bir göstergenin arayüzünü standart terminal teslimatından değiştirebilirsiniz . Özel göstergeler için ve ayrıca "Market'ten" satın alınanlar için Universal Scroller 'ın bir yardımcı programı vardır.
Çalışma prensibi Yardımcı program, seçtiğiniz seçeneklerden birini fare tekerleğini kaydırarak değiştirerek kontrol eder. Kaydırma modunu et
FREE
Yardımcı program, fare tekerleğini kaydırarak herhangi bir göstergenin herhangi bir parametresini kontrol eder. Bir gösterge satın aldıysanız veya kiraladıysanız, gösterge arayüzünü bu yardımcı programla değiştirebilirsiniz. Bunun için en az bir tamsayı parametresi olan herhangi bir gösterge uygundur.
Önce nasıl çalıştığını denemek isterseniz, standart terminal teslimatındaki göstergeleri kontrol etmek için ücretsiz Standart Scroller'ı indirin.
Çalışma prensibi Yardımcı program, seçtiğini

TickCounter göstergesi, her yeni çubukta yukarı ve aşağı keneleri sayar.
Hesaplama, gösterge tabloya yerleştirildiği andan itibaren başlar.
Histogram çubukları şunları temsil eder: Sarı çubuklar - toplam kene sayısı; Mavi çubuklar - YUKARI işaretler; Kırmızı çubuklar - AŞAĞI işaretler. Mavi çubuk görünmüyorsa, daha fazla aşağı onay işareti vardır ve kırmızı çubuk mavi olanın üzerinde görüntülenir (kırmızı katman mavi olanın üzerindedir). MT4 version: https://www.mql5.com/en/market/product/

DİĞER EA'ları ÜCRETSİZ EDİNİN!!! DİĞER EA'ları ÜCRETSİZ EDİNİN!!! DİĞER EA'ları ÜCRETSİZ EDİNİN!!! DİĞER EA'ları ÜCRETSİZ EDİNİN!!! DİĞER EA'ları ÜCRETSİZ EDİNİN!!!
USD Scalper MT5, USD Çiftleri için bir Sinirsel EA'dır. Bu ürün GBPUSD, EURUSD, AUDUSD, NZDUSD için üretilmiştir. Gelecekte eklenen yeni ÇİFTLER olabilir.
MEVCUT ÇİFTLER:
GBPUSD
EURUSD
AUDUSD
NZDUSD - SONRAKİ VERSİYONDA EKLENECEKTİR
GİRİŞLER:
ZARAR DURDUR'A GÖRE RİSK YÜZDESİ (1 seçilirse İşlem başına maksimum

MT5 için WA_PV_BOX_EFFORT X SONUÇ WAPV Box Effort x Result Indicator, Paket Göstergeleri grubunun (Wyckoff Academy Wave Market) bir parçasıdır. MT5 için WAPV Box Effort x Result Indicator , fiyat ve hacmi okumanıza yardımcı olur. Okuması, çaba x sonucunun tanımlanmasına yardımcı olmaktan ibarettir. grafik tarafından oluşturulan dalgalarda. Kutu yeşil olduğunda MT5 için WAPV Kutusu Eforu x Sonuç Göstergesi, hacmin talebin lehine olduğu ve kutunun kırmızı olduğu anlamına gelir hacim arzdan yana. K

MT5 için WAPV Fiyat ve Hacim Göstergesi, (Wyckoff Academy Wave Market) ve (Wyckoff Academy Fiyat ve Hacim) araç setinin bir parçasıdır. MT5 için WAPV Fiyat ve Hacim Göstergesi, grafikteki hacim hareketini sezgisel bir şekilde görselleştirmeyi kolaylaştırmak için oluşturuldu. Bununla, piyasanın profesyonel bir ilgisinin olmadığı en yüksek hacim anlarını ve anları gözlemleyebilirsiniz. Piyasanın "akıllı para" hareketiyle değil, ataletle hareket ettiği anları belirleyin. Kullanıcı tarafından değişt

WAPV ADH Arz ve Talep göstergesi, (Wyckoff Academy Wave Market) adı verilen bir dizi göstergenin parçasıdır. WAPV ADH Arz ve Talep Göstergesi MT5 için alıcılar ve satıcılar arasında kazanan tarafı belirlemeyi amaçlamaktadır. Okuması çok basittir, yeşil çizgi kırmızı çizginin üzerinde olduğunda talep komuta altındadır, kırmızı çizgi yeşil çizginin üzerinde olduğunda arz komuta altındadır. Yeşil ve kırmızı çizgiler ne kadar pozitifse, hacim girişi o kadar yüksek, sıfıra veya negatife o kadar yakın

User Grid MT5 is a multifunctional grid Expert Advisor designed to fully or partially automate various ideas related to grid trading (on a hedging account) . The Expert Advisor can trade on any timeframe, on any currency pair, on several currency pairs, on any number of signs. It does not interfere with manual trading, trading of other Expert Advisors, or the operation of any indicators. It allows you to adjust your settings on the fly, works only with your own positions and orders. It has a

MT5 için Weis Wave Bouble Yan Göstergesi, araç setinin bir parçasıdır (Wyckoff Academy Wave Market) MT5 için Weis Wave Bouble yan Göstergesi, David Weis tarafından oluşturulan halihazırda kurulmuş Weis Wave'e dayalı olarak oluşturulmuştur. Weis Wave Çift Taraflı göstergesi, piyasayı olduğu gibi dalgalar halinde okur 1900 yılında R. Wyckoff tarafından. Çaba x sonuç, neden ve sonuç ve arz ve talebi belirlemeye yardımcı olur. Diferansiyeli, sıfır ekseninin altında kullanılabilmesi ve daha da iyileş

MT5 için Weis Wave Bouble Yan Göstergesi, araç setinin bir parçasıdır (Wyckoff Academy Wave Market) MT5 için Weis Wave Bouble yan Göstergesi, David Weis tarafından oluşturulan halihazırda kurulmuş Weis Wave'e dayalı olarak oluşturulmuştur. Weis Wave Çift Taraflı göstergesi, R. Wyckoff'un 1900'de yaptığı gibi piyasayı dalgalar halinde okur. Çaba x sonuç, neden ve sonuç ve arz ve talebi belirlemeye yardımcı olur. Diferansiyeli, sıfır ekseninin altında kullanılabilmesi ve şunu gösteren bir koparma

MT5 için VSA Candle Signal, araç setinin (Wyckoff Academy Fiyat ve Hacim) bir parçasıdır. İşlevi, mum oluşumunda Fiyat ve Hacim ilişkisini belirlemektir. Oluşturulması, Fiyat ve Hacim analizinde bir öncü olan R.Wyckoff'un öncüllerine dayanmaktadır. MT5 için VSA Candle Signal, karar vermede yardımcı olur ve okumanızı bırakır daha net ve akıcı. Aşağıdaki resimlere bakın.

MT5 Real Volume için Kuvvet ve Zayıflık Göstergesi, (Wyckoff Academy Fiyat ve Hacim) araç setinin bir parçasıdır MT5 Real Volume için Kuvvet ve Zayıflık Göstergesi, hacmin Gücünü ve Zayıflığını toplu bir şekilde belirlemek için geliştirilmiştir. Fiyat ve hacim arasında bir panorama vizyonunun etkinleştirilmesi. Gösterge, bir osilatör ve bir histogram olarak kullanılabilir. Bir fantezi olarak, fiyatla bir araya getirildiğinde R. Wyckoff'un üç yasasının tüm önermelerine sahiptir: Sebep ve Etki, Ça

The Force and Weakness Indicator for MT5 Forex is part of the (Wyckoff Academy Price and Volume) Toolkit The Force and Weakness Indicator for MT5 Forex was developed to identify the Strength and Weakness of volume in an accumulated way. Enabling the vision of a panorama between price and volume. The Indicator can be used as an oscillator and as a histogram. As usual it has all the premises of R. Wyckoff's three laws when put together with the price: Cause and Effect, Effort x Result and Supply a

This EA combines signals from Keltner's channels and other indicators, executes buy and sell against the trend of the selected time frame, great assertiveness with selection of specific parameters for each asset. Ideally, you should test the parameters in the backtest to validate the strategy. Enjoy the best that technology has to offer you. If you are interested in my individual presets please contact us here in the chat or send an email, vendas.mercadocapital@gmail.com.

This indicator is very useful for day traders or short term traders. (MT5 version) No need to calculate the number of pips manually, just look at the chart and you will see the Virtual Take Profit / Virtual Stop Loss target line and evaluate whether the entry point is feasible to reach the intended target or not.
Enter the intended Take Profit / Stop Loss pips for your trade. The indicator will display Virtual Take Profit / Virtual Stop Loss lines for you to easily see if the target i
FREE

Resistance and Support is an easy to use indicator to apply horizontal lines of resistance and support. There are two windows for adding levels. When you press the button, a line appears on the price chart. It is possible to move this line with the mouse, thereby changing the indicator readings. In the indicator menu there is a choice of possible alerts - no alert, alert on touching the level and an alert for closing the candle after the level.
FREE
This EA was developed for the Brazilian market in win active in all series of the year. A method of confluence of several indicators of moving averages, IFR and ATR is used. It uses the medium price technique to recover losses in a situation of reversal of movement, and can be enabled and parameterized. The goal is to gain 50 points at each entry, with only 1 contract the risk is minimized and the profit is gradual. Recognizes and avoids input at lateralization levels. It recognizes and advance

The idea of a Value Chart indicator was presented in the very good book I read back in 2020 , " Dynamic Trading Indicators: Winning with Value Charts and Price Action Profile ", from the authors Mark Helweg and David Stendahl. The idea is simple and the result is pure genius: Present candlestick Price analysis in a detrended way!
HOW TO READ THIS INDICATOR
Look for Overbought and Oversold levels. Of course, you will need to test the settings a lot to find the "correct" one for your approach.
FREE

Andrew Pitch fork is one of the most interesting string trend & Channel & Fibo technical analysis , it's like ALL in ONE tool would be very enough for you.
FYI, This indicator will expire by end of July 2022.
Using 2 Andrew pitch Forks with 2 different time frames on same chart is really very hard working and might be impossible , but with this indicator is possible now , moreover , using this method as Candle Volume based analysis give strong trust for your trade.
I assume if you are hav
FREE

Everyone knows how to analyze the market , which level to buy / sell this is an easy job , which leads to unusual horrible loses , very little few people knows WHEN then enter the market , time is Money , this is the key!!!
This version is a Proof of concept limited version of ZamanCYcles founded here: https://www.mql5.com/en/market/product/81883?source=Site +Market+Product+Page This works Only on 3 Minutes Time frame for 45 Candles Get rest of planets and more than 10 other algorithms to pre
FREE

Hello traders. The Ultimate Machine is a versatile robot, primarily designed to trade the XAUUSD symbol on the H1 time frame using default settings. However, if you wish to trade on a different currency pair, such as EURUSD, you'll need to undergo the optimization and testing process. Therefore, I recommend testing the robot extensively on a DEMO account before proceeding further. If you're exclusively using this robot, there's no need for additional adjustments. However, if you're simultaneousl

The idea behind this indicator is very simple , First it contains 2 mechanisms to place your trades:
1- Enter the Pips you want to duplicate to price levels. 2- Automatically let the indicator specify the largest Buy / Sell Volume Candle and place duplicated levels based on the candle itself.
How it works: 1- Enter the Pips you want to duplicate to price levels: 1- once the indicator is loaded you will need first to Specify the number of pips in the indicator Configuration window ,you can
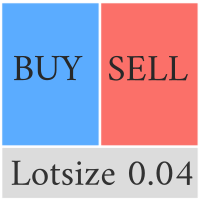
This Pro version of the LotSizePanel let's you set the stoploss with a line. Instantly the ea will calculate the lotsize based on where you drag the line on the chart. Press the "Show Line" button again, and the line dissappears and the ea reverts back to calculating the lot size from an ATR based stoploss again.
I can't see how I would ever trade manually without this panel again.
Remember that autotrading needs to be turned on to place orders with the buttons.

John Bollinger created this indicator in 2010 as a way to read the original indicator (Bollinger Bands) in a more "technical" way, shown as an oscillator. The typical range of the Bollinger Bands %B is 0 - 0.5 - 1.0, where "0" represents the lower band, the "0.5" the middle band, and "1" the upper band. The line on the indicator represents the Closing prices. As simple as that.
SETTINGS
Bollinger Bands period of analysis Standard Deviation multiplier Shift Price type to be analyzed
If you
FREE

A ideia do indicador é mudar de cores assim que o candle viole a banda; Caso o candle viole a banda superior, pinta o candle de vermelho, Caso o candle viole a banda inferior , pinta o candle de verde, Se o candle passar em algum momento pela média, ele assume uma cor acinzentada; Os candles que não passem pela média, nem violem a banda, apresentarão cor verde fraca, se for de alta e cor vermelha fraca se for de baixa. Projeto concebido no canal Aprenda a programar, keltner cores.
FREE

I always wondered if I can have multiple time frame Moving average on same chart , it is not possible , now with my Indicator is possible , As you know Moving average is lagging not leading indicator , but how can I predict future levels of it ?
I came with this idea , I hope you will like it , I made a Mirror of Moving average , the other side of specific time will be shown in the other side of the chart where the price didnt reach yet , that will help you to know the levels you can start sel
FREE

Supported currency pairs: EURUSD,USDCAD, GBPUSD, EURGBP Recommended timeframe: M15
The EA should run on a VPS continuously Setting Fixed Lot - fixed frist trading lot StopLoss, in pips - stop loss value TakeProfit, in pips - t ake profit value CCI: averaging period, Averaging period for calculation
CCI: type of price, Use martingale, martingale Mode Martingale coefficient, martingale multiplier Order Maximum number of multiplications

MACD strategies EA is a EA that can support multiple MACD strategies. Purchasing this EA can save you the time taken to automate your existing MACD strategy through coding a custom EA and it also helps you discover profitable MACD strategies as its fully compatible with the strategy tester and all settings are editable. The EA supports both scalping, short term and long term strategies. The various supported settings are explained below: NOTE: The default settings in the EA are s
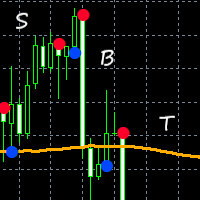
This indicator combines input from two trend filters and the ADX. You can change the trend line on chart to your preference. Great for scalping and channels. Features alert function and parameter TrendLinePeriod.
How to use: Simply attach to any chart. Sell on red bullets, with trend line above price. Enter on bullets closest to this line. Buy on blue bullets, with trend line below price. Enter on bullets closest to this line. Best results when checking the higher time frames before entering t

Ichimoku Trend Finder is a multi symbol multi timeframe trend dashboard that helps traders to monitor and identify potential market trends from one chart. This panel scans the Ichimoku Kinko Hyo indicator in 28 configurable instruments and 9 timeframes for classic Ichimoku trend signals with a deep scan feature to scan all market watch symbols (up to 1000 instruments!).
Download Demo here (Scans only M1 and M6) Settings description here MT4 version here
After the purchase, don't fo
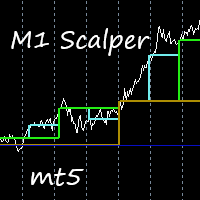
This indicator is excellent for scalping on the M1 or M5 chart. Uses a special algorithm for the lines. No need to set up the indicator. Does not feature any alerts and is best used manually after visually confirming the line displays. NB: Make sure to download M1 history before testing and use.
How to use: Simply attach to M1 or M5 chart. Zoom chart out completely. Sell when all lines above the white line (PriceLine). Sniper line crosses above white line. Buy when all lines below the white li

Optimize before back test or use.
New Wave trades trends. 3 moving averages and trends up and trends down, buying and selling. Finding the optimal parameters for yourself, you will need to optimize in the platform. A set file is in the comments to use in the test to show the Expert. Optimize inputs according to your asset and risk. I optimized this with EURUSD on a 1 hour time frame. Percentage of balance is used to trade by.

This indicator gives you arrows, two SR lines and a golden trend line. Uses a special trend algorithm to plot the arrows, combined with support and resistance inputs. Perfect for channel trading. Features alert functions.
Parameter TrendArrowPeriod. Parameter TrendLinePeriod. (Change to your preference) How to use: Simply attach to any chart with default settings. Zoom in the chart, to see the two blue SR lines and arrows more clearly. When the blue SR line is below the price, golden trend line

The Price Elevator indicator is developed to help you figure out the general long-term trend of the market. If the price is above the Green separator line, this is a clear indication the bulls are in control. Similarly, the bears are in control if the price continues to trend below the red separator line. Download Price Elevator MT4
Trend Re-entry In this case you would plan your buy entries above the green dotted box (make sure to set the Buy / Sell Retracement Floor=30). The SL should be
Este EA foi desenvolvido para o mercado financeiro Brasileiro, porem, com os Parâmetros corretos pode ser aplicado a todos ativos disponíveis na metatrader inclusive forex e metais. Não julgue o resultado com os parâmetros padrão, entenda que os parametros são para validação de diversos ativos, por isso cada ativo tem um valor que se enquadra na realidade do contexto do mercado. Qualquer duvida, pode me chamar no Telegram @andrefonsecaloureiro ou no email vendas.mercadocapital@gmail.com

Supported currency pairs: EURUSD,USDCAD, GBPUSD, EURGBP Recommended timeframe: M15
The EA should run on a VPS continuously Setting Fixed Lot - fixed frist trading lot StopLoss, in pips - stop loss value TakeProfit, in pips - t ake profit value RSI : averaging period, Averaging period for calculation
RSI : type of price RSI :RSI value calculation
Use martingale, martingale Mode Martingale coefficient, martingale multiplier Order Maximum number of multiplications

Kısmi Kapatma EA MT5 , işlem hesabınızdaki herhangi bir işlemi/işlemleri lot boyutunun belirli bir yüzdesi ve/veya işlem biletinin belirli bir yüzdesi ile manuel olarak veya başlangıçtaki lot boyutunun yüzdesi için TP/SL seviyesinin yüzdesi olarak otomatik olarak kapatabilir. 10 kar al ve 10 zararı durdur seviyeleri. Belirli sihirli sayı veya sembol alım satımlarını belirleyerek veya hariç tutarak, hesabınızın alım satımlarının tümünü veya herhangi birini yönetebilir.
İpucu: Kısmi Kapatma EA

WolfeWaveBuilder göstergesi ile ticarete katılın! Bu, en başarılı ve karlı yatırım kararlarını almak için özel olarak oluşturulmuş benzersiz bir araçtır. Canlı hesaplar için idealdir ve tamamen test edilmiş ve neredeyse garantili bir ticaret stratejisinden yararlanır. fırsatı kaçırmayın! WolfeWaveBuilder göstergesi ile ticaret yaparak para kazanmaya başlayın!
MT5 sürümü https://www.mql5.com/ru/market/product/8920
Gösterge Özellikleri
Wolfe Waves stratejisi için sinyaller verir.

ROC Fiyat Histogramı Uyarısı, mevcut fiyat ile belirli sayıda dönem önceki fiyat arasındaki yüzde değişimini ölçen momentum tabanlı bir teknik göstergedir. ROC, fiyat değişiklikleri yukarı yönde ise gösterge yukarı doğru pozitif bölgeye, fiyat değişiklikleri aşağı yönde ise negatif bölgeye hareket ederek sıfıra karşı bir histogramla çizilir.
ROC periyodunun hesaplanmasındaki ana adım, 'hesaplanan periyot' giriş ayarıdır. Kısa vadeli tüccarlar, dokuz veya on iki gibi küçük bir değer seçebilir.
MetaTrader Mağaza - yatırımcılar için ticaret robotları ve teknik göstergeler doğrudan işlem terminalinde mevcuttur.
MQL5.community ödeme sistemi, MetaTrader hizmetlerindeki işlemler için MQL5.com sitesinin tüm kayıtlı kullanıcıları tarafından kullanılabilir. WebMoney, PayPal veya banka kartı kullanarak para yatırabilir ve çekebilirsiniz.
Ticaret fırsatlarını kaçırıyorsunuz:
- Ücretsiz ticaret uygulamaları
- İşlem kopyalama için 8.000'den fazla sinyal
- Finansal piyasaları keşfetmek için ekonomik haberler
Kayıt
Giriş yap
Gizlilik ve Veri Koruma Politikasını ve MQL5.com Kullanım Şartlarını kabul edersiniz
Hesabınız yoksa, lütfen kaydolun
MQL5.com web sitesine giriş yapmak için çerezlerin kullanımına izin vermelisiniz.
Lütfen tarayıcınızda gerekli ayarı etkinleştirin, aksi takdirde giriş yapamazsınız.