MetaTrader 5용 새 Expert Advisor 및 지표 - 65
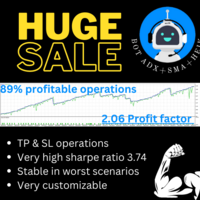
The Azurita North bot it's the ultimate expert advisor. Robust and very customizable, it ensured consistent growth even during the worst case scenarios during the last 2 years. If you are a data freak, check out the images attached and the youtube video. This bot uses specific indicators and ADX, SMA with Heiken ashi candles strategies. No martingale. All operations uses TP and SL. Some key indicators . Sharpe Ratio : 3.74 Profit factor: 2.06 Profitable positions (% total) : 89.04%
Recom

RaysFX (Average Directional Movement Index)
Technical indicator (ADX) helps to determine the market trend. It was developed and described in detail by Welles Wilder.
The simplest trading method based on the system of directional movement implies comparison of two direction indicators: the 14-period +DI one and the 14-period -DI.
To do this, one either puts the charts of indicators one on top of the other, or +DI is subtracted from -DI.
W. Wilder recommends buying whenever the +DI crosses ab
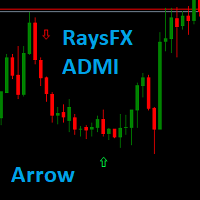
RaysFX (Average Directional Movement Index) to → ARROW
Technical indicator (ADX) helps to determine the market trend. It was developed and described in detail by Welles Wilder.
The simplest trading method based on the system of directional movement implies comparison of two direction indicators: the 14-period +DI one and the 14-period -DI.
To do this, one either puts the charts of indicators one on top of the other, or +DI is subtracted from -DI.
W. Wilder recommends buying whenever the +DI
This is an Utility to make your trading easier by putting at one click or a few clicks time-consuming tasks as order management and risk management. Contact for a free trial. Features
Risk Management
Calculates automatically lots based on risk specified in either % or $ in the risk field and let you enter just by placing lines for SL TP etc and display real-time Risk Reward . TrueRisk so it includes commissions when calculating lot size on FX pairs only so you risk 1% with

Golden Idol은 XAU/USD를 거래합니다. 2004년부터 현재 2022년까지 기계 학습 알고리즘으로 구축되었습니다. 거래자가 매개변수를 변경하는 것이 적합하다고 생각하면 추가 최적화를 수행할 수 있습니다. 기본값은 차익 700, 손절매 500으로 설정되어 있습니다.
골든아이돌은 마팅게일이나 기타 위험한 전략을 사용하지 않습니다. 모든 거래에 고급 자금 관리 기능이 내장되어 있다는 사실을 잘 알고 있습니다. 변동성이 큰 시장이 역사적인 움직임을 보이면서 이는 모든 전략이나 시스템에서 기본입니다. 거래 논리는 표준 편차, 볼린저 밴드 및 이동 평균을 기반으로 합니다.
Golden Idol은 XAU/USD를 거래합니다. 2004년부터 현재 2022년까지 기계 학습 알고리즘으로 구축되었습니다. 거래자가 매개변수를 변경하는 것이 적합하다고 생각하면 추가 최적화를 수행할 수 있습니다. 기본값은 차익 700, 손절매 500으로 설정되어 있습니다.
골든아이돌은

추세 표시기 " Super Trend Flexible Alert "에는 최소한의 설정이 있습니다. 이 표시기는 가능한 한 쉽게 사용할 수 있도록 설계되었습니다. 표시기는 기본 컬러 라인("SuperTrend" 라인, "데이터 창" 창에서 볼 수 있음)으로 추세를 보여줍니다. 또한 추세가 변경되는 위치에서 표시기는 "데이터 창" 창에서 볼 수 있는 "STBuy" 및 " STSell" 아이콘을 컬러 화살표로 표시합니다. ). 추세가 바뀌는 곳에서 표시기는 신호를 보내지 않습니다. 소리(또는 소리 파일 또는 경고)를 재생하거나 이메일로 메시지를 보낼 수 있으며 푸시 메시지를 보낼 수 있습니다. 이동 단말기 신호 설정: 사운드 이름 - *.wav 형식의 사운드 파일 이름(사운드 파일은 터미널의 "Sounds" 폴더에 있어야 함) 반복 - 신호 반복 횟수 일시 중지, 초 단위 - 신호 사이의 초 수(한 막대 내) Use Sound - " Sound Na

Divergence indicator 10 different indicators. Finding and displaying classic and hidden divergences.
Indicators in which divergences are searched: MACD MACD Histogram; RSI; Stochastic; CCI; momentum; OBV; VWmacd; Chaikin Money Flow; Money Flow Index. This is a replica of the indicator from the tradingview resource, adapted for the MT5 terminal.
MT4 version available here: https://www.mql5.com/en/market/product/87846
Settings: Bars in history for analysis - number of bars for analysis

Are you tired of drawing trendlines every time you're analyzing charts? Or perhaps you would like more consistency in your technical analysis. Then this is for you. This indicator will draw trend lines automatically when dropped on a chart. How it works Works similar to standard deviation channel found on mt4 and mt5. It has 2 parameters: 1. Starting Bar 2. Number of bars for calculation The starting bar is the bar which drawing of the trend lines will begin, while the number of bars for c
FREE

this indicator has the finality of show in graph the size of candle in formation to show the force of market in some moments of the day. This indicator is free and based on example disponible on the comunity. I'm disponibilizing here to anyone who don't know about programing. Please enjoy this indicator and leave a coment or a rate to help this indicator to other people who needs.
FREE

Developed by Smart Trader - Smart Reversion Pattern is an indicator capable of identifying reversal patterns , both bullish reversals and bearish reversals.
It is designed to provide fast, real-time awareness of patterns.
We also thought about the interface part, creating a clean and pleasant look to identify formation patterns on the chart.
Note: If any pattern you need is not listed, just contact us and request inclusion - we usually respond within a few hours.
Bearish Reversal P
RSI Traffic Light Indicator tracks several RSI ( Relativ Streng Index) Periods and informs you, if the trend is changing. Trend is you friend, one of the classical Trend following is the Relativ Streng Index (RSI). With RSI Traffic Light Indicator you will get information about trendchange. The RSI Traffic Light Indicator alerts you if the trend is changing for your pair. Different trendchange criterials and visualisation themes inclusive. Your can adjust the indicator Trendchange criterials by
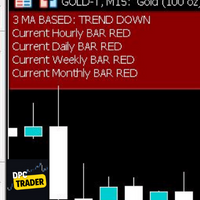
This Utility Bot is for New Traders, that struggle to spot the Trend direction. It also make you conscious about different Timeframes Bar Status. Utility have 3 Moving Averages totally configurable by input parameters. 3MA Based Trend is shown for the current Timeframe selected on the chart. (Line 1) 3MA Based Trend for Daily Timeframe. (Line 2nd) Also provide quick information about the currently Hourly Daily and Weekly Candle Status. Utility work on 1 Min Bar control, so comment section info
FREE

EA utility to help you with your Discipline for New Traders. When Balance Drop below set Daily Max Percentage Draw Down Balance. Any new trades open after the DD Threshold reached, Bot will close any new trades instantly and will keep canceling any pending orders placed as well until the Next Daily Candle is formed or EA is removed. Note: 1. Please Attached EA Utility before start trading for the day. 2. Set Timeframe before attaching EA utility to the chart. If timeframe changed after taking a
FREE
The trading utility simplifies trading by quickly setting stop loss and take profit and risk calculation. Capabilities: 1. Using hotkeys: - The “s” key is responsible for showing/hiding the trading panel and stop loss and take profit levels. - The “~” key is responsible for changing the direction of trading. - It is possible to select in the settings a key that is convenient for you from the list for each of the parameters. 2. Using two modes of risk and volume calculation (the first button on t

This MT5 indicator has been designed to be used on any currency pair and any time frame . It has the scalper and swing trader in mind. The indicator looks for short-term high-probability reversals in price and will indicate to you to go long (buy) or short (sell) if you see a green or red arrow next to the current candlestick respectively. The indicator provides the best trading opportunities to you during the active trading hours of London and New York, but it will continue to give signals al

This MT5 indicator has been designed to be used on any currency pair or indices and on the daily time frame or higher . The indicator looks for medium-term high-probability continuations in price and will indicate you to go long (buy) or short (sell) if you see a green or red arrow next to the current candlestick respectively. The indicator paints an arrow when the specific criteria are met, however, you must wait until the current candlestick has closed until you enter a trade . Therefore you w

This MT5 indicator has been designed to be used on any currency pair, but not indices, on the ONE HOUR time frame only . This indicator has the highest win rate of all my indicators but it is not perfect and there is no holy grail in trading. The indicator looks for short-term high-probability trend continuations in price and will indicate you to go long (buy) or short (sell) if you see a green or red arrow next to the current candlestick respectively. The indicator paints an arrow when the spe

A simple and efficient indicator that plots and updates the 50% of the current day, for those who use this point as a reference in day trading.
On trend days the 50% region tends to be a good resistance point, ideal for making new entries.
On non-trend days (sideways) the 50% region is great for carrying out positions.
In addition, for study or back-testing criteria, you can define the amount of previous days to be plotted by the indicator.
For questions or suggestions, please contact u
FREE

ПОСМОТРИТЕ НАШ НОВЫЙ СОВЕТНИК : : https://www.mql5.com/ru/market/product/95095?source=Unknown#description
Индикатор показывает время до закрытия свечи, а также время сервера на текущем графике. Очень прост в использовании, всего четыре настройки:
Lable Location- расположение таймера на графике; Display server time- показывать время сервера или нет; Sound alert when the candle is closed- использовать звуковой сигнал при закрытии свечи или нет; Colour -цвет цифр таймера. Другие полезные бесп
FREE

Another renko-based indicator. It returns different usable values for an EA, and is directly displayed on the main chart. Its setting is very simple: The size of the renko The number of bars taken into account The falling color The color on the rise Returned values: Buffer 0 : Value of the middle Buffer 1 : Value of the Top Buffer 2 : Value of the Bottom Buffer 3 : Direction of renko (0.0 for top ; 1.0 for bottom) Buffer 4 : Ratio of the renko, for example, if it is twice, 3 times, ro more of

S&R indicator automatically finds the closest support and resistance levels (or zones) for the loaded traffic.
• The indicator works on all timeframes (it is advisable to choose at least M15) • The indicator works on all markets • Doesn’t redraw • Flexible settings The work of the indicator is based on the fractal indicator built into the MT4 platform. The fractal is a local extremum described by Bill Williams. The support and resistance indicator automatically finds the levels or zones,

The Candle Timer indicator is an Custom Indicator that displays the remaining time before the current candle would close. The Candle Timer indicator works by retrieving the time from the broker’s server. It also retrieves the time when the next candle would begin. Then, it calculates the difference between the projected open time of the next candle and the current time on the broker’s server. The difference between the open time of the next candle and the current server time is then displayed o

ПОСМОТРИТЕ НАШ НОВЫЙ СОВЕТНИК : : https://www.mql5.com/ru/market/product/95095?source=Unknown#description
Индикатор отображает свечи заданного старшего таймфрейма, на меньших таймфреймах TF_Bar - выбор старшего таймфрейма, на основе которого будут отображаться свечи на текущем; Number_of_Bars - предельное число баров, до которого будет производиться расчет индикатора; Color_Up - цветовое отображение бычьих свечей; Color_Down - цветовое отображение медвежьих свечей; Widht_lines - то
FREE
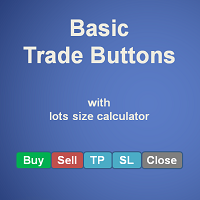
Basic Trade Buttons is a tool to help you to quickly open and close trades, place take profit and stop loss points by clicking on the button of each job that you preferred. Once you attached this tool to mt5 chart, the program will calculate a trade volume(Lots size) automatically to prepare to send to the trade server when you click on 'Buy' or 'Sell' button. Click on 'TP', 'SL' or 'Close' button to place take profit, stop loss based on the predefined levels or to close all open positions respe

--- Please read before install the DEMO or Purchase! --- To all investors : In order to pass the automatic validation tester, I have to modify the parameter. Therefore, if you would like to run the DEMO on the backtest or run REAL in your account for specific currency pair (preferred EURUSD) , kindly follow the parameter below: Parameter : InitialDeposit:(Depend on your initial deposit)
yearlyTargetedProfit: 1.25(the best option)[if for demo, kindly put more than 3 to avoid testerStop()]
adxPe

A useful scanner/dashboard that shows the RSI values for multiple symbols and Time-frames. It can be easily hidden/displayed with a simple click on the scanner man top left of the dashboard. You can input upper and lower RSI values and the colours can be set to show when above/below these values. The default values are 70 and 30. There are also input colours for when the RSI is above or below 50 (but not exceeding the upper/lower levels
Symbols and time-frames are input separated by commas.
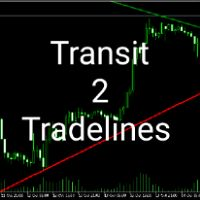
Transit2Trendline this indicator system is made to reduce the job of analyzing and to help those who can't or don't know how to draw trendlines.Transit 2 Trendlines draws only two important trendlines, support and resistance. The diagonal support is drawn in red color .The diagonal resistance is drawn in green color. Note this are very important trendlines which can easily be traded with the classic strategy of trendlines, breakout and retest. The Transit 2 Trendlines will draw patterns selected

After purchasing, you can request and receive any two of my products for free!
После покупки вы можете запросить и получить два любых моих продукта бесплатно! The fully automated algorithm is designed for long-term XAUUSD gold trading, does not require intervention and additional settings, without fairy tales and super profitability. The EA does not use dangerous trading methods like grid and averaging. The EA has four trading strategies based on Bollinger Bands, Moving Average, MACD and Chai
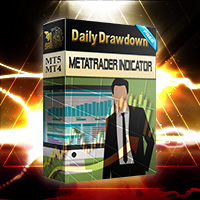
It is a very simple indicator to display daily loss percentage, open position loss percentage, monthly loss percentage and monthly profit percentage. MT4 version
We assure you that we welcome any suggestions to improve this indicator and make the necessary changes to improve this indicator.
You can contact us via Instagram, Telegram, WhatsApp, email or here. We are ready to answer you.

This is a semi-automatic Expert Advisor that opens trades automatically based on the direction you set using the trade sell / buy on the panel. The magic of this EA is that it recognizes the objects that you draw on the chart by closing the open positions at key levels, it will notify you through the mobile notification, then it will wait for the next direction. It opens orders continuously regardless of the time frame of the chart. So you don't have to stay on a lower time frame. Instead, you c

Expert Advisor can profit from 500$ to 100,000 within 10 months (depending on market conditions). How the EA works (-) EA will automatically scan for support and resistance levels formed by price action. - When found, will issue an order by setting TP and SL for you. - no matingle - not double the wood - Use the method of calculating lots as % risk of funds in the portfolio. - TF suitable for running EA is M15 - Able to run against news (When the graph is not technically correct there will be no
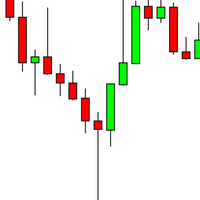
OPTMIZE EA BEFORE BACKTEST AND USE. Pin Bar Scalper scalps pin bars and momentum on 5 minute charts on the EUR/USD. Optimize the parameters to get the best out of the EA. Pin bars are popular candlesticks that show that the price has been taken over by the bulls or bears. The inputs are based around the size of the pin bars in %, which are 3 different ones. Wicks and body are the calculations within the parameter.
Test file in comments for example only. Trade the dates
_

OPTMIZE BEFORE TEST AND USE. Gold Trends trades different strategies on XAU/USD 5 minute charts and each each lot trades 1 strategy. Up to max lots, the EA will trade the strategies. The build dates and back test for the expert are from 2021 to 2022. Forward trade this EA. The strategies the EA trade use pin bars, moving averages, directional indicators and the alligator.
There are only 2 inputs and they are lots traded and the max lots you want to trade. No other optimization is needed jus
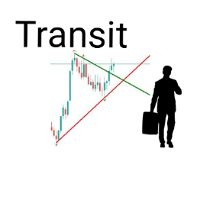
TransitX1 indicator is very useful, with unlimited signals and works on all the timeframes and all the piers. TransitX1 draws two trend lines very short trendlines (+/-20 bars) which can be considered as support and resistance. The support is in red trendline and the resistance is in green trendline. TransitX1 gives buying and selling signals, with only 3 being previous signals and the 4th one being the current signal. Buying signals are in green arrows and are always on the support trendline an

This EA helps chart pattern traders to automate thier task of placing trades. All you need to do is to draw your trend lines and name your trendlines to match the object name input in the EA.
The EA is safe to turn off anytime.
The input parameters are as follows: UpperBorderline : Upper border line of chart UpperEnteryLine: For entering trades UpperTPLine: Trendline for Take profit LowerBorder: Lower border line of chart LowerTPLine: Take profit line for lower trend line BorderChannel:
==> This is an range breakout expert adviser.
==> This inputs will allow user to make customized EA to trade any asset based on Range Breakout System.
==> Feel Free to comment additional sent requirement in comment to be added in next version.
==> This EA will close all trading with in 24 Hours no matter what is outcome. ==> You can setup target and stop loss in money or in multiple of price range factor.
==> Both are useful depending up on asset behavior
==> Other Imp
Tracker Candle Signal est un indicateur simple et pratique, capable de déterminer le mouvement des acheteurs et vendeurs, A savoir, qui aura le dessus à la fin de la chaque bougie en fonction de l'unité de temps choisi. Il est très précis sur les grandes unités de temps 1H, 4H, Daily. En effet, je l'utilises en daily pour comprendre le comportement du marché puis en 1H pour prendre position. Surtout n'hesitez pas à me faire un retour après utilisation.

==> This is an range breakout expert adviser.
==> Recommended pairs are EURUSD, GBPUSD, USDJPY, USDCHF,GBPCAD,NZDCAD ==> User is allowed to go through multiple setting parameters ==> This inputs will allow user to make customized EA to trade any asset based on Range Breakout System.
==> This will allow user to user 3 Type of Trailing Stop Loss
==> Other Improvements are coming soon ==> happy trading happy investing...! ==> Spreads are not in Pips Or Tick but, it is calculated by

MT5 플랫폼을 위한 Intraday News 전문 고문과 함께 귀하의 거래 경험을 혁신할 준비를 하십시오! 이 최첨단 도구는 뉴스 거래용으로 특별히 설계되어 NFP(비농업 급여) 보고서와 같은 영향력이 큰 이벤트를 활용할 수 있습니다. 외환 및 주식 시장에서 한 순간도 놓치지 않을 것입니다. 랏, 거래 시간, 가격 변동 및 마틴게일 승수에 대한 조정 가능한 입력을 사용하여 거래 전략을 맞춤화하세요. Intraday News를 통해 놓친 기회에 작별 인사를 하고 수익성 있는 거래를 시작하세요!
메모:
이는 백 테스터에 뉴스를 표시하지 않으며 실시간 뉴스 이벤트를 거래하도록 설정하기 위한 것입니다.
MT5 플랫폼을 위한 Intraday News 전문 고문과 함께 귀하의 거래 경험을 혁신할 준비를 하십시오! 이 최첨단 도구는 뉴스 거래용으로 특별히 설계되어 NFP(비농업 급여) 보고서와 같은 영향력이 큰 이벤트를 활용할 수 있습니다. 외환 및 주식 시장에서 한 순간도 놓

Indicator Introduction: The indicator comes from network ,It is more stable relative to RSI or CCI. You can set the indicator to send emails/notifications/alerts when the previous bar has an up or down arrow, you can specify the text of emails by inputing string into the parameter box of "UpMessages/DownMessages". It can be used to analyze market trend and design new expert that is based on trend. If the indicator below the axis ,this is a buy zone. The trend indicator is suitable for M1 and ab
FREE

The scalper EA uses strategies based on intra-bar trading on the H1 and H2 timeframes. Also many filters are used to find the right signals to open an order. The EA uses pending orders BuyStop and SellStop. The EA trades on two pairs: EURUSD, USDJPY and two timeframes H1, H2. Also, the adviser can be installed on other currencies using the instructions: https://www.mql5.com/ru/blogs/post/750726 The EA places a protective stop order on all orders. The adviser is safe and does not require any s
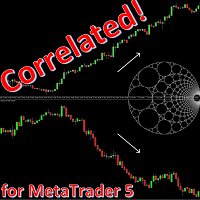
Correlation occurs when the price of two or more currency pairs move together. Being positive correlation, where prices move in the same direction or negative correlation, where they move in opposite directions. As a trader, it's important to understand that relation, as it can unconsciously affect your account's risk exposure.
Correlated is an Expert Advisor that identifies and takes advantage of divergent movements in strongly correlated currency pairs. It also shows a table of yields, stan

MACD Scanner provides the multi symbols and multi-timeframes of MACD signals. It is useful for trader to find the trading idea quickly and easily. User-friendly, visually clean, colorful, and readable. Dynamic dashboard display that can be adjusted thru the external input settings. Total Timeframes and Total symbols as well as the desired total rows/panel, so it can maximize the efficiency of using the chart space. The Highlight Stars on the certain matrix boxes line based on the selected Scan M

Wizard Poverty Sanitizer is a moving average based indicator, using three EMA'S being 2OO EMA which is the slow EMA, the 21 EMA which is the median and the 10 EMA which is the fast. When the median and the fast EMA cross a signal is given, when the fast EMA goes above the Median EMA a buying signal is given and when the fast cross below the median a selling is given. Note that you can change the moving averages to you own choices of moving averages, allowing you to set your own MA strategy. a
FREE

Promotion $66 lifetime for you.
The principle of this indicator is very simple: detecting the trend with Moving Average, then monitoring the return point of graph by using the crossing of Stochastic Oscillator and finally predicting BUY and SELL signal with arrows, alerts and notifications. The parameters are fixed and automatically calculated on each time frame. Example: If you install indicator on EURUSD, timeframe M5: the indicator will detect the main trend with the Moving Average on this t
Zig Zag Multi Time Frame Indicator counts in how many consecutive candlesticks the current Zig Zag "lit" on the different Time Frames. It can be used for both trend signal strategies and range breakout strategies. Shows simultaneously on all Frames in how many candles we have had Zig Zag value in the current swing. The Zig Zag period can be adjusted in the Indicator settings.
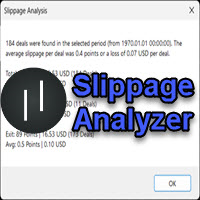
If you are using scalping strategies (or any strategy that uses stop orders for position opening or closing) you need to know your slippage. Slippage is the difference between your pending order price and the price that your brokers uses to execute your order. This can be really different and depends on the broker as well as on the market conditions (news, trading hours, etc..) With this small script you can calculate the slippage you "paid" in points and also in your account currency. You also
FREE

Pivot Point Super trend it can be used to catch price turning points and can show arrows for buying and selling. calculations are based on price peaks . you can control the price turning points by increasing the Pivot point period input on the indicator the ATR factor is for how far apart do you want the bands to be spread apart price break outs are also spotted in their early stages which will make trading much better
FREE

Scanner and Dashboard for Money Flow Index MT5 The Money Flow Index (MFI) is a technical oscillator that uses price and volume data for identifying overbought or oversold signals in an asset. It can also be used to spot divergences which warn of a trend change in price. The oscillator moves between 0 and 100.
Advantages of the Scanner: - Full Alert Options. - Multi Timefrare - Works for all instruments including Currencies, Indices, Commodities, Cryptocurrencies and Stocks. - Fully customisab
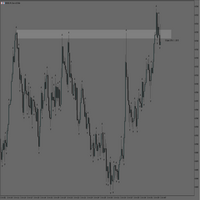
MT5 Rectangle Extender Indicator is a simple and easy tool that automatically extends any box/rectangle drawn on the chart to the right edge of the screen. This tool can be used for easy drawing of zones and can help with determining future areas of interest on the chart once price trades back to those levels. Very suitable for supply and demand, order blocks, POI's (Points of Interest) mapping on charts. Sometimes its better to have a zone than a single price level as price can shoot above or
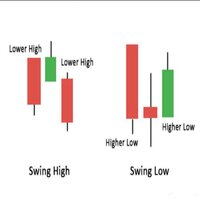
This indicator plots any and every swing high or swing low on your chart.
A swing high or low candle formation comprises of a minimum of 3 candles whereby the middle candles high/low is the highest or lowest point amongst the three candles. The direction (bullish/bearish) of the middle candle is irrelevant. Swings are very useful patterns that can be used to determine market structure as well as potential price reversal points on a chart.
This indicator is derived from the Bill Williams Frac

The Squeezer indicator simply draws ascending lines with Sell signal in the downtrend and descending lines with Buy signal in the uptrend to catch the pullbacks and sniper entries. This is a common successful trading strategy being used by many successful traders, and the good thing about this strategy is that it works with all time frames. The difference is in the take profit level between them. Buy / Sell signals are triggered at the close of the current candles above / below the ascending or

Hello;
Tw79 time zone pivot strategy indicator finds important breakdowns and ensures the continuity of the total profit target by maintaining the profit margin in the same direction after the breakdowns.
Indicator input descriptions;
Start Hours: Indicates the start and reference point. Use a number zero or one.
Offset: It expresses the number of bars to be calculated after the reference. Average values are between 55-144.
Number of bar: It represents the last candle to be calculated

This indicator draws the high intraday price and the low intraday price of the first n minutes of the day. The chart shows the days with vertical lines and two horizontal lines to indicate the max and the min close price of the n first minutes of the day. The max/min lines start and end with the day calculated. With this indicator you can see how starts the day compared with the previous days. It is valid for any market inasmuch as the start time is calculated with the data received.
Paramete
FREE

Xtrade Trend Detector is an indicator capable of finding the best opportunities to take a position in any stock market. Indeed, it is a great tool for scalpers but also for Daytraders. You could therefore use it to identify areas to trade, it fits easily on a chart. I use it to detect trends on Big timeframes and take positions on Small timeframes. Don't hesitate to give me a feedback if you test it.

Check out the new pull back strategy Expert Advisor that I'm working on right now. Get it while it's still free!
https://www.mql5.com/en/market/product/97610
Before you buy this expert adviser I strongly recommend to download FREE DEMO and test it in your Strategy tester few times. When you are satisfied with the results, you can come back to this page to buy full version for your real account.
This expert adviser was designed specifically for Volatility 75 index ( VIX75 ), also shows o
This indicator draws a price area in which the volume percentage was traded the day before. The chart shows the days with vertical lines and two horizontal lines to indicate the upper price and the lower price of the percentage of volume was traded the day before. The upper/lower lines start and end with the day calculated. But they are referred with the values of the day before. NOT the day in which are. With this indicator you can see where the volume moved in the day before. It uses percenti
FREE


Symbol: XAUUSD Attach to any timeframe Min deposit: 1500$ - Calculate profit by month
If you want daily trade, this product maybe not suit with you. Because, Too frequent deals may negatively impact copying results
Please use cent account if you not enough money
Important : Please withdraw all profit weekly or monthly
Risk Warning: Trading Forex and Leveraged Financial Instruments involves significant risk and can result in the loss of your invested capital. You should not invest m
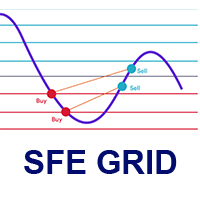
This EA is an Utility for define and execute a grid strategy. Join to the telegram group you can find in my profile page for have access to the different strategies proposed by the SFE community. BACKTEST AND LIVE The EA must be used on a M5 timeframe chart.
The current version works only in the Long side, and with symbols like BTC, ETH, GOLD, Stock Indices, STOCKS.
Do not work on Forex symbols.
This is a deliberate restriction, because the idea behind is use the strategy under 'reas

Expert Advisor for Automatic Stop Loss and Take profit , calculated by Pips and cover all major pairs . you can activated the EA in your chart then place orders manually and the EA will be place TP and SL automatically for all opened orders , covered Buy market , Sell Market , Buy stop , Sell Stop , Buy limit , Sell limit . it is an easier tool that help you manage your order without effort . 10 Pips = 100 Points Pending orders SL and TP will be placed once order is activated . MT4 Version : ht
As traders, we all know that risk management is the most important aspect of profitable trading. So, we need to determine the lot size, every time we need to open a new trade. The FX lot size calculator is a simple tool that will help you to determine your lot size easily without using any third-party service but you will be able to do that by your MetaTrader terminal. LIMITED TIME OFFER: 30$ FOR 10 ACTIVATION.
Inputs:
Maximum_Risk_Prc: To determine your preferred risk%. For example, if your r
FREE

The purpose of the Combo OnOff indicator is combine differerent tecniques and approachs to the market in order to spot signals that occur simultaneosly. A signal is more accurate if it is validate from more indicators as the adaptive expectations can be used to predict prices.The On-Off feature and alarms help to look for the better prices to enter/exit in the markets
Moving Averages are statistics that captures the average change in a data series over time
Bollinger Bands is formed by upp
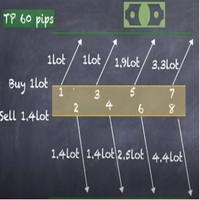
Strategy description can be seen in the attached video( https://www.youtube.com/watch?v=JzN1fEZmc40 ).
This hedging strategy strictly follows what is presented in the video.
The strategy works on any pair of forex, crypto, indices and other derivatives.
Through the settings, you can customize the size of lots, add pairs for operation, and profit and loss points.
The distance between sell and buy orders must be configured according to the number of decimal places of the pairs that will be
This indicator compares volumes from the same period to previous days instead of calculating the average of previous candles, so it is possible to detect volume anomalies more accurately.
I have always been bothered by seeing very large volumes at the beginning of a trading day and almost no volume throughout the day, making volume-based strategies very limited. This indicator can verify the strength of the volume of candles based on previous days, so it is possible to perceive volumes that ar

Good money/risk management is more than just position sizing, it's much more. Successful traders analyze your trading activities and keep an eye on your key figures. With the help of AccountMan you can also do this very conveniently, analyze your trading activities for the purpose of professional money / risk management. Evaluate your trades by trade symbol to see if trading is profitable overall with these. Would you like to keep an eye on your individual strategies? e.g. which strategy works b

An easy indicator that simply shows the moment we connect to the market. We can easily see what has happened while we were gone because the line has two different colors that show the start time. It is only that, a visualization aid that allow us to mark the market behavior while it was night time in our country, or if we have stopped several hours. Input: Server start working date: Day of month Month Year Hour Minutes
FREE
This EA is designed to automate Larry Connor’s System TPS - ( Time Position & Scale ) first described in his book “High Probability ETF Trading ” https://www.amazon.com/High-Probability-ETF-Trading-Professional/dp/0615297412 The operation of TPS can be summarized as follows: 1. Trade an ETF or Cash Index 2. The Index trades above its 200-day moving average 3. Open a 10% long position, if the 2-period RSI is below 25 for two days in a row 4. Increase position size by 20

Trailing Stop toolbox MQL5, better and friendly. Trailing Stop tool box using Moving Average, Parabolic SAR, Ichimoku Kijun-sen, trailing stop normal, trailing stop by candle, trailing stop by targets and trailing stop by lowest, highest candle numbers. Manage orders by currency pairs and comments, trailing one or many orders at same time. Mql4 versition: https://www.mql5.com/en/market/product/68181
Workflow: Set your comment, profit, stoploss, lotsize, t imeframes and chose indicator for beg

Monitor your favorite Symbols My #1 Utility: includes 65+ functions, including this tool | Contact me if you have any questions This tool opens in a separate window: it can be moved (drag anywhere), and minimized [v]. You can adjust the Watchlist on the panel: Click [edit list] to add / remove the Symbols from the Watchlist. Calculated value: it may either be the last [closed bar], or the current [floating bar]. Select the [timeframe] for calculation. There are 2 types of the value sorti
트레이딩 전략과 기술 지표를 판매하기에 가장 좋은 장소가 왜 MetaTrader 마켓인지 알고 계십니까? 광고나 소프트웨어 보호가 필요 없고, 지불 문제도 없습니다. 모든 것이 MetaTrader 마켓에서 제공됩니다.
트레이딩 기회를 놓치고 있어요:
- 무료 트레이딩 앱
- 복사용 8,000 이상의 시그널
- 금융 시장 개척을 위한 경제 뉴스
등록
로그인
계정이 없으시면, 가입하십시오
MQL5.com 웹사이트에 로그인을 하기 위해 쿠키를 허용하십시오.
브라우저에서 필요한 설정을 활성화하시지 않으면, 로그인할 수 없습니다.