YouTube'dan Mağaza ile ilgili eğitici videoları izleyin
Bir ticaret robotu veya gösterge nasıl satın alınır?
Uzman Danışmanınızı
sanal sunucuda çalıştırın
sanal sunucuda çalıştırın
Satın almadan önce göstergeyi/ticaret robotunu test edin
Mağazada kazanç sağlamak ister misiniz?
Satış için bir ürün nasıl sunulur?
MetaTrader 4 için yeni Uzman Danışmanlar ve göstergeler - 65

"TOP G ARROWS" shows price reversal points designed for scalping and intraday trading.
Contains internal reversal filters (ATR, HHLL, RSI). Can be used on all time frames and trading instruments. Can be used on M1, M5, M15 time frames for scalping or M30, H1, H4 for intraday trading, Recommended for M30 and H1. The arrows are built on candle close (appears on previous bar at the open of the new candle)

We are pleased to introduce our new and innovative product, the high-quality automated trading robot, designed to be a lifelong Passive income source. Live Monitoring Accounts
Contact me on messages
After renting or purchasing, please contact me via private message to receive the link to our Telegram group.
Also You can test the product for a period of 3 months before purchasing it for only $30.
Instructions: Use Default Setting On Those Pairs(Change only the risk type depending on Ea
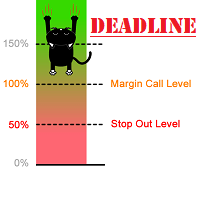
The indicator can display Stop Out, Free Margin and Margin Call lines on the chart. Y ou can also set your own line at the custom level.
Displaying these lines on the chart is especially useful for people who trade with high leverage or go all-in, where the risk is very high. You can adjust the line color, style, thickness and visibility ( for each one separately). The last parameter that can be changed is the refresh interval. If you have open orders on several stocks, the line levels will c

This is a specific trading strategy based on the movement of the Gann indicator, utilizing a conservative martingale approach. The strategy involves closing the previous trade when a trade in the opposite direction is opened. The use of a stop-loss (SL) value is optional in this case. The expert advisor is designed primarily for trading the SP500 index on a Renko chart, but it can also be applied to regular charts, other currencies, and indices. It is recommended to have a minimum leverage of 1

Automated Supply and Demand Trading Edge MT4 These videos demonstrate how we apply the supply and demand system to our latest trading review and market analysis. US Tech 100 Index Trade Setup time laps 12/6/2023. https://youtu.be/zHdjHnr3GNo https://youtu.be/JJanqcNzLGM , https://youtu.be/l70MIHaQQa4 , https://youtu.be/pg0oiT5_8y0 Enhance your Trading Strategy with the Supply and Demand Trading Edge MT4. Gain a competitive market advantage with the Supply and Demand Trading Edge MT4

The indicator has been designed to function on any time-frame and any pair. This regime filter will help the trader better evaluate whether the current market is trending, and in which direction. It quickly reacts to changes in market dynamics using a series of advanced calculations. The user is able to select whether the calculation remains standard, or if a further filter constraint is added to the calculation. A Yellow moving average of the signal has been included for the trader to smoot
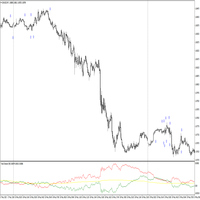
The indicator has been designed to function on any time-frame and any pair, although it is best suited for 5-minute charts. This trend filter will help the trader better evaluate whether the current market is trending, and in which direction. A dynamic filter threshold has been added to help the trader avoid choppy market conditions, and add greater confidence when entering, with an added functionality of plotting signal arrows on the chart to aid in detecting possibly entries. The Yellow in

Geolot EA is an automated trading approach that utilizes a logic of money management and a lot size sequence to operate in the foreign exchange market (Forex), specifically in the EUR/USD currency pair. Here's a description of how the Geolot strategy works:
1. Money Management: Geolot strategy employs specific money management principles to operate with an initial capital of 1.500 euros. This management determines the amount of capital to risk in each trade, based on the distance between posi
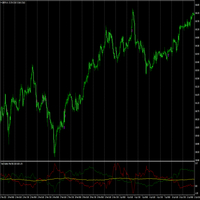
The indicator has been designed to function on any time-frame and any pair, although it is best suited for currency pairs on 5-minute charts, and used in conjunction with the Trend Direction Filter Indicator . This trend volatility filter will help the trader better evaluate whether the current market is trending, and in which direction. A dynamic filter threshold has been added to help the trader avoid choppy market conditions, and add greater confidence when entering, with an added functiona

Unleash the Power of Repetitive Market Price Levels (Markets often repeat structure ).
Are you tired of guessing the crucial support and resistance levels in your trading strategy? Do you want to enhance your decision-making process with reliable and accurate market insights? Look no further! We proudly present the interactive digital product designed to transform your trading experience – the Ultimate Support and Resistance Zones Indicator.
Unlock the Potential of Critically Watched Sup

Добрый день, Уважаемые трейдеры и инвесторы.
Вашему вниманию, советник основанный на мартингейле со встроенными индикаторами по RSI и ATR. Индикатор RSI может изменяться, тогда как ATR - нет. Советник использует динамический шаг, привязанный к показателям индикатора ATR, следовательно, с ростом волатильности, автоматически растет шаг и наоборот. Советник имеет уже подсчитанный коэффициент умножения лота в 1.45 и не требует корректировки, но в случае возникновения необходимости, это можно испр
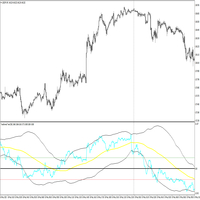
The indicator has been designed to function on any time-frame and any pair, although it is best suited for 5-minute charts. This price transformation will help the trader better evaluate whether the current market is trending, and in which direction. A dynamic filter has been added to help the trader avoid possibly entering against the trend. Two filter threshold lines may enable the trader to avoid choppy or flat market conditions. The Yellow indicator line is the filter and the Blue indica
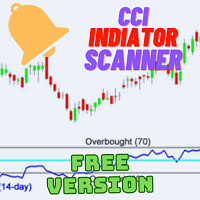
Introduction: Welcome to the world of advanced trading tools! Introducing the CCI Multicurrency Scanner, an exceptional MT4 indicator designed to revolutionize your trading experience. With its powerful features and comprehensive insights, this tool will empower you to make informed decisions and maximize your profitability. Features: Efficient Multicurrency Scanning: Our CCI Multicurrency Scanner swiftly scans multiple currencies based on your inputs. Receive instant alerts when specific condit
FREE

Dog is stronger than a wolf,Dog scalper is a fully automated scalping robot that uses a very efficient breakout strategy, advanced money management and probabilistic analysis. Most effective in the price consolidation stages that occupy the bulk of the market time. Proven itself on real accounts with an excellent risk-to-reward ratio. Does not need forced optimization, which is the main factor of its reliability and guarantee of stable profit in the future. S uitable for both beginners and expe

Note: After installation, please go to Tools>Options>Expert Advisors and add https://porsaj.com to 'Allow WebRequest for listed URL'. Still Problem?! Please check Internet connection!
Sentiment is a vital gauge that provides traders and investors with valuable insights into their perceptions of the market and the broader economy. It serves as a reflection of their collective outlook, emotions, and expectations regarding future price movements and economic conditions. Porsaj is a powerful pl
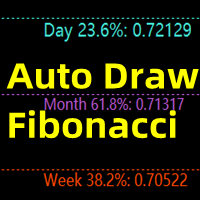
This indicator is mainly used to analyze future support and resistance levels for better trade analysis.
If the support level is effectively supported for many times, the market will break through the previous high point, and the effective trend breakout will be long.
After the down, the market cannot overshoot the pressure level for many times, and then goes down and breaks through the previous low price again, and the effective trend breaks through the short position.
When the marke

Winshots Trade Assistant EA decides when to take the the first trade based on the H1 time frame and the Stochastic indicator. It is there to assist you in deciding in which direction you should trade as well as managing all the trades you open on the same chart (it's very useful in scalping on lower time frames). The first trade will always be 1 micro lot, and decision always based on the H1 time frame. Then your job is to open further trades in the same direction as top ups MANUALLY. However

Thanks to this indicator, you can easily see the new ABCD harmonic patterns in the chart.
If the two price action lengths are equal, the system will give you a signal when it reaches the specified level.
You can set the limits as you wish. For example, You can get the signal of the price, which occurs in the Fibonaci 38.2 and 88.6 retracements, and then moves for the same length, at the level you specify. For example, it will alarm you when the price reaches 80% as a percentage.
In vertic
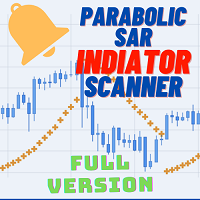
Welcome to the world of advanced trading with the Parabolic SAR Scanner Full! Maximize your trading experience with our powerful MT4 indicator designed for seamless analysis and real-time insights. Key Features: Effortless Parabolic SAR Scanning: Unlock the full potential of the Parabolic SAR Scanner Full by effortlessly scanning multiple currency pairs. Receive instant alerts when specific Parabolic SAR conditions are met, ensuring you stay ahead of market movements. Comprehensive Dashboard In

Welcome to the world of advanced trading with the RSI Multicurrency Scanner! Maximize your trading experience with our powerful MT4 indicator designed for seamless analysis and real-time insights. Key Features: Effortless RSI Scanning: Unlock the full potential of the RSI Multicurrency Scanner by effortlessly scanning multiple currency pairs. Receive instant alerts when specific Relative Strength Index (RSI) conditions are met, ensuring you stay ahead of market movements. Comprehensive Dashboar
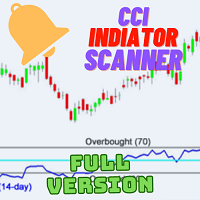
Welcome to the world of advanced trading with the CCI Multicurrency Scanner! Elevate your trading experience with our powerful MT4 indicator designed for seamless analysis and real-time insights. Key Features: Effortless CCI Scanning: Unlock the full potential of the CCI Multicurrency Scanner by effortlessly scanning multiple currency pairs. Receive instant alerts when specific Commodity Channel Index (CCI) conditions are met, ensuring you stay ahead of market movements. Comprehensive Dashboard
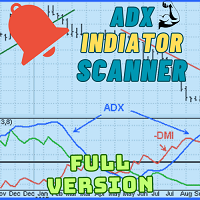
Welcome to advanced trading with the ADX Multicurrency Scanner! Elevate your trading experience with our powerful MT4 indicator, designed for seamless currency scanning and real-time insights. Key Features: Effortless Multicurrency Scanning: Unlock the full potential of the ADX Multicurrency Scanner by effortlessly scanning multiple currencies. Receive instant alerts when specific conditions are met, ensuring you stay ahead of the market and capitalize on every trading opportunity. Comprehensiv

The Time Segmented Volume (TSV) is a technical indicator that measures the volume of a financial instrument within specific time segments. It helps traders identify buying and selling pressure based on volume analysis. The TSV indicator can be used as part of a trading strategy to generate trade signals and confirm market trends. Let's explore how to use the TSV indicator as a trading strategy. To begin, add the TSV indicator to your trading platform. The TSV is typically represented as a line o

The Chaikin Oscillator is a technical indicator developed by Marc Chaikin that combines price and volume data to measure the accumulation and distribution of a financial instrument. It aims to identify potential buying and selling opportunities in the market. The Chaikin Oscillator is calculated by subtracting a 10-day exponential moving average of the Accumulation Distribution Line (ADL) from a 3-day exponential moving average of the ADL. Here's how to use the Chaikin Oscillator indicator in tr

Indicator show best signals for buy and sell orders. Indicator uses only 2 inputs: DEMA Fast Period - fast double exponential moving average period DEMA Slow Period - slow double exponential moving average period Crossings of fast and slow double double exponential moving averages shows buy and sell signals, which are drawn as green and magenta arrows respectively.

Indicator show best signals for buy and sell orders. Indicator uses only 3 inputs: DEMA Fast Period - fast double exponential moving average period DEMA Slow Period - slow double exponential moving average period DEMA Trend Period - trend double exponential moving average period
Position of price according to trend double double exponential moving average and crossings of fast and slow double double exponential moving averages shows buy and sell signals, which are drawn as gree

Indicator show best signals for buy and sell orders. Indicator uses only 2 inputs: PEMA Bounce Period - bounce percentage exponential moving average period PEMA Confirm Period - confirm percentage exponential moving average period Positions of price according to bounce and confirm percentage exponential moving averages and directions of bounce and confirm percentage exponential moving average shows buy and sell signals, which are drawn as green and magenta arrows respectively.
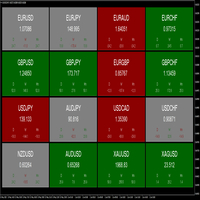
The dashboard indicator has been designed to quickly show the trader the price movements of various currency pairs. The user is able to select 3 different timeframes to analyse. When the pip difference for each respective timeframe is either positive or negative, the pair block will be coloured green or red respectively. This allows the trader to view which timeframes are in agreement, as well as the pip movements therein. A good visual tool to view multiple pairs and timeframes at once. T
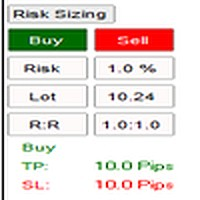
The indicator has been designed to function on any time-frame and any pair. The user is able to input their desired risk percentage per trade based on their account size, and choose whether they wish to calculate risk based on a limit order or market order. When initialised, a non-invasive button will appear on the left-hand side of the chart. Upon selection, a drop down will appear with a Buy and Sell button, these will in turn place movable lines on the chart that are used to appropriately

Note: After installation, please go to Tools>Options>Expert Advisors and add https://porsaj.com to 'Allow WebRequest for listed URL'. Still Problem?! Please check Internet connection!
An economic calendar in the context of forex refers to a tool or resource that provides information about upcoming economic events, indicators, and data releases that can potentially impact the financial markets, particularly the foreign exchange market. It helps traders stay informed about key economic announ

Expert advisor trades by pivot levels, support and resistance levels based on pivot levels. Also expert advisor takes into account volatility filter, uses standard Martingale and anti-Martingale systems, drawdown protection, standard trailing stop, trading time and trading Trade Order – direction of trading (only buy, only sell or buy and sell) Use Volatility Filter – enabling/disabling of volatility filter using Volatility Filter – value of volatility filter Count Of Days For Volatility Filter
Expert advisor places buy stop and sell stop at certain distance above and below current price. Also expert advisor uses standard trailing stop, breakeven of orders. Below is description of some inputs. Trade – option of moment for placing of orders (“Time” – placing of orders at certain time, “Candle” – placing of orders since certain candles count after last order closing or deleting) Candle – candles count after last order closing or deleting Time 1,2,3 – time for placing of orders Lot

Winfinity Robot is a fully automatic Expert Advisor. It is designed for EURUSD on H1 Timeframe and it uses different strategies to minimize the drawdown. It uses a great volatility algorithm in order to avoid to trade during high volatility. Using this algorithm, the expert advisor is able to get a high-rate of winning trades.
!!! The robot has a smart algorithm to open and close the orders, our recommendation is to not intervene with other scripts or manual over the orders. The Expert was

GOLD Secret AI has a multiple mathematical strategy combined into one Automated Trading System. Hence this EA was able to HUNT , EXECUTE and EXIT Trades. GOLD Secret AI do not use a very risky strategy such as MARTINGALE , HEDGING or GRID . GOLD Secret AI can be used only on XAU/USD(GOLD). CURRENCY PAIR RECCOMMENDATION: XAU/USD, M5 (5minutes timeframe) BROKER RECCOMMENDATION: FBS Pro Account Exness Pro Account DETAILS ABOUT INPUT PARAMETERS: Take Profit: Target Profit

Discover PM - Your Ultimate Precision Forex Indicator for Informed Trading Decisions! In the fast-paced and ever-changing world of Forex trading, having a reliable and accurate indicator can make all the difference between success and missed opportunities. Say hello to PM, the revolutionary Precision Momentum indicator, engineered to empower traders with unparalleled insights into market dynamics, volatility, and trends. At the heart of PM's power lies its ability to precisely identify moments

Super Night Scalper is the advanced scalping system which utilizes smart entry/exit algorithms with sophisticated filtering methods to identify only the safest entry points during calm periods of the market. This system is focused on a long-term stable growth. It is a professional tool developed by me years ago that is constantly updated, incorporating all the latest innovations in the trading area. Nothing fancy here, no testing Holy Grails, no "risk-free martingale", only strict rule-b

It is designed to automatically set a stop loss for open trades in the MetaTrader 4 platform. Here is a breakdown of the important parts of the script: The script uses input parameters to control its behavior. The AutoSLTP_AllSymbols parameter determines whether to track trades on all symbols or only the current symbol. The AutoSLTP_Type parameter specifies the type of orders to track: 1 for market orders, 2 for pending orders, or 3 for both. The AutoSLTP_StopLoss parameter sets the stop loss v
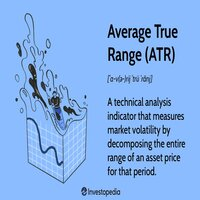
The "Wilder's Average True Range (ATR)" tool is used to measure the volatility of a financial instrument. It was developed by J. Welles Wilder Jr. and is commonly used by traders to assess the potential price range and volatility of an asset. The ATR indicator provides valuable information for setting stop loss levels, determining position sizes, and identifying potential breakouts. Here's how to use the "Wilder's Average True Range (ATR)" tool: Install the indicator: Add the ATR indicator to yo

Trend Yakalayıcı:
Alarm İndikatörü ile Trend Yakalayıcı Stratejisi, piyasa trendlerini ve potansiyel giriş ve çıkış noktalarını belirlemede yardımcı olan çok yönlü bir teknik analiz aracıdır. Piyasa koşullarına uyum sağlayarak trend yönünün net görsel temsili için dinamik bir Trend Yakalayıcı Stratejisi sunar. Tüccarlar tercihlerine ve risk toleranslarına göre parametreleri özelleştirebilirler. Gösterge, trendleri tanımlamaya yardımcı olur, potansiyel ters dönüşleri sinyaller, trailing stop m
FREE

Tanıtım Quantum Breakout PRO , Breakout Bölgeleri ile ticaret yapma şeklinizi değiştiren çığır açan MQL5 Göstergesi! 13 yılı aşkın ticaret deneyimine sahip deneyimli tüccarlardan oluşan bir ekip tarafından geliştirilen Quantum Breakout PRO , yenilikçi ve dinamik koparma bölgesi stratejisiyle ticaret yolculuğunuzu yeni zirvelere taşımak için tasarlanmıştır.
Kuantum Breakout Göstergesi, size 5 kar hedefi bölgesi ile kırılma bölgelerinde sinyal okları ve kırılma kutusuna dayalı ol
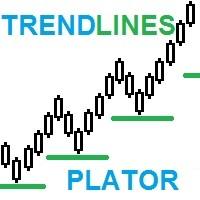
TrendLines Plator: Gelişmiş Eğilim Projeksiyon Göstergesiyle Ticaret Stratejilerinizi Güçlendirin Yenilikçi göstergemizin potansiyelini keşfedin! Daha geniş zaman aralıklarındaki eğilim çizgilerini doğrudan mevcut zaman aralığınıza analiz edebilme ve projekte edebilme yeteneği, genel olarak tüccarların dikkatini çeken stratejik bir destek sunar. Bu noktalar, işlemleriniz için stratejik destek veya direnç seviyelerine dönüşür ve ticaret stratejinizi güçlendirir. Price action göstergeleri koleksiy

Trend Chief EA, Trend Chief göstergesi ile çalışan ve piyasa gürültüsünü filtreleyen ve trendi takip eden gelişmiş bir algoritmadır. EA, m15 zaman diliminde iyi çalışır ve alım veya satım fırsatları için Trend Chief göstergesinin ana trend çizgisine bakar. Strateji: - Trend yukarı ise, EA fiyatın ana kırmızı trend çizgisini geçmesini bekleyecektir. Bu zamana kadar, diğer tüm trend çizgileri zaten yeşile dönmüştür ve trend artık yükseliş olarak belirlenmiştir ve EA satın almaya başlayacaktır. - T

Tendenceris - MT4 için Trend Göstergesi Tendenceris - Trading Becerilerinizi Geliştirin! Bu mükemmel MetaTrader 4 göstergesi ile farklı zaman dilimlerindeki trendleri gerçek zamanlı olarak takip edebilirsiniz. Trading fırsatlarını kaçırmayın! Temel Özellikler: 1 dakikadan 1 güne kadar farklı zaman dilimlerindeki trendleri izleme ve görüntüleme. Grafiğe trend bilgilerini net bir şekilde gösteren sezgisel kullanıcı arayüzü. Trend dalgalanmalarının en güncel bilgilerini sağlamak için gerçek zamanlı
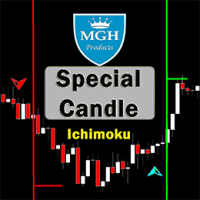
Özel Mum
En iyi Forex göstergelerinden birini başarılı bir Ichimoku stratejisi ile kullanmak ister misiniz? Ichimoku stratejisine dayanan bu Harika Göstergeyi kullanabilirsiniz. MT5 versiyonu burada bulunabilir .
İlk strateji:
Bu strateji, nadiren meydana gelen benzer güçlü kesişmelerin belirlenmesini içerir.
Bu strateji için en uygun zaman dilimleri 30 dakika (30D) ve 1 saat (H1) dir.
30 dakikalık zaman dilimi için uygun semboller şunları içerir:
• CAD/JPY
• CHF/JPY
• USD/JPY
• NZD/J

Lucky Beauty mt4, sizi hoş bir şekilde şaşırtacak bir Uzman Danışmandır. Danışmanın işi tamamen otomatiktir ve insan müdahalesi gerektirmez. Ücretsiz demo sürümünü indirin ve Expert Advisor'ı geçmiş veriler üzerinde test etmeye çalışın ve ne kadar etkili olduğunu kendiniz görün. Lucky Beauty mt4 Expert Advisor, geçmiş dönemdeki piyasayı analiz eder ve şirketimizin uzmanları tarafından Expert Advisor'a yerleştirilmiş algoritmaya dayalı olarak piyasaya olası giriş noktalarının matematiksel beklen
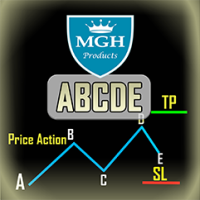
ABCDE indicator
This indicator is based on the primary abc patterns of price action (i.e. break, pullback, movement). These patterns resemble the rally base rally pattern, and a set of analyzes, such as trend analysis and divergence analysis, are checked to issue the accurate signal. It will provide pretty accurate trading signals and tell you when it's best to open and close a trade. It can be applied to any financial asset: forex, cryptocurrencies, metals, stocks, indices.
MT5 version is

The "Scalping Monster EA" Expert Advisor is based on the strategy of pending orders and an intelligent algorithm for efficient tracking. The robot is looking for the most effective points for opening orders using iSAR, iBullsPower, iBearsPower indicators. The robot also analyzes support and resistance levels. Based on these data, the robot decides when and in what direction to place pending orders. Pending orders are placed at support levels, and if they are triggered, the robot starts to accom

Introducing the Donchian Channels indicator for MQL4, a powerful technical analysis tool designed to boost your trading success. This indicator consists of four lines that represent the upper and lower boundaries of price movement over a specified period. With the Donchian Channels indicator, you can easily identify potential breakouts and reversals in the market. The upper line shows the highest high of the specified period, while the lower line represents the lowest low. The space between thes

BotGPT edition 2024 is different from what you have seen so far, it independently adapts to market conditions in real time. In 10 years, it will still be at the cutting edge and will fulfill its role flawlessly, guided by customer suggestions in order to create a perfect system, only 150 traders will be able to use it. Contact me immediately after the purchase to get personal bonus ! You can get a free copy of (Buy/Sell signal $49) indicator, please pm. me ! It's an intraday, it trades at its

Hello. I'm a Japanese engineer and have been trading since 2016.
I have developed automatic trading software many times so far, but I did not sell because of poor performance.
Finally, an automatic trading software that seems good has been completed.
* What I present here is past performance based on backtesting, and does not guarantee future profits.
Live Trading: see My signal page
The back test results in MT4 are as follows ↓ period: 2016/01/01-2023/04/30
Final profit: 478.4

The Breaker Blocks with Signals indicator aims to highlight a complete methodology based on breaker blocks. Breakout signals between the price and breaker blocks are highlighted and premium/discount swing levels are included to provide potential take profit/stop loss levels.
This script also includes alerts for each signal highlighted.
SETTINGS
Breaker Blocks
Length: Sensitivity of the detected swings used to construct breaker blocks. Higher values will return longer te

Was: $69 Now: $34 Blahtech VWAP - Volume Weighted Average Price (VWAP) is the ratio of price to total volume. It provides an average price over a specified time interval. Links [ Install | Update | Documentation ] Feature Highlights
Configurable VWAP Line Sessions, intervals, anchored or continuous Previous day settlement line Standard Deviation bands Alerts at bar close or real time Automatic Broker or Tick volumes Significantly reduced CPU usage
Input Parameters
Expert Advis

FOREX market is life itself. There is no such thing as a stable life. The same applies to FOREX. It's always about staying within a certain price range, but occasionally, there are significant deviations from that range.
Life is no different. During those times, it's important to wait patiently. Eventually, things will return to a stable range. When there is a major deviation from the range, it's an opportunity. You shouldn't miss out on this chance.
This robot uses the Envelope indicator
FREE

Urgent reminder> Only 13 copies remaining for the price to double on all renting options. Get your copy Today!
Introduction Dear Traders, I am always working to come up with tools that may help you to become a better trader and investor. Due to my experience in trading and market analysis and trading software design and development, I am glad to introduce to you my other tool called " Amazing Entries Indicator ". The Indicator is designed in a way that it combines different strategy to provide

Smoothed oscillator based on basic DeMarker indicators. Shows the volatility of the price direction. Can be used to determine intraday entry and exit points from the market.
Suitable for use on all time frames and trading instruments. It is recommended to use on M5, M15 and M30.
The green line shows the price direction up, the blue line shows the price direction down. The red line is a smoothed representation of the price. Input parameters
Period - Period of the main indicator DeMarker
FREE

The standard RSI indicator is very helpful in identifying overbought or oversold areas during a flat, but gives a lot of false signals when the market is trending. For example: during an uptrend, the standard indicator often enters the "oversold" zone and extremely rarely (most often, when the trend has already ended) enters the "overbought" zone. This indicator takes into account the trend movement and, with the selected settings, can enter the zone opposite to the trend direction, giving a sig
FREE

An extremely convenient indicator that truly makes the process of making money on the exchange easy. It is based on the scientifically rigorous theory of the market developed by the author, the beginning of which is presented here . The full algorithm of this indicator operation is presented in the article . The indicator calculates the most probable price movement trajectory and displays it on the chart. Based on the predicted price movement trajectory

INTRODUCTION There is so many trading strategies, but each pair have different characteristic. For example, EURUSD characteristic is zone to zone, break and retest, and so many sideways. GBPUSD seems like same with EURUSD, but have much spikes and larger range. XAUUSD also have same zone to zone, but with very long range between zone, breakout without retest, following trend strategies is much safe for XAUUSD. JPY pairs such as USDJPY, EURJPY, GBPJPY have much trend rather than sideways. And man

This EA has been designed to achieve stable trades regardless of market fluctuations. The optimal time frame for this EA is M5. It calculates the price changes in higher time frames, such as H1 and H4, and looks for entry points after a significant trend has occurred and the price starts to retrace.
It is recommended to set wider take profit and stop loss levels. This setup works well for one trade per day. If a trade ends in a loss, the EA waits for an opportunity to re-enter with double the
FREE

Everything is very simple here. I have never understood indicators without external parameters. And the Awesome Oscillator is no exception. Now you can customize this indicator to suit your needs and strategies.
Reference: The Awesome Oscillator indicator shows the distance in points between two moving averages (fast and slow).
The AO_Robex indicator has in its parameters a change in the period of moving averages. The default parameters are the same as in the standard indicator.
FREE
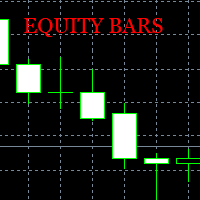
Equity charts generator creates an offline chart that draws bars corresponding to the account Equity value. The TimeFrame of the Equity chart is the same as the TimeFrame of the chart where the indicator will be placed. Input Parameters: Offline Timeframe - You can select the timeframe in minutes of the generated chart. Use opened file for adding new bars (true/false) - If set to false, a new history file is always created and bars will start drawing from the moment the indicator is placed on t

The standard RSI indicator is very helpful in identifying overbought or oversold areas during a flat, but gives a lot of false signals when the market is trending. For example: during an uptrend, the standard indicator often enters the "oversold" zone and extremely rarely (most often, when the trend has already ended) enters the "overbought" zone. This indicator takes into account the trend movement and, with the selected settings, can enter the zone opposite to the trend direction, giving a sig

Any and all liability for risks resulting from investment transactions or other asset dispositions carried out by the customer based on information received or market analysis is expressly excluded by Tradeciety. All the information made available here is generally provided to serve as an example only, without obligation, and without specific recommendations for action. It does not constitute and cannot replace investment advice. We, therefore, recommend that you contact your personal financial

Introducing Ranger ADX Expert Advisor: The Ultimate RSI Trend-Following Solution
Are you in search of a reliable and robust Expert Advisor (EA) that harnesses the power of RSI trend-following indicators? Look no further! We are proud to present Ranger ADX, an advanced EA developed based on a winning combination of the Relative Strength Index (RSI) and Moving Average (MA) indicators. With its exceptional capabilities, Ranger ADX offers a powerful solution for identifying and capitalizing on tre

The TAILOR EA is an advanced automated trading system designed specifically for the MQL market. This bot monitors the CHOCH price (character change) and market trends to place Buy Stop and Sell Stop orders in a secure and efficient manner. It offers a multitude of safety features, ensuring a smooth and reliable trading experience. Live Signal Start June 2022
Key Features :
1 : Smart Stop: The bot intelligently places stop orders to minimize losses and protect your investments.
2 : Limit

This Wonders Real Arrow indicator is designed for signal trading. This indicator generates trend signals.
It uses many algorithms and indicators to generate this signal. It tries to generate signals from the points with the highest trend potential.
This indicator is a complete trading product. This indicator does not need any additional indicators.
The indicator is never repainted. The point at which the signal is given does not change. When the signal comes the arrows are put back on

Ace Trading EA is a unique expert based on deep machine learning and hyperparameter search technology. In machine learning, an optimal model is generated to minimize the predefined loss function for given independent data. A secret advanced mathematical model that undergoes multiple optimization stages to control the market and correctly set stop loss orders based on market fluctuations. This allows for following the trend when it appears and exiting in a timely manner when the trend is likely

*This is tradingview indicator converted to mql4*
The Chandelier Exit Indicator is a popular technical analysis tool developed by Chuck LeBeau. It is designed to help traders identify potential exit points for their trades based on market volatility and the concept of trailing stops. The Chandelier Exit Indicator consists of three main components: Average True Range (ATR): The indicator utilizes the Average True Range, which measures market volatility. The ATR calculates the average range bet
FREE

*This is tradingview indicator converted to mql5*
The Trend Magic Indicator is a popular technical analysis tool used to identify the direction of a market trend and potential trend reversals. It is a versatile indicator that can be applied to various financial instruments and timeframes. The Trend Magic Indicator consists of a combination of moving averages and a volatility-based filter. It aims to smooth out price fluctuations and provide a clearer visualization of the underlying trend. He
FREE

*This is tradingview indicator converted to mql4*
The CM Slingshot System Indicator is a trading tool that aims to identify potential trade setups based on market volatility and price action. It is designed to help traders spot entry and exit points in trending markets. The CM Slingshot System Indicator combines multiple indicators and techniques to generate trading signals. Here are the key features and components of the indicator: Bollinger Bands: The indicator incorporates Bollinger Bands,
FREE
MetaTrader platformunun uygulama mağazası olan MetaTrader Mağazadan bir ticaret robotunun nasıl satın alınacağını öğrenin.
MQL5.community ödeme sistemi, PayPal, banka kartları ve popüler ödeme sistemleri aracılığıyla yapılan işlemleri destekler. Daha iyi bir müşteri deneyimi için satın almadan önce ticaret robotunu test etmenizi şiddetle tavsiye ederiz.
Ticaret fırsatlarını kaçırıyorsunuz:
- Ücretsiz ticaret uygulamaları
- İşlem kopyalama için 8.000'den fazla sinyal
- Finansal piyasaları keşfetmek için ekonomik haberler
Kayıt
Giriş yap
Gizlilik ve Veri Koruma Politikasını ve MQL5.com Kullanım Şartlarını kabul edersiniz
Hesabınız yoksa, lütfen kaydolun
MQL5.com web sitesine giriş yapmak için çerezlerin kullanımına izin vermelisiniz.
Lütfen tarayıcınızda gerekli ayarı etkinleştirin, aksi takdirde giriş yapamazsınız.