YouTube'dan Mağaza ile ilgili eğitici videoları izleyin
Bir alım-satım robotu veya gösterge nasıl satın alınır?
Uzman Danışmanınızı
sanal sunucuda çalıştırın
sanal sunucuda çalıştırın
Satın almadan önce göstergeyi/alım-satım robotunu test edin
Mağazada kazanç sağlamak ister misiniz?
Satış için bir ürün nasıl sunulur?
MetaTrader 4 için yeni Uzman Danışmanlar ve göstergeler - 296

The market profile indicator provides with an X-Ray vision into market activity, outlining the most important price levels, value area and control value of the daily trading session. [ Installation Guide | Update Guide | Troubleshooting | FAQ | All Products ] Easy to understand and use Understand market dynamics easily Automatic timeframe selection Identify zones of trading value and discard others It is useful in all market conditions Effective for any trading strategy It implements three color
This multi-timeframe indicator identifies the market's tendency to trade within a narrow price band. [ Installation Guide | Update Guide | Troubleshooting | FAQ | All Products ]
It is easy to understand Finds overbought and oversold situations Draws at bar closing and does not backpaint The calculation timeframe is customizable The red line is the overbought price The green line is the oversold price It has straightforward trading implications. Look for buying opportunities when the market is o
Identify trending and flat markets effortlessly
This indicator calculates how much has a symbol moved in relative terms to find trending or flat markets. It displays what percentage of the latest price range is directional. It can be used to avoid trading in flat markets, or to find flat markets to execute range-bound trading strategies. [ Installation Guide | Update Guide | Troubleshooting | FAQ | All Products ] A value of zero means the market is absolutely flat A value of 100 means the marke

This is a non-indicator Expert Advisor based on steady (no roll-backs) price movement. When the price moves a defined distance without changing a direction, one point goes to bulls or bears depending on the price movement direction. When a predefined amount of points is reached, a position is opened. The Expert Advisor uses average weighted stop loss, take profit, breakeven and trailing stop levels. Parameters PriceMove – amount of points to be passed by the price without changing direction; Win

This is a fully automated smart adaptive algorithm. The SKYNET system calculates the history data and performs the analysis based on the probability percentage of where the upcoming breakout of the support and resistance level will take place, and places pending orders. The Expert Advisor adapts to any market conditions. It was backtested and optimized using real ticks with 99,9% quality. It has successfully completed stress testing. The EA contains the algorithm of statistics collection with ou

This indicator finds Three Drives patterns. The Three Drives pattern is a 6-point reversal pattern characterised by a series of higher highs or lower lows that complete at a 127% or 161.8% Fibonacci extension. It signals that the market is exhausted and a reversal can happen. [ Installation Guide | Update Guide | Troubleshooting | FAQ | All Products ] Customizable pattern sizes
Customizable colors and sizes
Customizable breakout periods Customizable 1-2-3 and 0-A-B ratios
It implements visual/s
The BG Grid is a new generation grid EA. It can also be used for trading single orders without a grid and lot increase. It is most efficient on cross pairs on the М30 and Н1 timeframes. AUDCAD M30, GBPCAD M30, NZDCAD H1, GBPCHF H1. This is a counter-trend EA and it enters the market at the time of a possible correction of the trend. Entries are based on the standard MT4 indicators. As any other grid EA, during a drawdown, the BG Grid places an order grid and eventually closes it in net profit by

This indicator is Demo version of FiboRec and works only on EURUSD This indicator depends on Fibonacci lines but there are secret lines I used. By using FiboRec indicator you will be able to know a lot of important information in the market such as:
Features You can avoid entry during market turbulence. You can enter orders in general trend only. You will know if the trend is strong or weak.
Signal Types and Frame used You can use this indicator just on H1 frame. Enter buy order in case Candle
FREE

Ortaya çıkan çizgilerin çok katmanlı düzleştirilmesi ve geniş bir parametre seçimi özelliğine sahip benzersiz "ölçeklendirme" trend göstergesi. Trendde olası bir değişikliğin veya hareketin hemen hemen başlangıcına yakın bir düzeltmenin belirlenmesine yardımcı olur. Değiştirilen kesişme okları sabittir ve yeni bir çubuğun açılışında görünür, ancak yeterli deneyime sahipseniz, gösterge çizgileri bitmemiş çubukta kesiştiği anda giriş fırsatlarını aramak mümkündür. Sinyal görünüm sınırı seviyeleri,
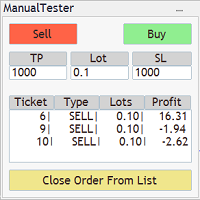
The Manual BackTester Panel utility allows to simulate the manual trading in the MetaTrader 4 strategy tester. The panel works only in the virtual mode of the MetaTrader 4 strategy tester. The demo version allows to open and close ten orders, then the program will automatically turn off. The utility has no parameters at initialization.
Panel Description: The panel has Buy and Sell buttons for placing market orders. It is possible to set the Take Profit and the Stop Loss in the TP and SL fields,

Benefit EA is a non-indicative flexible grid adviser with special entry points that provide a statistical advantage, revealed through the mathematical modeling of market patterns. The EA does not use stop loss. All trades are closed by take profit or trailing stop. It is possible to plan the lot increments. The "Time Filter" function is set according to the internal time of the terminal as per the displayed time of the instrument's server, not the operating system (can match). This function allo
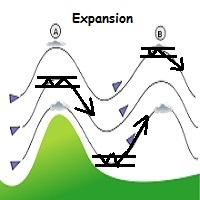
WindExpansion is a fully automated solution to get a smart edge type from the market: it will enter when the “smart money” is starting to heavy push the market (after accumulation/distribution phases that form tiny ranges) and volume is expanding due big interest to sustain the price caused by psychological buying/selling pressure; when this situation happens many traders will try to fade the move but “big dogs” will be stronger and collect profits by the crowd; when the opposite situation happe

This indicator helps you to scan all symbols which are in the Market Watch window and filter out a trend with alerts. It works on five most effective indicators which are used by most of traders for trading: Moving Average Average Directional Moment (ADX) Relative Strength Index (RSI) Parabolic SAR MACD It calculates two bars for scanning. When box colour changes to coral or royal blue colour, it indicates you for trend change for long and short entry. And also you will get alert on screen. When
FREE

This is a utility to copy in Expert Advisor folder. The EA will force the download of your History Center MetaTrader. It will not download new data from your broker but it will aid your MT4 to charge every chart correctly. You can choose the symbols to download. After the launch, the EA will be removed automatically from the chart. After the launch, you can see results under Experts panel on MT4. The log will show you the data charged or not charged. Symbol TF = Number of candles charged. Ex: Su
FREE

The Expert Advisor uses the strategy based on the breakdown of the most important support and resistance levels. Adaptive trade trailing algorithm is used. The EA uses a very small SL so the account is always protected from equity drawdown with a very low risk-per-trade. The EA integrates a system of partial position closure during slippages (can be configured). It was backtested and optimized using real ticks with 99,9% quality. It has successfully completed stress testing. The EA contains the
Minimalist and fully customizable info panel. It works on any chart and timeframe, with 2 - 4 digits brokers and with 3 - 5 digits ones. It can show: Current Spread in pips (1 decimal digit if you are on a 3 - 5 digits broker) ATR (Average True Range) in pips Current Server Time Current GMT Time Important Account Info: Current Leverage and Stop-out Level (%) Time left for the current bar. Very useful on 4 h charts All info labels have a tooltip with the same data Available customizations : Enabl
FREE

A very powerful tool that analyzes the direction and the strength of the 8 major currencies: EUR, GBP, AUD, NZD, CAD, CHF, JPY, USD – both in real time, and on historical data. The indicator generates a sound signal and a message when a trend changes. Never repaints signal. The strength of the signal is calculated for all pairs which include these currencies (28 pairs total), can have value from 0 to 6 on a bullish trend, and from 0 to -6 on a bearish trend. Thus, you will never miss a good move

Let us analyze what supply and demand are, and how relevant the expression "market memory" is. The screenshots show the operation of the SupDem-Pro custom indicator, it is the improved version of my previously created Shved Supply and Demand indicator. In order to create it, I gave up trading for almost 3 years and studied a lot of literature, I have not traded during this time, but only analyzed the behavior of the price in different situations. It took me quite a long time to correctly formula

This utility allows to record the spread value to the file, which is equal to or greater than the value specified in the settings, at the specified time. The utility also displays useful information on the symbol's chart: current spread value in points, name of account holder, name of trading server, leverage, the size of the swap for buy orders, the size of the swap for sell orders, day of the week for accruing triple swap, the size of a point in the quote currency, the minimum allowed level of
FREE

The script automatically downloads historical data for all instruments from the "Market Watch" window, on all timeframes from M1 to MN1. It is recommended to use the script before launching multi-symbol and multi-timeframe indicators that work simultaneously with many instruments. Features: To download quotes, the script uses the MQL API only. This is a necessary requirement for publishing programs on the MQL-Market. This method is fast enough, but effective in not all cases. A more reliable (bu
FREE

This is Demo Version of PipsFactoryDaily This indicator depends on High and Low price of currency in the last day, and then I made some secret equations to draw 10 lines.
Features You will know what exactly price you should enter the market. You will know when to be out of market. You will know what you should do in market: Buy Sell Take profit, and there are three levels to take your profit Support Resistance Risk to buy Risk to sell
Signal Types and Timeframes Used You can use this indicator
FREE

This is Demo version of PipsFactoryWeekly This indicator depends on High and Low price of Currency in last Week and then i made some secret equations to draw 10 lines.
Features: You will know what exactly price you should enter the market . You will know when to be out of market. You will know you what should you do in market: Buy Sell Take profit and there are 3 levels to take your profit Support Resistance Risk to buy Risk to Sell
Signal Types and Frame used: You can use this indicator just
FREE

This is Demo Version of PipsFactoryMonthly This indicator depends on High and Low price of Currency in last Month and then i made some secret equations to draw 10 lines.
Features You will know what exactly price you should enter the market. You will know when to be out of market. You will know you what should you do in market: Buy Sell Take profit and there are 3 levels to take your profit Support Resistance Risk to buy Risk to Sell
Signal Types and Timeframe Used You can use this indicator ju
FREE

MetaCOT 2 is a set of indicators and specialized utilities for the analysis of the U.S. Commodity Futures Trading Commission reports. Thanks to the reports issued by the Commission, it is possible to analyze the size and direction of the positions of the major market participants, which brings the long-term price prediction accuracy to a new higher-quality level, inaccessible to most traders. The indicator of absolute positions shows the dynamics of the open positions or the number of traders in

MetaCOT 2 is a set of indicators and specialized utilities for the analysis of the U.S. Commodity Futures Trading Commission reports. Thanks to the reports issued by the Commission, it is possible to analyze the size and direction of the positions of the major market participants, which brings the long-term price prediction accuracy to a new higher-quality level, inaccessible to most traders. The indicator of the net positions of the market participants displays the difference between the long a
This is a medium-term conservative system. It tracks quote movements and defines entry points. The Expert Advisor is completely automated and features the unique algorithm. It has been designed for trading AUDUSD and is based on a range trading strategy. Extreme levels are defined based on history, and the EA starts trading expecting a roll-back. Two limit orders are set in case the price moves further. This product continues the EA Permanent series. Dynamic incoming data filtration method is us
This is a medium-term conservative system. It tracks quote movements and defines entry points. The Expert Advisor is completely automated and features the unique algorithm. It has been designed for trading EURCHF and is based on a range trading strategy. Extreme levels are defined based on history, and the EA starts trading expecting a roll-back. Two limit orders are set in case the price moves further. This product continues the EA Permanent series. Dynamic incoming data filtration method is us

MetaCOT 2 is a set of indicators and specialized utilities for the analysis of the U.S. Commodity Futures Trading Commission reports. Thanks to the reports issued by the Commission, it is possible to analyze the size and direction of the positions of the major market participants, which brings the long-term price prediction accuracy to a new higher-quality level, inaccessible to most traders. These indicators, related to the fundamental analysis, can also be used as an effective long-term filter

Introduction: Whatever trading method you use, it is important to know the Pivot levels to take the key attention for your entries & exits. This indicator has been made using the standard classic formula for Auto drawing the Pivot levels. Also based on the previous day trading range, the probable expected today trading range has been highlighted in a different color for your reference.
Output of the Indicator: This Indicator gives the Pivot level Different resistance Levels Different Support le

Otomatik Ayar kaybı durdurma, kar alma, takip eden durdurma, başabaş seviyeleri, sanal durdurmaları etkinleştirme.
Exp Assistant , pozisyonlarınızın bakımını organize etmenize yardımcı olacaktır. Bu Uzman Danışman, pozisyonlarınız için gerekli tüm stop loss ve kâr seviyelerini belirleyecektir. Tüm Expert Advisor işlemi, tablodaki kontrol panelinden yönetilir. Açık pozisyonlarınız varsa ancak Uzman Danışmanınız zarar durdur, kar al, takip eden stop veya başabaş ayarlayamıyorsa ve manuel olarak
FREE

Elliott Wave Counter, Elliott dalgalarının hızlı ve kullanıcı dostu manuel olarak işaretlenmesine yönelik bir paneldir. Bir renk ve işaret seviyesi seçilebilir. Son işaretlemeyi ve araç tarafından yapılan tüm işaretlemeyi kaldırma işlevleri de vardır. İşaretleme tek bir tıklamayla yapılır. Beş kez tıklayın - beş dalganız olsun! Elliott Dalga Sayacı, Elliott dalgalarının hem yeni başlayanlar hem de profesyonel analistleri için harika bir araç olacaktır. Elliott Wave Sayacı Kurulum ve Giriş Kılavu

Gösterge, mevcut fiyat yönünü ve piyasa oynaklığını belirlemenizi sağlar. Traders Dynamic Index'in bu sürümü, geçmiş verilerin yeniden çizilmesini ortadan kaldırdı, algoritma hesaplama hızı optimize edildi, daha hassas ayarlamalar için daha fazla harici parametreye ve genişletilmiş işlevselliklere sahiptir: ilk osilatör seçimi ve ortalamaların yumuşatma yöntemleri eklendi . parametreler: Mode Osc - tahmin osilatör seçimi Period Osc - kullanılan osilatörün hesaplama periyodu Price Osc - salınım h
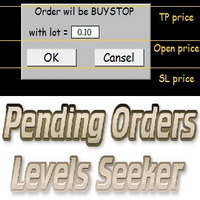
This script is designed for quick and precise placement of pending orders. Just drag and drop it on the chart. Select the position for Open price, TP price and/or SL price. Pending Orders Levels Seeker understands what kind of pending orders you want to place. It warns you if there are incorrect values in Open price, TP price or SL price. Lot can be changed from the panel of the script only at the first launch or if you want to set a new value for it. The script remembers the lot size of the las

This indicator helps you determine the evolution of the price depending on how these fly objects are shown in the chart. When the gliders opens their wings considerably warns us of a possible change in trend. On the contrary, when seems to get speed (looks thin because lines of wings are grouped) demonstrates safety and continuity in trend. Each wing of a glider is a directrix between the closing price and the high/low prices of the previous bar. The color (green/red) of each glider foresees bet
FREE

The indicator looks for market sentiment impulses and notifies traders accordingly. The indicator can notify of a detected impulse via a sound or alert, as well as emails. You can select the color and display type for bullish and bearish moods. Mood arrow appears on the current bar and remains intact after the bar is formed provided that the bar forming conditions have not changed. At least 100 history bars are required for the indicator operation.
Inputs Period - period of the indicator calcul

MetaCOT 2 is a set of indicators and specialized utilities for the analysis of the U.S. Commodity Futures Trading Commission reports. Thanks to the reports issued by the Commission, it is possible to analyze the size and direction of the positions of the major market participants, which brings the long-term price prediction accuracy to a new higher-quality level, inaccessible to most traders. These indicators, related to the fundamental analysis, can also be used as an effective long-term filter
FREE

This is a news Expert Advisor trading by the economic calendar. It features the following working modes: Manual – trader sets the news time on its own Automatic – the EA takes the news release time and its importance from the news website Several modes of customizable parameters allow the EA to conveniently adjust the EA to your trading strategy. The trading robot automatically determines the time zone, the news importance, the currency affected by the news release, displaying the news on a char
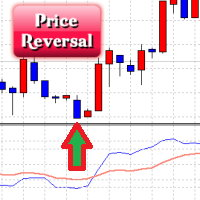
The Price Reversal oscillator identifies the potential price reversal points, while being in the overbought/oversold zones. It also displays the entry signals against the trend (sometimes these points coincide with the beginning of a new trend) (blue and red zones) and the entry points by the trend (gray areas). It consists of two lines. The blue line is the fast line, the red line is the slow one. The market entry is recommended if the value of the fast line is greater than 60 or less than -60,

The indicator displays the standard price deviation from the root mean moving average line in the additional window. The screenshot displays the standard indicator (the lower one) and SqrtDev (the upper one).
Parameters SqrtPeriod - root mean line and standard deviation period. SqrtPrice - applied price (drop-down list). BarsCount - amount of processed bars (reduces the download time when applying to a chart and using in programs).
This indicator depends on High and Low price of Currency in last Month and then i made some secret equations to draw 10 lines.
Features You will know what exactly price you should enter the market . You will know when to be out of market. You will know you what should you do in market: Buy Sell Take profit and there are 3 levels to take your profit Support Resistance Risk to buy Risk to Sell
Signal Types and Timeframe Used You can use this indicator just on H4 timeframe and you have to downloa

MetaCOT 2 is a set of indicators and specialized utilities for the analysis of the U.S. Commodity Futures Trading Commission reports. Thanks to the reports issued by the Commission, it is possible to analyze the size and direction of the positions of the major market participants, which brings the long-term price prediction accuracy to a new higher-quality level, inaccessible to most traders. These indicators, related to the fundamental analysis, can also be used as an effective long-term filter

This indicator depends on High and Low price of currency in the last day, and then I made some secret equations to draw 10 lines.
Features You will know what exactly price you should enter the market. You will know when to be out of market. You will know what you should do in market: Buy Sell Take profit, and there are three levels to take your profit Support Resistance Risk to buy Risk to sell
Signal Types and Timeframes Used You can use this indicator just on (M1, M5, M15, M30, H1) timeframe

The EA consists of 100 virtual Prototype-4 EAs with different settings. The outcome of calculations is the resulting lot. The idea behind the virtual strategies is that in case any of the virtual strategies is "wiped", the entire deposit is not, it is only decreased by 1/100, i.e. 1% (when using Risk=5000, VirtualBalance=5000). It is possible to set the lot size to start opening positions, the step and the maximum number of opened lots and positions using the settings of the EA. The Expert Advis

The indicator displays peak levels of activity formed by the maximum volume, tracks the correlation of the candles on all timeframes (from the highest to the lowest one). Each volume level is a kind of key trading activity. The most important cluster is inside a month, week, day, hour, etc.
Indicator operation features A volume level receives Demand status if the nearest volume level located to the left and above has been broken upwards. A volume level receives Supply status if the nearest volu

The Quantum VPOC indicator has been developed to expand the two dimensional study of volume and price, to a three dimensional one which embraces time. The volume/price/time relationship then provides real insight to the inner workings of the market and the heartbeat of sentiment and risk which drives the price action accordingly. The Quantum VPOC indicator displays several key pieces of information on the chart as follows: Volume Profile - this appears as a histogram of volume on the vertical pr

The indicator detects and displays М. Gartley's Butterfly pattern. The pattern is plotted by the extreme values of the ZigZag indicator (included in the resources, no need to install). After detecting the pattern, the indicator notifies of that by the pop-up window, a mobile notification and an email. The pattern and wave parameters are displayed on the screenshots. The default parameters are used for demonstration purposes only in order to increase the amount of detected patterns.
Parameters z

By purchasing this indicator, you have the right to receive a free copy of one of my other indicator's or advisor’s! (All future updates are included. No limits) . To get it , please contact me by mql5 message ! The Trend Scanner trend line indicator displays the trend direction and its changes. The indicator works on all currency pairs and timeframes. The indicator simultaneously displays multiple readings on the price chart: the support and resistance lines of the currency pair, the exist

Special offer! https://www.mql5.com/ru/users/bossik2810
This is a powerful system for binary options and intraday trading. The indicator neither repaints, nor changes its readings. Binary Reverse is designed to determine the points where the price reverses. The indicator fixes both reversals and roll-backs considerably expanding your analytical capabilities. It not only clearly shows correction and reversal points, but also tracks the overall trend dynamics. Trading recommendations Coincidenc

The Expert Advisor of the Forex Fraus family, the system is designed for scalping the EURUSD M1 (for five-digit quotes) and adapted for the accounts with fast execution of orders.
Operation Principle Buys when passing 100% of the bearish candle volume and sells when passing 100% of the bullish candle volume; When a signal is received, the orders are opened by injection, using tick data; Positions are closed by Trailing Stop; Not closed positions are closed at the opposite trade; Built-in adjust

Chappie is a smart adaptable robot, Chappie trades based on multiple trading systems using pending orders, the robot manipulates the pending orders, following the price movement of the market and calculates the price movement for the most accurate market entry. Basic EA settings are calculated for EURUSD. Over 1000 tests have been performed on real and history data with 99.9% quality. Chappie is a result of a long term development. The main idea is to preserve capital through unexpected fluctuat

This indicator depends on High and Low price of Currency in last Week and then i made some secret equations to draw 10 lines.
Features: You will know what exactly price you should enter the market . You will know when to be out of market. You will know you what should you do in market: Buy Sell Take profit and there are 3 levels to take your profit Support Resistance Risk to buy Risk to Sell
Signal Types and Frame used: You can use this indicator just on H4 frame and you have to download the h

The Expert Advisor trades by two Moving Average lines. There are also two types of order closing: 1) if there is an opposite signal, 2) closing order by take profit, stop loss, and trailing stop. You can configure Moving Average indicators.
Key Advantages Ability to work with fixed lot and MM. Six trailing stop modifications. Easy to use. Two types of order closing. The EA works with all brokers.
Parameters General Order Type – trade directions. Use_Risk_MM – if true , lot size is increased wh

The indicator displays the averaged value of the moving averages of the current and two higher timeframes with the same parameters on the chart. If the moving averages are located one above the other, the resulting one is painted in green, showing an uptrend, in the opposite direction - red color (downtrend), intertwined - yellow color (transitional state)
The indicator parameters MaPeriod - moving average period MaMethod - moving average method (drop-down list) MaShift - moving average shift M

The indicator displays the price movement on the chart, which is smoothed by the root mean square function. The screenshot shows the moving average with period 20, the smoothed root mean square (red) and simple SMA (yellow).
The indicator parameters MAPeriod - Moving average period MaPrice - applied price (drop down list, similar to the standard MovingAverage average) BarsCount - number of processed bars (reduces download time when attaching to the chart and using in programs).

Tek Tıkla Analiz Aracı, klavye kısayolu tabanlı nesne oluşturma ve MetaTrader için kopyalama aracı. MetaTrader'daki analiz araçlarını tek tıklamayla kullanmayı kolaylaştırır. Aracımızla, grafiğinizdeki destek ve direnç seviyelerini, Fibonacci seviyelerini, şekilleri, kanalları, trend çizgilerini ve diğer tüm nesneleri hızlı bir şekilde çizebilirsiniz. Düğmeye tıklayın, fareyi hareket ettirin ve Tek Tıklamayla Analiz Aracı gerisini sizin için halleder. Bu size zaman kazandırabilir ve

The indicator displays market profiles of any duration in any place on the chart. Simply create a rectangle on the chart and this rectangle will be automatically filled by the profile. Change the size of the rectangle or move it - the profile will automatically follow the changes.
Operation features
The indicator is controlled directly from the chart window using the panel of buttons and fields for entering parameters. In the lower right corner of the chart window there is a pop-up "AP" button

EA Innovative PRO is a fully automated EA for Forex trading. It is based on three combined adaptive algorithms. Follows the movement of market price. It was backtested and optimized using real ticks with 99,9% quality. The Expert Advisor has successfully passed the stress test with slippage and commission approximate to the real market conditions. The EA eliminates the extra noise and chooses the most convenient strategy for trading. Dynamically places trailing stop and moves profit to breakeven

The indicator displays the moving average of a higher timeframe on the chart.
The indicator parameters TimeFrame - time frame of the moving average (drop-down list) MaPeriod - moving average period MaMethod - moving average method (drop-down list) MaShift - moving average shift MaPrice - moving average price (drop-down list)

The indicator displays the data of the Average True Range (ATR) from a higher timeframe on the chart. It allows you to see the scope of the movement without having to switch to another screen terminal
The indicator parameters TimeFrame - time frame of the data (drop-down list) can not be lower than current AtrPeriod - period of the Average True Range indicator a higher timeframe range

The indicator displays the data of the standard ADX indicator from a higher timeframe on the chart. Several indicators with different timeframe settings can be placed on a single chart.
The indicator parameters TimeFrame - time frame of the data (drop-down list) can not be lower than current AdxPeriod - period of the indicator for a higher timeframe AdxPrice - prices for the calculation of the indicator data from a higher timeframe

This indicator depends on Fibonacci lines but there is a secret lines i used them, by using FiboRec indicator you will be able to know a lot of important information in the market such as:
Features You can avoid entry during market turbulence. You can enter orders in general trend only. You will know if the trend is strong or weak.
Signal Types and Frame used You can use this indicator just on H1 frame. Enter buy order in case Candle break out the square area and closed over it, at least 20 pi

IceFX VelocityMeter Mini is a very unique indicator on MetaTrader 4 platform which measures the speed of the Forex market . It is not a normal volume or other measurement indicator because IceFX VelocityMeter Mini is capable to understand market speed movements which are hidden in ticks and those valuable information cannot be read in an ordinary way from the candles. The software monitors the received ticks (frequency, magnitude of change) within a specified time range, analyzes these info and

The indicator detects divergence signals - the divergences between the price peaks and the MACD oscillator values. The signals are displayed as arrows in the additional window and are maintained by the messages in a pop-up window, e-mails and push-notifications. The conditions which formed the signal are displayed by lines on the chart and in the indicator window.
Indicator Parameters MacdFast - fast MACD line period MacdSlow - slow MACD line period MacdSignal - MACD signal line period MacdPric

This EA uses most popular Indicators to test your own strategy and use it to trade. You can combine each Indicator to match your strategy. Many features included like Auto Stop Loss, Take Profit, Trailing Stop, Profit Lock, Pending Orders, Etc. Each Indicator has additional parameters eg. TimeFrame, Signal Method, Reverse Signal.
Indicators Moving Average 1/2/3 Parabolic SAR MACD Envelopes Bollinger Bands Alligator Fractals ADX Stochastic RVI RSI CCI DeMarker Momentum ATR
Additional Indicators

Gösterge, olası minimum gecikme ile yeniden boyama yapmadan grafikte harmonik desenleri gösterir. Gösterge üstleri arayışı, fiyat analizinin dalga ilkesine dayanmaktadır. Gelişmiş ayarlar, ticaret tarzınız için parametreler seçmenize olanak tanır. Bir mumun (çubuk) açılışında, yeni bir model oluşturulduğunda, fiyat hareketinin olası yönünün değişmeyen bir oku sabitlenir. Gösterge aşağıdaki kalıpları ve çeşitlerini tanır: ABCD, Gartley (Butterfly, Crab, Bat), 3Drives, 5-0, Batman, SHS, One2On

This is an innovative intelligent system consisting of 4 strategies, which detects high-probability entries for price action breakouts on the H1 timeframe. The Expert Advisor includes 3 complex technical strategies and a scalping strategy. The Expert Advisor is fully optimized and ready to use! It is possible to disable each strategy or use them all together. The EA uses a very small SL so the account is always protected from equity drawdown with a very low risk-per-trade. The potential accumula

Follow the trail of the comet to know the development of the trend. This indicator helps you to determine the evolution of the price depending on how these astronomical objects are shown in the chart. When the comet seems to stop, it opens its tails considerably and warns us of a possible change in trend. On the contrary, when it seems to get speed (looks thin because lines of tail are grouped) demonstrates safety and continuity in trend. The head or comet nucleus will show red or green accordin
FREE

Ultimate Divergence Scanner (Multi Pair And Multi Time Frame) : ---LIMITED TIME OFFER: NEXT 25 CLIENTS ONLY ---46% OFF REGULAR PRICE AND 2 FREE BONUSES ---SEE BELOW FOR FULL DETAILS It is a widely known market principle that momentum generally precedes price.
Making divergence patterns a clear indication that price and momentum are not in agreement.
Divergence patterns are widely used by institutional traders around the world. As they allow you to manage
your trades within strictly defin

The HeLL_Cat Expert Advisor is a powerful trading tool, suitable both for professionals and beginners. Its arsenal includes various strategies - the HeLL_Cat mode, the Safe mode and the News mode. The HeLL_Cat mode uses the adaptive trading strategy based on a neural network consisting of 4 interconnected logical cores. A distinctive feature of this mode is the strategy of partial overlap and construction of an orders grid with an adaptive lot ratio increase depending on the behavior of the mark

Currency Correlation Plus is an expensive version of the indicator. It is equipped with the signal and is more equipped than its cheaper brother. The indicator helps us understand and see a correlation. Second chart makes it easy to analyze and trade multiple currencies. On the chart, you can post multiple pairs. Type in the selected currency pair in the settings and add it to the chart.
Inputs One indicator on chart=True / two or more=False Alert Signal buy and sell for first chart and second
MetaTrader platformunun uygulama mağazası olan MetaTrader mağazasından bir alım-satım robotunun nasıl satın alınacağını öğrenin.
MQL5.community ödeme sistemi, PayPal, banka kartları ve popüler ödeme sistemleri aracılığıyla yapılan işlemleri destekler. Daha iyi bir müşteri deneyimi için satın almadan önce alım-satım robotunu test etmenizi şiddetle tavsiye ederiz.
Alım-satım fırsatlarını kaçırıyorsunuz:
- Ücretsiz alım-satım uygulamaları
- İşlem kopyalama için 8.000'den fazla sinyal
- Finansal piyasaları keşfetmek için ekonomik haberler
Kayıt
Giriş yap
Gizlilik ve Veri Koruma Politikasını ve MQL5.com Kullanım Şartlarını kabul edersiniz
Hesabınız yoksa, lütfen kaydolun
MQL5.com web sitesine giriş yapmak için çerezlerin kullanımına izin vermelisiniz.
Lütfen tarayıcınızda gerekli ayarı etkinleştirin, aksi takdirde giriş yapamazsınız.