YouTube'dan Mağaza ile ilgili eğitici videoları izleyin
Bir ticaret robotu veya gösterge nasıl satın alınır?
Uzman Danışmanınızı
sanal sunucuda çalıştırın
sanal sunucuda çalıştırın
Satın almadan önce göstergeyi/ticaret robotunu test edin
Mağazada kazanç sağlamak ister misiniz?
Satış için bir ürün nasıl sunulur?
MetaTrader 4 için ücretli teknik göstergeler - 109

Renko Masterx, renko grafikleriyle işlem yapmak için tasarlanmış mt4 ok tipi bir göstergedir, bu gösterge, tüccara kazanma oranı ve kazanılan puanlar gibi yararlı bilgileri söyleyen bir geriye dönük test panosuna sahiptir, ayrıca atr x çarpımında tp ve sl'yi verir, bu gösterge onun değerini verir. Çubuk açık veya çubuk içi sinyalin verildiği ve sinyalin verildiği tam fiyatı işaretleyecek beyaz bir işaretleyicinin bulunduğu bu göstergeyi kullanmanın yolu, göstergenin verdiği oka göre bir alım ve
ダイバージェンス はオシレーター系のテクニカル指標が、実際の相場とは逆方向に向かって動いている状態のことを指し、その後のトレンド転換の可能性を示す戦略として有効です。
このインディケータは特に有効性の高いMACDのダイバージェンスを利用した 裁量トレード用サインツールです。
高頻度かつ高い 勝率で サインを発信しますが、各種の強力なフィルターにより、さらに精度の高いサインに絞ることが出来ます。また、通常のダイバージェンスに加えリバーサル( 隠れダイバージェンス) によるサイン発信も可能です。
全通貨ペア、全タイムフレームで利用できます。勝敗判定機能により、このインディケータの直近の相場環境に対する有効性を確認できます。
設定項目は以下の通りです。 Enable Divergence...MACDのDivergenceによるサインの発信を有効にします。ピンクの矢印が表示されます Enable Reversal...MACDのReversal(Hidden Divergence)によるサインの発信を有効にします 。ブルーの矢印が表示されます Fast EMA Pe

Using this indicator, you can see the moving average of 7 time frames in (one time frame) the same time frame you are.
You can also set orders to enter buy or sell positions automatically when the price hits Moving.
You can also set orders to risk free or close existing positions when the price hits Moving.
Also, receive a notification on your mobile phone when the price hits Moving.or position will be risk free or close .

PTW NON REPAINT TRADING SYSTEM + HISTOGRAM Non-Repainting , Non-Redrawing and Non-Lagging Trading System.
Does the following: - Gives Accurate Entry and Exit Points - Scalping, Day and Swing Trading - 95% Accuracy - Targets, where to take profits. - Shows Trends, Support and resistance levels - Works on All Brokers - Works on All Currencies, CFDs and Stocks - It does not place trades for you, it only shows you what trades to place. - It works on All Timeframes - It is for Trend or ra

POWER TO GET WEALTHY TRADING SYSTEMS.
NON REPAINT REVERSAL ARROW AND CHANNEL Intra-Day trading and Scalping Strategy: Designed for fast and accurate day trading and short-term trades.
Day and Swing Trading Strategy: Can be used as a reliable tool for day and swing traders who aim for the big moves of the price.
Multi Currencies and Markets: Works on different instruments and markets with its reliable precision.
Multi Timeframes: Can be used on multiple timeframes with good perfor
Elegant RSI indicator can generate RSI divergence with the availability of user defined filters. It can generate voice alerts for RSI oversold and RSI Overbought situations. Moreover it can also generate voice alerts for RSI Divergneces as well as when price breaks above or breaks below the support and resistances created upon divergence ouccurence. The voice alerts are generated in a way that you will know which market has reached the oversold and overbought conditions as well as the rsi Dive

Örümcek renko oku, çubuk açık/iç çubukta sinyal veren ve sinyali çizmek için 2 strateji kullanan renko tabanlı bir ok göstergesidir. Bu gösterge, bir çubuk TP'yi ölçeklendirmek için veya ayarlarında daha yüksek periyotlarla kullanılırsa ticareti değiştirmek için kullanılabilir. Bu gösterge asla yeniden boyamaz veya arka boyama yapmaz. =================================================== ======= Parametreler: Giriş Dönemi : ana sinyal dönemi Filtre Periyodu : sinyal filtre periyodu Uyarılar =====

İkili atm, 2 parçaya dayanan bir ikili opsiyon sinyalleri göstergesidir, ilki trend yönünü söyleyen ve yalnızca satın alımlarda satışları belirleyen renkli bir çizgi şeklindedir, ikincisi BAR AÇIK üzerine gelen ve asla yeniden boyanmayan ve gecikmeyen bir nokta şeklinde bir giriş sinyalidir.
NASIL KULLANILIR :
Çubuğun açılışında bir satış noktasının görünmesini bekleyin Önceki çubuğun bir satış çizgisi rengi varsa, bir satış açmaktan ziyade, vade tarihiniz aynı mum kapanışıdır
Çubuğun açı
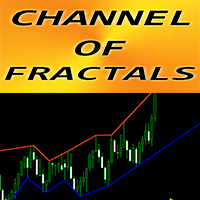
Forex Indicator "CHANNEL of FRACTALS" for MT4 This indicator is showing actual local Trend lines based on Highs/Lows of Fractals Great for traders who use Graphical Analysis Resistance local trend lines - Red color Support l ocal trend lines - Blue color It has few parameters responsible for number of fractals, trend line colors and width // More great Expert Advisors and Indicators are available here: https://www.mql5.com/en/users/def1380/seller // Also you are welcome to join to pro

Advantages of the Tick Volume Indicator: Identifying Market Sentiment : A predominance of green bars on the histogram may indicate an uptrend or strong buying pressure, useful for determining entry points for long positions. A predominance of red bars indicates a downtrend or strong selling pressure, useful for determining entry points for short positions. Analyzing Market Activity : The indicator helps identify periods of high activity, when significant changes are occurring in the market, and

Forex Indicator " Hanging Man pattern" for MT4 Indicator " Hanging Man pattern " is very powerful indicator for Price Action trading: No repaint, No delays; Indicator detects bearish Hanging Man patterns on chart: Red arrow signal on chart (see pictures) PC, Mobile & Email alerts are included Indicator "Hanging Man pattern" is excellent to combine with Support/Resistance Levels : https://www.mql5.com/en/market/product/100903 // More great Expert Advisors and Indicators are available he
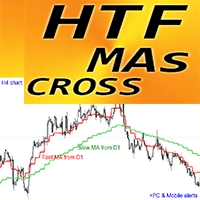
Forex Indicator "HTF Moving Averages Cross" for MT4 Upgrade your trading methods with the powerful HTF Moving Averages Cross indicator for MT4. H TF means - H igher Time Frame This indicator is excellent for Trend Traders with Price Action entries. It allows you to attach Fast and Slow Moving Averages from Higher time frame to your current chart --> this is professional method. HTF MAs CROSS has built-in Mobile and PC alerts
This indicator gives opportunity to get decent pro
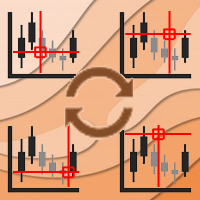
Async Charts is an indicator to synchronize charts and display a customized crosshair (cursor) on all selected charts. This is a useful utility for traders using multiple timeframes of analyzing multiple symbols for trade entry or exit.
Main Features : Real time Crosshair Synchronization on All Selected Charts
Supports Multiple Timeframes and Multiple Symbols at the same time
Auto Scroll Option
Graphical Adjustment of Color, Font, Size, ...
Locking All or Locking Specific Charts
More and

Trading Dashboard is a useful tool for your multiple trades. It contain information such as : - Breakeven point(price) of your multiple trades, - Loss point(price) of your trades, - Current Trading Day and Session, - Current Time and time left of candles, - Total Lot Buy & Sell, and sum of it - Spread and ATR of current time frame and symbol - Profit-Loss in percentage of your open trade

The RPO (Relative Price Oscillator) is a technical analysis indicator used in Forex trading to measure the momentum and trend strength of a currency pair. It is derived from the Relative Strength Index (RSI) but focuses on the difference between two moving averages of price, usually the closing price, over different periods. The RPO is similar to the MACD (Moving Average Convergence Divergence) but uses relative price levels instead of absolute price levels. Key Components: Short-Term Moving Ave
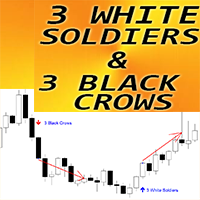
Forex Indicator " 3 White Soldiers & 3 Black Crows patterns" for MT4 Indicator "3 White Soldiers & 3 Black Crows" is very powerful for Price Action trading: No repaint, No delays; Indicator detects 3 White Soldiers and 3 Black Crows patterns on chart: Bullish 3 White Soldiers pattern - Blue arrow signal on chart (see pictures) Bearish 3 Black Crows pattern - Red arrow signal on chart (see pictures) P C, Mobile & Email alerts are included Indicator " 3 White Soldiers & 3 Black Crow

Piyasa önemli bir tepe veya dip yaptıktan sonra bir düzeltmeye girer ve adil değerini bulur.
Gösterge otomatik olarak hesaplanır:
Adil değer seviyesi Düzeltme kanalı Adil değerden düzeltme kanalı sınırlarına pip cinsinden mesafe İlk adil değer seviyesi mumundan başlayan ve zaman içinde genişleyen sinüs dalgası, bir kırılmadan önce beklenen maksimum ayar genişleme seviyelerini gösterir. Sinüs dalgasının kırılmasını yönlü bir hareket izler. Eğer bir kırılma olmazsa, bu destek/direnç olarak gö

Description of Fibonacci Levels for Support and Resistance (SNR) with a Statistical Model Fibonacci levels are widely used in technical analysis to identify potential support and resistance levels in financial markets. These levels are derived from the Fibonacci sequence, a mathematical sequence where each number is the sum of the two preceding ones. The key Fibonacci retracement levels are 23.6%, 38.2%, 50%, 61.8%, and 100%.

YK-Fibo Pivot Indicator: Trade Smarter with Fibonacci Pivot Points The YK-Fibo Pivot Indicator is a powerful technical analysis tool that combines the precision of Fibonacci retracements with the insights of Pivot Points. Whether you're a novice or seasoned trader, this indicator empowers you to spot profitable opportunities in the market with ease. Why Choose YK-Fibo Pivot? Pinpoint Support & Resistance: By calculating Fibonacci levels based on the previous day's high, low, and close prices, y
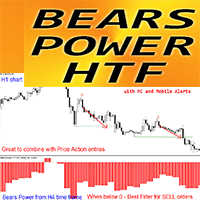
Forex Indicator Bears Power HTF for MT4 Bears Power HTF oscillator is perfect filter for "sell" entries . H TF means - H igher Time Frame Bulls and Bears Power indicators are used in trading to measure the strength of corresponding trends in trading Bears Power measures the strength of sellers' position Bears Power HTF indicator is excellent for Multi-Time Frame trading systems with Price Action entries or in combination with other indicators. This Indicator allows you to
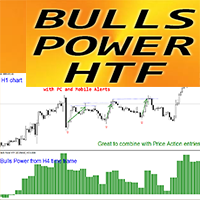
Forex Indicator Bulls Power HTF for MT4 Bulls Power HTF oscillator is perfect filter for "buy" entries . H TF means - H igher Time Frame Bulls and Bears Power indicators are used in trading to measure the strength of corresponding trends in trading Bulls Power measures the strength of buyers' position.
Bulls Power HTF indicator is excellent for Multi-Time Frame trading systems with Price Action entries or in combination with other indicators. This Indicator allows you to
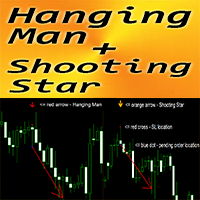
Forex Indicator " Hanging Man and Shooting Star pattern" for MT4 Indicator " Hanging Man and Shooting Star pattern " is very powerful indicator for Price Action trading: No repaint, No delays; Indicator detects bearish Hanging Man and Shooting Star patterns on chart: Bearish Hanging Man - Red arrow signal on chart (see pictures) Bearish Shooting Star - Orange arrow signal on chart (see pictures) P C, Mobile & Email alerts are included Indicator " Hanging Man and Shooting Star" is
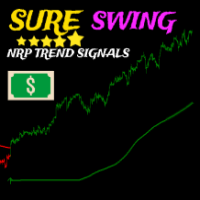
Birden fazla yerleşik göstergenin bir araya getirilmesine dayanan Sure Swing göstergesi, swing ticaret sinyalleri veren çok zamanlı çerçeve trendine dayalı bir ok göstergesidir, bu gösterge yeniden boyanmaz. Nasıl ticaret yapılır : Satın alma uyarısı içeren yeşil bir ok göründüğünde bir satın alma işlemi açın, kaybı durdurma okun altında ve kar alma minimum riskin 1 katıdır Satış uyarısı içeren kırmızı bir ok göründüğünde bir satış işlemi açın, zararı durdurma okun üzerindedir ve kar almak mini

Introducing Smart Gold Pro, a versatile trading indicator suitable for all experience levels. It provides precise buy and sell signals for the gold market, adaptable to any timeframe. Powered by advanced algorithms, Smart Gold Pro accurately analyzes price movements and volume dynamics. What sets Smart Gold Pro apart is its reliability—it doesn't repaint past signals, ensuring dependable insights into potential market reversals. Its user-friendly visual interface on the chart, along with audible
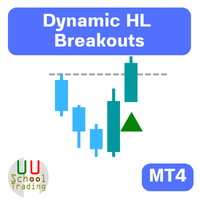
Description of Using the Dynamic HL Breakouts Indicator The Dynamic HL Breakouts indicator is a technical tool designed for trading trend-following assets. Its main purpose is to help traders identify key entry and exit points during strong trending periods of an asset. Components of the Dynamic HL Breakouts Indicator Highs and Lows This indicator calculates and displays the High and Low values for a specified period (e.g., the past 20 days) to create a price movement range for the asset. These

"Trend Finder" is a trend trading strategy that combines market noise filtration and all necessary functions in one tool! The system automatically displays entry and exit points using arrows. Only one parameter is sufficient for configuration. It offers simple, intuitively understandable, and effective trend detection. The intelligent algorithm of the "Trend Finder" indicator identifies potential market reversal points. Often, a good trend can be visually observed on the price chart. However, a

The Your Honor trend indicator is based on price divergence and is designed to analyze and determine market entry points. It can also be used as a filter in trading. The indicator has only two parameters: Period and Level. The Level parameter helps eliminate unnecessary signals. For example, for EURUSD the Level can be set, for example, to 0.0001. Your Honor can be used to both identify entry points and filter signals. The indicator displays information in a clear manner. It is important to reme

The indicator is a set of parameters for setting three moving averages (fast, medium and slow), which can be used to analyze the market.
This indicator provides the ability to analyze market trends and make trading decisions based on the intersections of various moving averages. It also supports audio alerts for timely notification of trading signals.
LengthFaster: Sets the number of candles used to calculate the faster moving average. A value of 5 means using price data from the last 5 can

Jingle is a versatile forex indicator that provides traders with various tools for market analysis. It includes different types of indicators such as MACD, RSI, DMI, and Mom, allowing traders to adapt their approach to the market according to the current situation. Indicator Parameters: Indicator : The type of indicator (MACD, RSI, DMI, Mom) that can be selected according to your preferences and trading strategy. Length : The periods of the indicator, which are determined based on the selected t

Payne Trend, ince renkli çizgiler şeklinde olası piyasa yönünü veren bir trend filtresi göstergesidir; bu gösterge, yatırımcının mevcut gerçek trende göre alım satım kararları almasına yardımcı olur; gösterge, trendin gücünü ve zayıflığını gösteren birçok seviyeye sahiptir; bu gösterge, Yeniden boyama yapmayın veya arkasını boyamayın ve sinyal gecikmez.
===================================================
Parametreler:
Dönem: trend dönemi Mod: ma'nın hesaplama modu Fiyat : kapanış/açılış/y
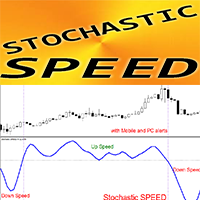
Forex Indicator "Stochastic Speed" for MT4 - great predictive tool! The calculation of this indicator is based on equations from physics . Stochastic Speed is the 1st derivative of Stochastic itself Stochastic Speed is great for scalping entries when stochastic is in Oversold/Overbought zone and Speed is making rebound hook (see pictures) It is recommended to use S tochastic Speed indicator for momentum trading strategies:
If S tochastic Speed is above 0 - this is positive sp

"Breakout Buy-Sell" göstergesi, farklı piyasa seansları (Tokyo, Londra ve New York) sırasında fiyat kırılmalarına dayalı olarak potansiyel alım ve satım fırsatlarını belirlemek ve vurgulamak için tasarlanmıştır. Bu gösterge, traderların alım ve satım bölgelerini, ayrıca kâr alma (TP) ve zarar durdurma (SL) seviyelerini net bir şekilde görselleştirmelerine yardımcı olur. Kullanım Stratejisi Gösterge şu şekilde kullanılabilir: İlk Kurulum : Piyasa seansını seçin ve GMT farkını ayarlayın. Piyasa Gö

The Tin indicator is designed to visually display the current trend in the market. One of the key aspects of foreign exchange market analysis is to determine the trend, which is the sustainable direction of price movement. To do this, the Tin indicator uses algorithms that smooth out sharp fluctuations that do not have a significant impact on the overall trend.
A trend can be either upward (bullish) or downward (bearish). Typically, a trend persists for a long time before abruptly changing di

The indicator calculates delta, the difference in tick volumes between buyers and sellers.
Displays the imbalance of market purchases and sales.
Delta imbalance is a special style of presentation based on the ratio of supply and demand volumes
Using the indicator in real trading mode, you can observe the behavior of the mood of large market participants, thereby you can visually see who currently controls the price and maintains further control.
You can also see the absence of large v
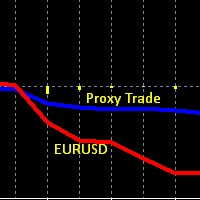
This is an obscure Hedge Fund like strategy, based one of our early indicators on EURUSD originally intended for day trading, while developing and testing the indicator we found out that the data used in this indicator (set of 4 currency pairs) follows EURUSD in a very peculiar way. On one hand these two are correlated, but the 4 currency proxy set tends to lag behind EURUSD, it lags on a day to day basis, and then catches up eventually after several days. And therefore can be used as a proxy
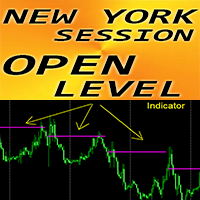
Forex Indicator "New York Session Open Level" for MT4 Indicator "New York Session Open Level" is very useful auxiliary indicator for intraday trading Session open price level is so important because very often price returns back to that area during the day. Indicator shows you NY session open price level daily for each day Also indicator shows week open level on Mondays It is useful for intraday traders to set up targets or use as support/resistance area. // More great Expert Advisors and In

* Pivot Points Magic : Effortlessly Plot Pivot Levels on Any Chart**
Pivot Points Magic simplifies the process of identifying critical pivot levels on any chart, across all timeframes. With just a few clicks, traders can instantly visualize pivot points, enabling them to make more informed trading decisions.
We value your feedback! Share your experience with Pivot Points Magic and help us improve. Your reviews and suggestions are essential for shaping future updates and enhancements to the
This indicator implements the following idea: if the current closing price (or the current average price) overcomes the smoothed value of the minimum/maximum prices for the selected period, this indicates a change in trend. The indicator effectively follows price movements in trending areas of the market and clearly demonstrates areas of sideways price movement. The product can be useful for both beginners and experienced traders as it is easy to use and intuitive. The indicator allows you to se

Why the RSI Alert Indicator is Essential for Your Trading Toolkit
In the fast-paced world of trading, timely and accurate information is crucial. The RSI Alert Indicator is a powerful tool designed to help you stay ahead of the market by providing real-time alerts when the Relative Strength Index (RSI) reaches critical levels. Whether you're a novice trader or a seasoned professional, this indicator can significantly enhance your trading strategy by pinpointing potential market reversals with

The KeyLevels Pro indicator is a powerful tool designed to identify significant support and resistance levels based on pivot highs and lows in the price action. This indicator is perfect for traders who rely on market structure and key price levels to make informed trading decisions. It features customizable parameters, automatic detection of pivot points, and visual representation of key levels with optional labels. Features Pivot Detection : Automatically detects pivot highs and lows based on

The “Sharp Scalper” indicator is high-frequency trading tool designed for quick, short term trades in the forex market. It focus on identifying rapid price movement and generating signals for best entry. This indicator is known for its ability to capture small profit opportunities multiple times throughout the day making it ideal for scalpers looking to capitalize on market volatility. The” sharp scalper” indicator employs advance algorithms to detect market trends and fluctuation, helping trade
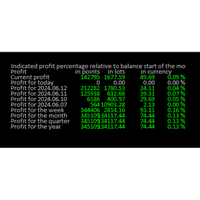
Online Diary: This indicator is designed to help traders keep track of profits and losses over various time periods, such as current profit, today’s profit, yesterday’s profit, and so on, up to the profit for the current year. The indicator offers several configuration options, such as the calculation of profit percentage relative to the balance at the beginning of the day, week, month, quarter, or year. It also allows for the customization of text placement and colors to suit the user’s needs

This is a Halftrend Scalper for MT4. Meant for Swinging markets with good volatility. Not suitable during low volatility. Features:
Wait for Price to cross Halftrend line. Select which HTF halftrend(Main Signal) Check Halftrend alignment between Higher Timeframes Check High Volume Bar (Optional) Halftrend Trends stacked (Optional) What's in the Downloads Package Extras:
- HT Scalper Scanner Dashboard (Keep in same directory as your Arrows indicator - or else won't work)
- Modified MTF Ha
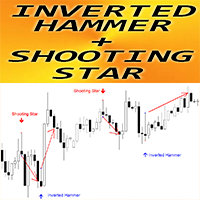
Forex Indicator " Inverted Hammer and Shooting Star pattern" for MT4 Indicator " Inverted Hammer and Shooting Star pattern " is very powerful indicator for Price Action trading: No repaint, No delays; Indicator detects bullish Inverted Hammer and bearish Shooting Star patterns on chart: Bullish Inverted Hammer - Blue arrow signal on chart (see pictures) Bearish Shooting Star - Red arrow signal on chart (see pictures) P C, Mobile & Email alerts are included Indicator " Inverted Ham

The 10PIPS Dynamite is a semi-automated cutting-edge Forex indicator designed to automatically revolutionize your trading skills from a being a losing trader to becoming a profitable trader simply by Scalping 10 pips per Trade setup generated by the software. 10PIPS Dynamite Indicator once attached on the main chart it starts an in-depth market analysis based on its unique in-built advanced algorithm which seamlessly combines powerful indicators, statistical analysis, and trend recognition

The SuperTrend MTF indicator is an excellent trend tracking indicator . It can not only display SuperTrend trends within the timeframe of the chart, but also set up to display SuperTrend trends for larger time frames simultaneously . This will be beneficial for grasping trends at a larger time scale and predicting future trends . At the same time, the price of the trend line can also be displayed at a glance, making it easy to observe. Input parameters : ATR period used at chart timeframe

The indicator is a double Rsi based oscillator with color change.
The coloring sometimes repaint one bar because of smoothing.
Check out my indicators and Expert Advisors - https://www.mql5.com/en/users/ptr777/seller
# Please note the demo doesn't perform correctly in the backtester.
The values and colors can be changed as preferred.
The fast line gives earlier signals but if you want confirmation wait for the cross or slow line to change color also.
Buy when lines is closer to
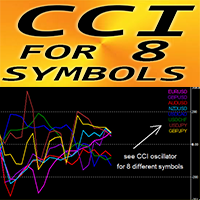
Forex Indicator "CCI for 8 Symbols" for MT4. CCI is one of the most popular oscillators for trading Commodity Channel Index (CCI) measures the difference between the current price and the historical average price. Important levels: +/-200; It is great to take Sell entries from above +200 zone and Buy entries from below -200 "CCI for 8 Symbols" gives opportunity to control CCI values of up to 8 different symbols just on 1 chart
This indicator is excellent to combine with Price Action entri

TMA Channel is a price channel obtained through a special calculation method based on traditional TMA . The channel has upper, middle, and lower tracks . When the price approaches or exceeds the upper track, it is already in an overbought state, and attention should be paid to the situation of reversal and decline; When the price approaches or falls below the lower track, it is already in an oversold state, and attention should be paid to the situation of reversal and rise . The indicator will d
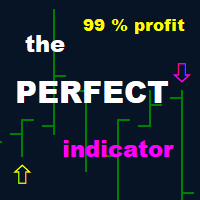
MÜKEMMEL göstergesi
Bu gösterge BRICS göstergesinden birkaç kat daha iyidir. Ve bu çok iyi.
Öncelikle daha sık sinyal verdiği için. Birkaç döviz çifti kullanılarak günde birkaç kez işlem yapılabilir.
İkincisi, işlemler genellikle daha uzundur. Hedef kar 10 pip'i aşabilir. Yine de güvenlik açısından 10 pip olmasını öneriyorum. Ama duruma göre yapılabilir.
Üçüncüsü, bu gösterge tüm çiftlerde devam eder.
Öncelikle M15'i öneririm.
Zaten dün, 14-06-2024, bu göstergeyle TP = 10 pip ile 9

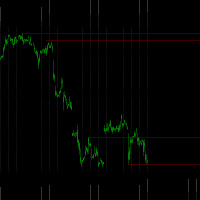

The author's indicator is based on automatically adjusted horizontal and inclined lines from significant market points. In the settings you can specify the period, color and thickness of the lines, disable or enable slanted lines and several other graphic settings.
Recommended rules for entering the market:
Using SELL as an example:
I place a pending order for a breakout - sell stop below the horizontal line of the indicator, then I monitor the work-out, stop loss and take profit are dete

This indicator has a lot of numerology analyzing methods that can support your analyzes or can work as custom strategy by it self ..we will start to explain them one by one : 1- Range channel that draws the limits of daily movements to detect places of buy and places of sell .
2- Angler will detect Dynamic numeral levels that result of time and price squaring with custom numeral method that works like support and resistant and will support your analyzes
3- Shepherd Levels it is l
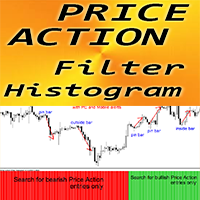
Price Action Filter Histogram - is an efficient auxiliary trading tool for Price Action trading! This indicator suggests to trader the direction of entries. Then trader just need to search for Price Action signals in that direction. Price Action Filter Histogram should be combined with Price Action patterns and support/resistance levels Green color histogram - Look for Bullish entries Red color histogram - Look for Bearish entries There are plenty of opportunities to upgrade eve
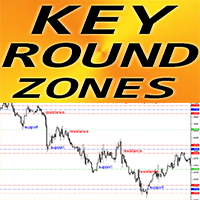
Forex Indicator "Key Round Zones" for MT4 Indicator "Key Round Zones" is must have auxiliary indicator for traders who take support/resistance into consideration 1000 and 500 round levels are respected by the price - price rebounds from them very often Major 1000 levels also have strong Support/Resistance zones (100 points in each side) around it Also 1 000 and 500 round levels are good to place Take Profits (in front of round level) and SL (behind the round level) These levels are part

The Onion Trend Indicator is a revolutionary trend trading and market data filtering solution that combines all the important features of a trend tool in one tool! It is great for any trader, be it Forex or binary options. No settings are required, everything is optimized by time and experience, it works effectively both in flat conditions and in trend conditions.
The Onion Trend Indicator is a technical analysis tool for financial markets that reflects current deviations in the price of

Histogramă PERFECTĂ Acest indicator este indicatorul săgeților PERFECT transformat într-un indicator histogramă. Faceți cumpărături la cercul albastru. Vindeți cercului roșu. Acest indicator este de câteva ori mai bun decât BRICS indicator. Și asta este foarte bine. În primul rând pentru că dă semnale mai des. Se poate tranzacționa de mai multe ori pe zi folosind mai multe valute Perechi. În al doilea rând, tranzacțiile sunt, în general, mai lungi. Profitul țintă poate depăși 10 sâmbur
The LewshaGen indicator is a technical analysis tool used in the Forex market. It helps traders make decisions when to enter or exit a trade based on analysis of market data. Let's look at how it works and why it can be useful.
How the LewshaGen indicator works: Trend Analysis: The indicator analyzes chart data and identifies key turning points and trends in the market. In the chart above, you can see how the indicator helps identify a decline of 180 points (PIP) and a subsequent rise of 330
Muon g-2
Bună ziua! Indicatorul Muon g-2 funcționează cel mai bine pe H1, M30 și H4 și pe toate perechile valutare.
Se poate tranzacționa de mai multe ori pe zi folosind mai multe perechi valutare.
Acest indicator pare să depășească indicatorul PERFECT.
Semnalele de cumpărare-vânzare sunt sub formă de săgeți.
Vă doresc succes!
IMPORTANT! Verificați mai întâi indicatorul sau expertul pe un cont DEMO, înainte de a-l cumpăra!
Analizați-l bine! Vorbeste cu vanzatorul! Închiriați-l pen

The Dreadnought indicator carefully analyzes price dynamics, identifying temporary weakening of the trend and sharp changes in its direction. By monitoring this indicator, you can easily notice changes in the market and take appropriate action. Entering the market may be easy, but maintaining a position is much more difficult. With Dreadnought, you have reliable support to successfully stay ahead of the trend. This indicator analyzes historical data and provides the trader with the necessary in

Mysterium is a channel indicator without redraws, which is based on double smoothing of moving averages. Unlike channel indicators such as Bollinger, Mysterium uses double smoothed moving averages. This allows you to more accurately determine the direction of market movement, although it reduces the sensitivity of the indicator. However, double smoothing provides a clearer and more stable display of channels on the chart, which helps traders make informed trading decisions.
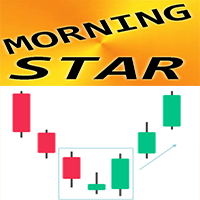
Forex Indicator " Morning Star pattern" for MT4 Indicator "Morning Star pattern" is a very powerful indicator for Price Action trading: No repaint, No delays; Indicator detects bullish Morning Star patterns on chart: Blue arrow signal on chart (see pictures) P C, Mobile & Email alerts are included Also its brother - bearish " Evening Star pattern" indicator is available (follow the links below) Indicator " Morning Star pattern" is excellent to combine with Support/Resistance Leve

Forex Indicator " Evening Star pattern" for MT4 Indicator "Evening Star pattern" is very powerful indicator for Price Action trading: No repaint, No delays; Indicator detects bearish Evening Star patterns on chart: Red arrow signal on chart (see pictures) P C, Mobile & Email alerts are included Also its brother - bullish " Morning Star pattern" indicator is available (follow the links below) Indicator " Evening Star pattern" is excellent to combine with Support/Resistan

Volatility Range is an indicator that calculates the range of volatility, predicting key levels such as potential resistance above and potential support below. The indicator can display volatility forecast ranges for the latest 50 days, 10 weeks, or 4 months. By observing these ranges, you can better identify reliable levels where combining with price action enhances trade accuracy significantly.
You have the option to fill the rectangle area with color for easier observation, or leave it unf

Price Action Scanner is an indicator that identifies price behaviors and provides alerts. This indicator can simultaneously detect signals for up to 6 different symbols across various timeframes. By setting a separator, you can add different symbol names and timeframes.
The indicator can detect multiple common signal types such as Pinbar, Engulfing Pattern, Inside Bar, Morning Star, Evening Star, Fakey, and display corresponding information in separate subcharts, indicating the direction of t

Price Action Scanner Pro is an indicator that identifies price behaviors and provides alerts, offering more features and customization compared to Price Action Scanner ( https://www.mql5.com/zh/market/product/118937?source=Site+Profile+Seller ) . This indicator can simultaneously detect signals for up to 15 symbols across different timeframes. You can configure it to detect signals during specific trading sessions such as Asian, European, and US sessions, using different timeframes. This

The Radiant Trend indicator calculates the saturation levels of the price chart. A signal to exit the oversold zone indicates a buy, and a signal to exit the overbought zone indicates a sell. For this indicator, it is usually necessary to set relative values for the overbought and oversold levels – Bottom and Top.
Often a good trend can be seen visually on the price chart. However, an experienced trader must clearly understand the current market situation before opening a position. The indi
MetaTrader Mağaza, MetaTrader platformu için uygulama satın almak adına rahat ve güvenli bir ortam sunar. Strateji Sınayıcıda test etmek için Uzman Danışmanların ve göstergelerin ücretsiz demo sürümlerini doğrudan terminalinizden indirin.
Performanslarını izlemek için uygulamaları farklı modlarda test edin ve MQL5.community ödeme sistemini kullanarak istediğiniz ürün için ödeme yapın.
Ticaret fırsatlarını kaçırıyorsunuz:
- Ücretsiz ticaret uygulamaları
- İşlem kopyalama için 8.000'den fazla sinyal
- Finansal piyasaları keşfetmek için ekonomik haberler
Kayıt
Giriş yap
Gizlilik ve Veri Koruma Politikasını ve MQL5.com Kullanım Şartlarını kabul edersiniz
Hesabınız yoksa, lütfen kaydolun
MQL5.com web sitesine giriş yapmak için çerezlerin kullanımına izin vermelisiniz.
Lütfen tarayıcınızda gerekli ayarı etkinleştirin, aksi takdirde giriş yapamazsınız.