Abderrazak Boukhal / Продавец
Опубликованные продукты

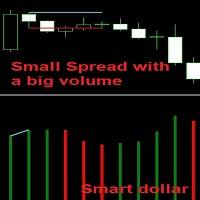
When the current candle is smaller than the previous candle but its volume is greater than the previous one, it means that the market maker is blocking the trend, means that it is in the process of (buying or selling). So when the price closes above that candle, we buy and if it closes below that candle we sell as well. Note that this candle becomes a strong zone as resistance or support. The indicator draws two lines on the divergence spread volume candle, you have to wait for the price to clo

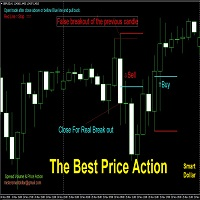
This price action is a very strong strategy, it is based on the fact that the price makes a false breakout of the previous candle and closes in the other side. which means that the area of the false breakout contains very powerful orders which push the price to turn in the other direction. the indicator helps you to choose the time frame for the price action and the minimum number of points for the area which is between the blue and red line. when the indicator gives an alert, it's time to wait

The strategy works on the ECN account (5min and more)
Inside bar : with the direction of movement average 200 (you can change 200 it if you want). when the price is on the MA the indicator only gives the buy sign, and the opposite if the price is below the MA 1 Buy: The indicator draws a blue line, when a candle closes above that line and the price reverses towards the line, Buy from that blue line. Put the stop on the red line and the take profit on the yellow line TP1, or green line TP2

The simplest and profitable strategy is to break the trend of the small time frame in the direction of the big time frame.
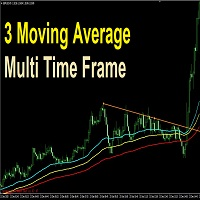
3 moving average multi time frame is for those who trade on a 5-minute frame and want to enter with the direction of the hour; Or trade on the hour and want to enter with the daily trend, or the minute with the quarter hour trend.... This indicator draw three moving averages that show the direction of the big trend and help to enter with the end of the correction ,and re