ALFRED MURIITHI / Профиль
- Информация
|
10+ лет
опыт работы
|
20
продуктов
|
270
демо-версий
|
|
0
работ
|
0
сигналов
|
0
подписчиков
|
The list will be increased in subsequent versions as per users' requests.
Any selected indicator is loaded on your chart then automatic Convergence and Divergence trend lines are drawn on the chart and indicator.
This tool is important if you use any of the listed indicators or convergence/divergence in your strategy.
Advantages
✔️With the Convergence Divergence Suite you do not need to load multiple indicators to your chart, all you need to do is select the indicator from the dropdown menu to load it.
✔️You receive screen alerts when there is convergence/ divergence.
✔️You get automatic convergence /divergence trendlines for all the listed indicators under one suite.
✔️Keep your chart clean and neat with one suite.
Settings
The setup is straight forward. All you need to do is set the values for the following indicators. You can do it at once or for the indicator you usually use:
👉Momentum
👉Chaikin Money Flow
👉Rate of Change (ROC)
👉Money Flow Index
👉Relative Strength Index
👉Stochastic Oscillator
👉Averaged RSI & MFI
👉Averaged RSI, MFI & Stochastic
👉Moving Average of Oscillator
👉Moving Average Convergence Divergence
👉William's Percentage Range
👉Commodity Channel Index
👉Force Index
👉DeMarker
👉Relative Vigor Index
👉William's Accelerator/Decelerator
👉William's Awesome Oscillator
We are ready to help you to set up if needed.
Convergence Divergence Suite:: https://www.mql5.com/en/market/product/69003
MQL5 Store:: https://www.mql5.com/en/users/pipmontra/seller

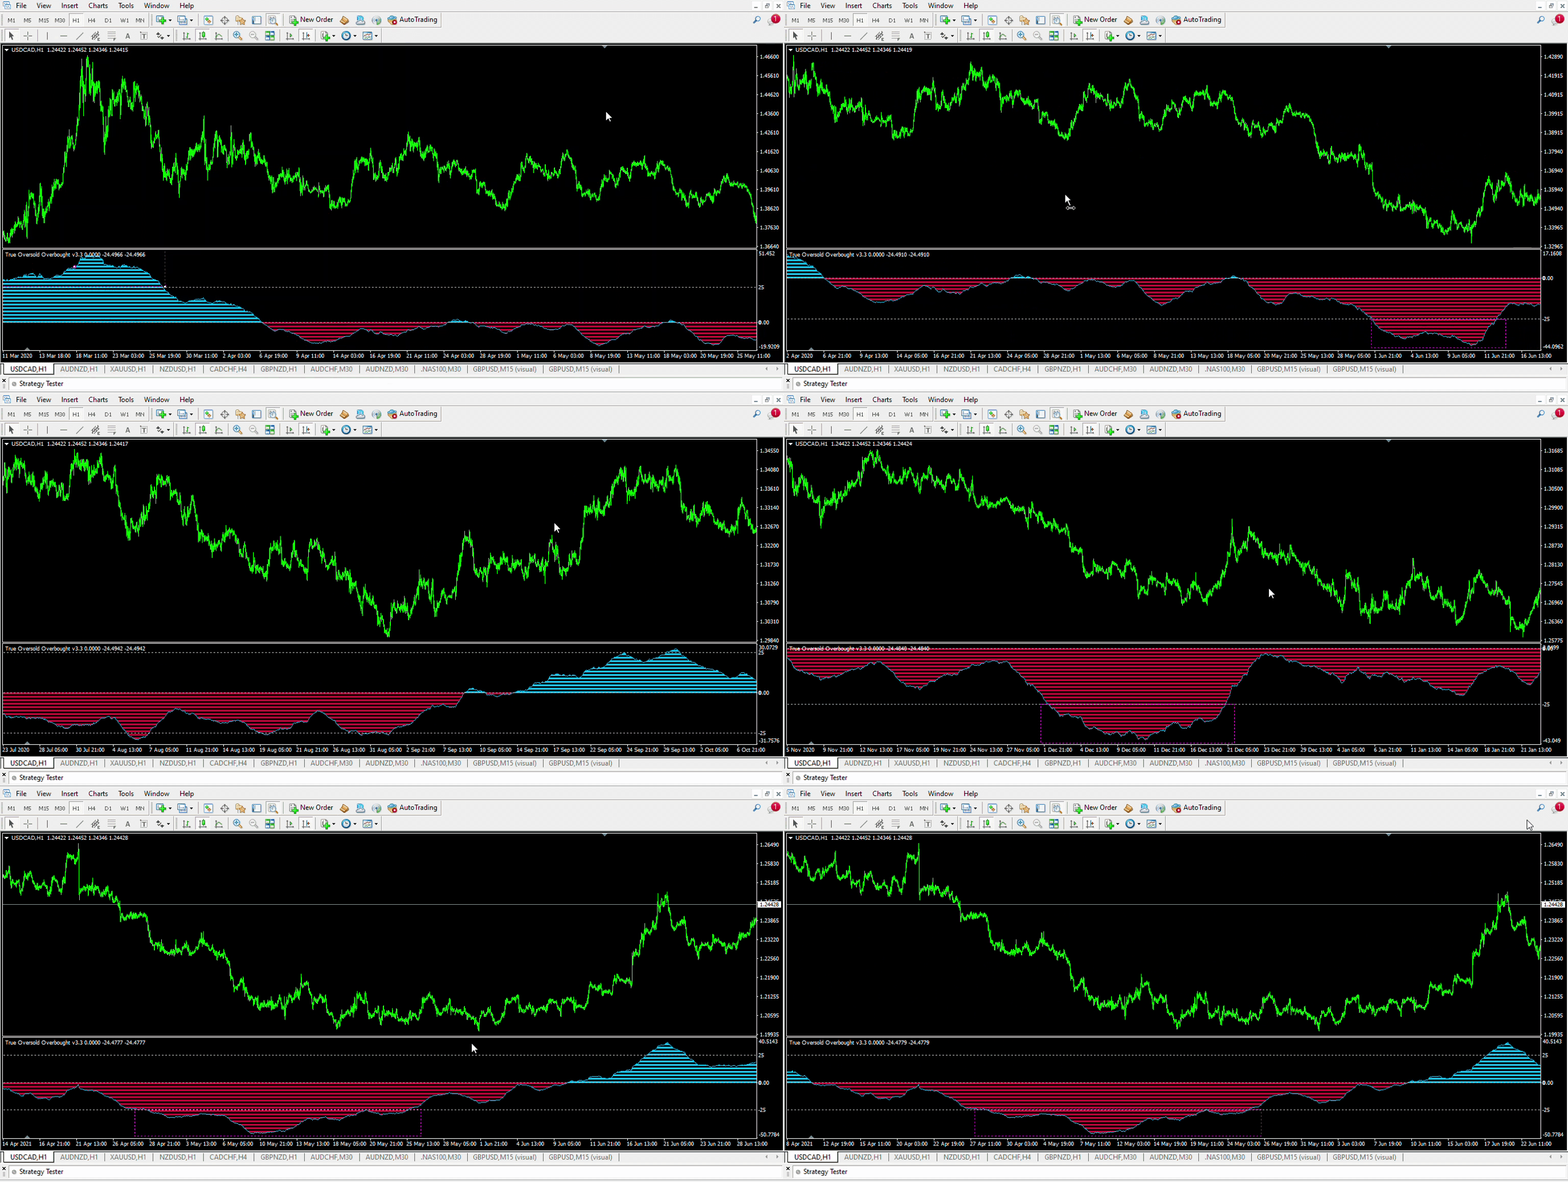
The True Oversold Overbought indicator provides you with ability to swiftly check whether the asset is oversold or overbought. Other than complementing your trading with True Oversold Overbought, you can use the indicator as your only trading system. It works with all forex instruments and will save you the headache of estimating when the market is due for a reversal or retracement. When the "Super Charge" feature is enabled, the areas where the price is in
The Chart Analyzer is an MT4 indicator that provides visual arrow signals without redrawing them. In addition, we have included trendlines to validate your entries. This indicator has been fine-tuned to work with all timeframes and instruments. The Chart Analyzer has a number of advantages Does not fade or remove arrows when drawn Sends both email and phone alerts. It is light on computer resources Easy to install. Default setting works just fine. If price opens above
Trend Guard: https://www.mql5.com/en/market/product/77841
Using the Module 4.
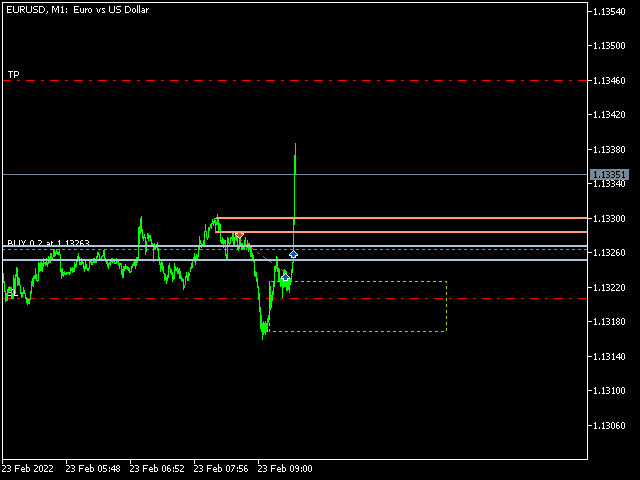
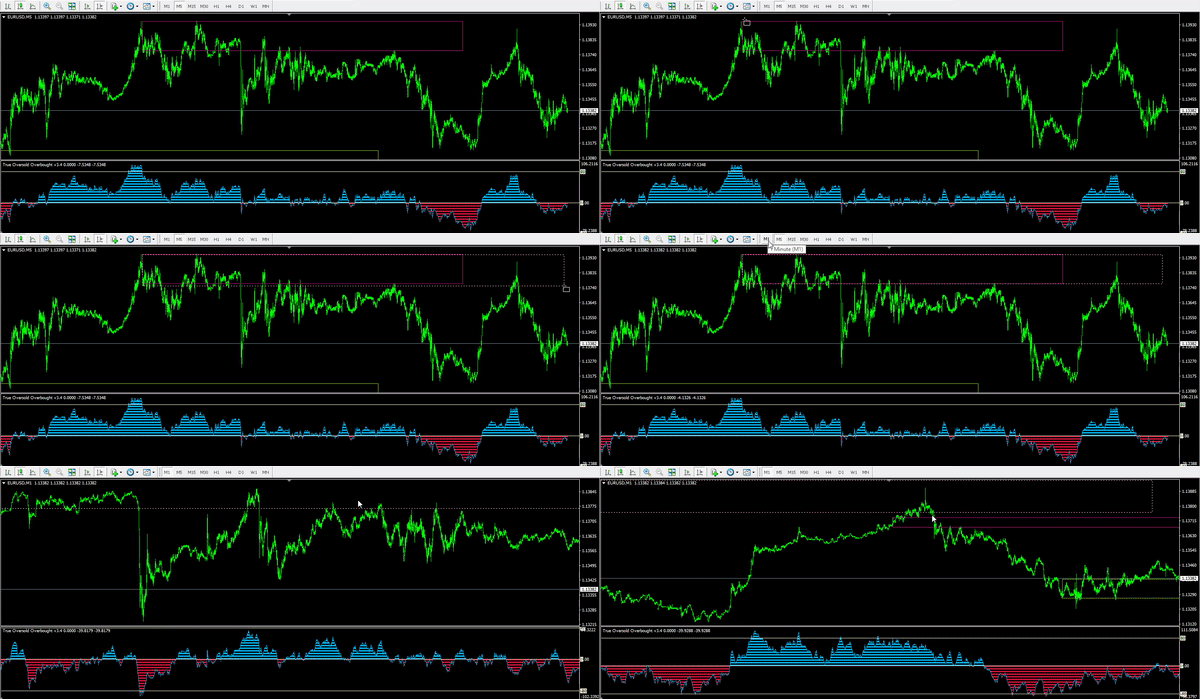
HOW TO USE ONLY TRUE OVERSOLD OVERBOUGHT INDICATOR TO TRADE.
True Oversold Overbought:: https://www.mql5.com/en/market/product/68396
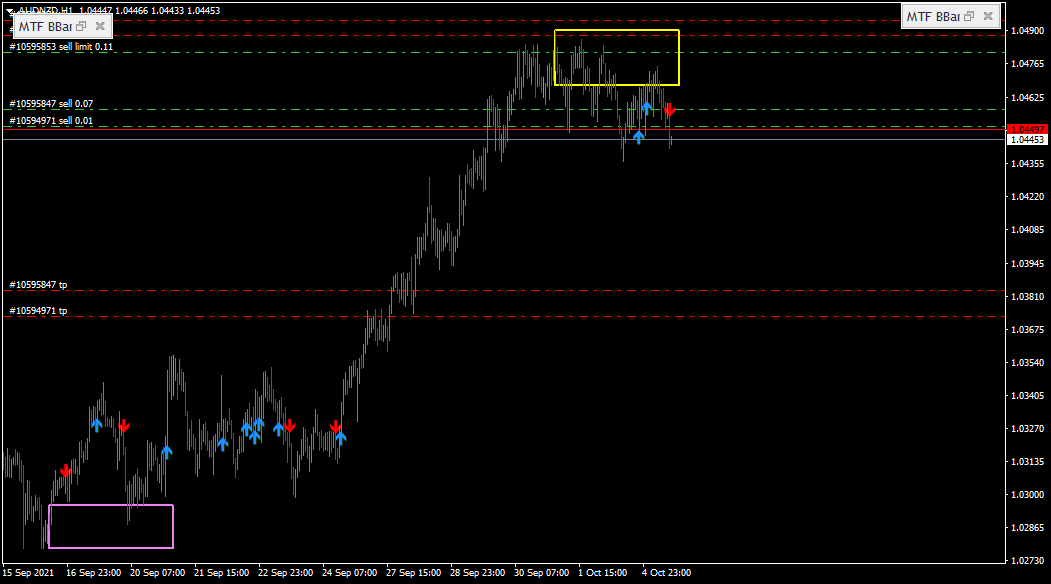
Bollinger Band is one if the most useful indicators if used properly. Trend Guard used the parameters based on Bollinger to create a tool that can help traders enter trades at most optimal level. The indicator is useful to all traders since it checks for retracements and changing trend direction. With this indicator, you get the opportunity to open trades early and also lock your profits based on the dotted trend lines that form after a certain level of Bollinger band. We have simplified the
Be profitable!
This indicator simplifies your entry zones by displaying the areas where you can plan your entry that potentially could give you high risk/reward ratios. Other than picking the most optimal entry points, the Hot Zone indicator can act as your typical support/resistance indicator for pullbacks for all timeframes. You can use this indicator as the only trading indicator or use it with another indicator for reentry purposes. Besides, when using Hot Zones, the risk/reward
True Oversold Overbought: https://www.mql5.com/en/market/product/68396
Retracement Feeder: https://www.mql5.com/en/market/product/67443
Retracement Feeder MT5: https://www.mql5.com/en/market/product/71340
👉Ranging Market Detector >> https://www.mql5.com/en/market/product/66062
🏛 ALL EA https://www.mql5.com/en/users/pipmontra/seller

👍🏻Retracement Feeder (MT4) : https://www.mql5.com/en/market/product/67443
👍🏻Retracement Feeder (MT5) : https://www.mql5.com/en/market/product/71340
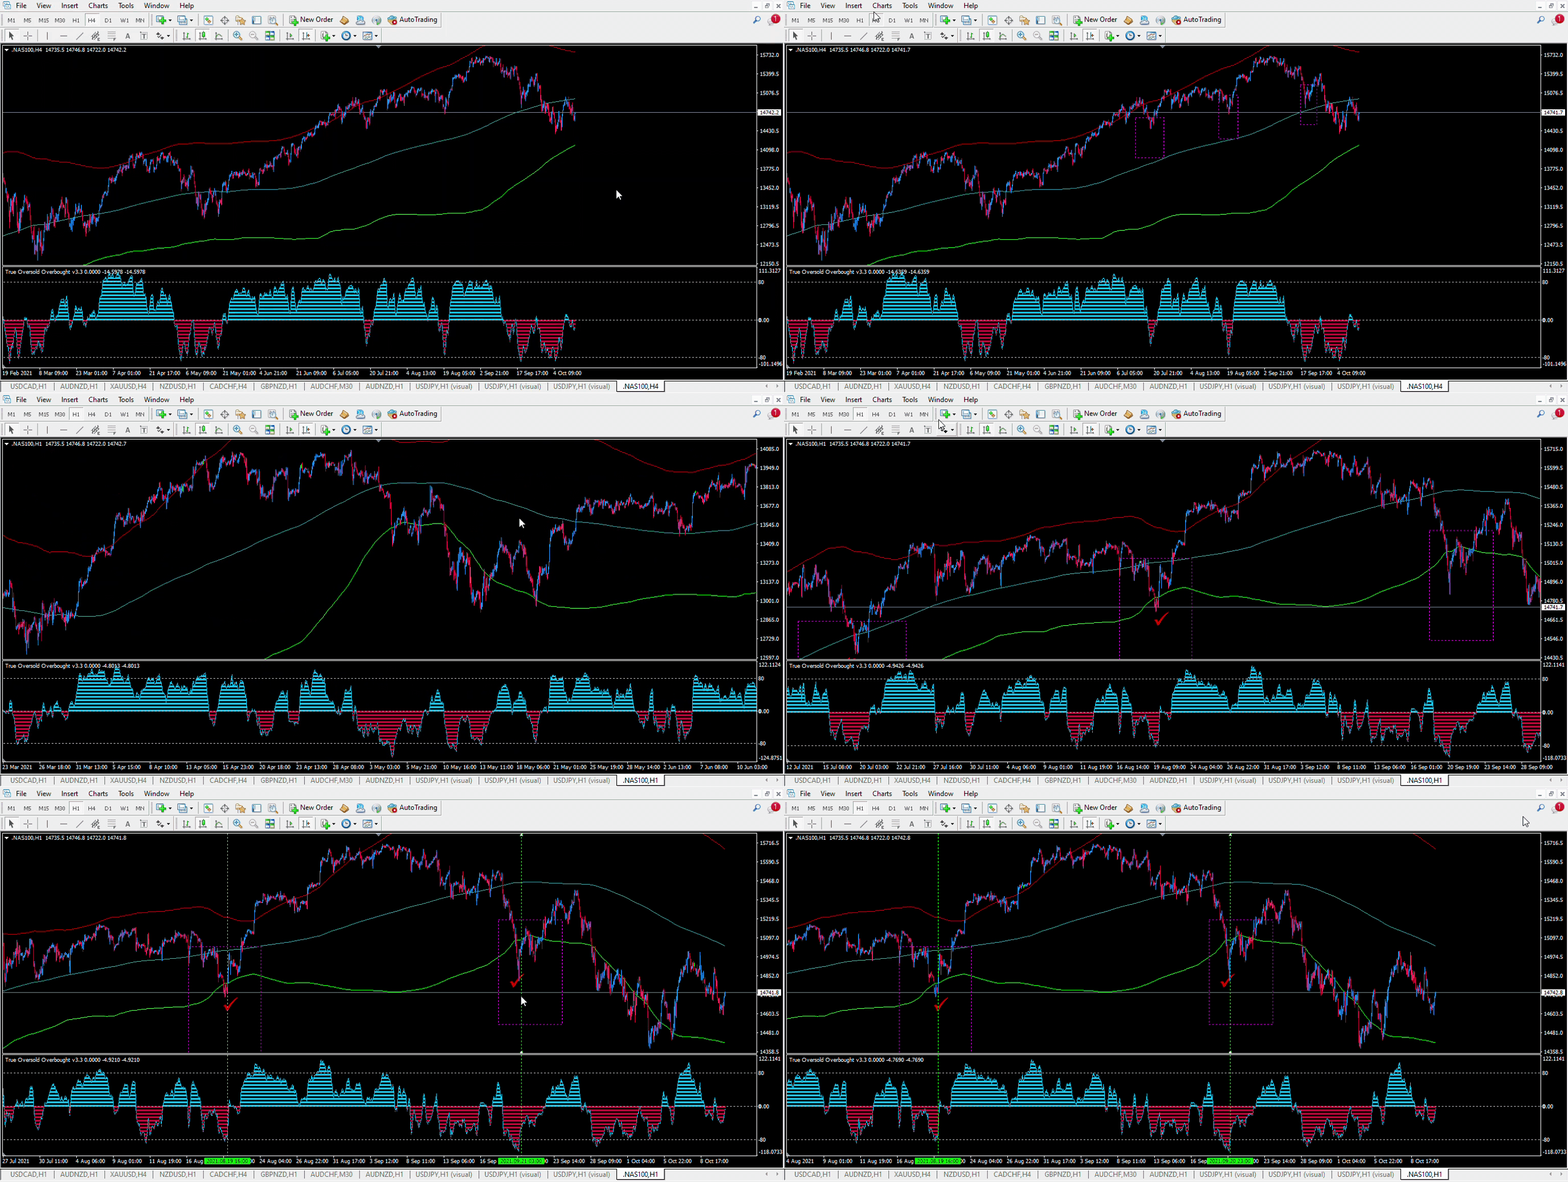
Indicators to use:
Bollinger Band (Period:500, Shift: 0, Deviations:2)
True Oversold Overbought (mt4) https://www.mql5.com/en/market/product/68396
Timeframe to trade: 1H Chart
Buy Rule: –
✅Make sure the price on 4H chart is above the main band (middle line)
✅On 1H chart, the price MUST be below the lower band.
✅Execute buy when the True Oversold Overbought mt4 indicator crosses -5000 from below. This way, you buy only when the price exits oversold state.
Sell Rule: –
👉Make sure the price on 4H chart is below the main band (middle line)
👉Confirm that on 1H chart, the price is above the upper band.
👉Sell when the True Oversold Overbought mt4 indicator crosses 5000 from above. In this case, the trader takes advantage of selling as price retreats from overbought.
👍🏻Retracement Feeder (MT4) : https://www.mql5.com/en/market/product/67443
👍🏻Retracement Feeder (MT5) : https://www.mql5.com/en/market/product/71340


