Nesimeye Oswald / Профиль
- Информация
|
10+ лет
опыт работы
|
29
продуктов
|
628
демо-версий
|
|
74
работ
|
0
сигналов
|
0
подписчиков
|
WOLFE WAVE PATTERNs First discovered by Bille Wolfe . The wolfe wave is a 5 wave price action pattern that is formed by supply and demand in a market and the fight to reach equilibrium in the market . The entry spot of the pattern is defined by the breakout of the trend created by wave 1 and wave 3 . This pattern forms in any market where there is supply and demand thus it can also be used to trade commodities and stocks. Wolfe Waves are reversal patterns that usually carry a low risk
Note : The slow loading of the indicator issue has been addressed . This new version loads fast and does not slow the platform. Version 1.3 : We have updated the indicator to include an historical bar scanning option . So instead of scanning all bars in the history (which can make the indicator slow sometimes ) , you can select the maximum number of bars it can scan which can increase the performance and make the indicator faster. This indicator scans the 1-3 Trendline pattern . The indicator
YOU CAN NOW DOWNLOAD FREE VERSIONS OF OUR PAID INDICATORS . IT'S OUR WAY OF GIVING BACK TO THE COMMUNITY ! >>> GO HERE TO DOWNLOAD Most of the time, market reversals / pull backs usually follow volume and price spikes thus these spikes could be the first indication of an exhaustion and possible reversal/pullback. High volume Turns is an indicator that scans the market for price and volume spikes around over-bought/over-sold market conditions. These spikes when spotted


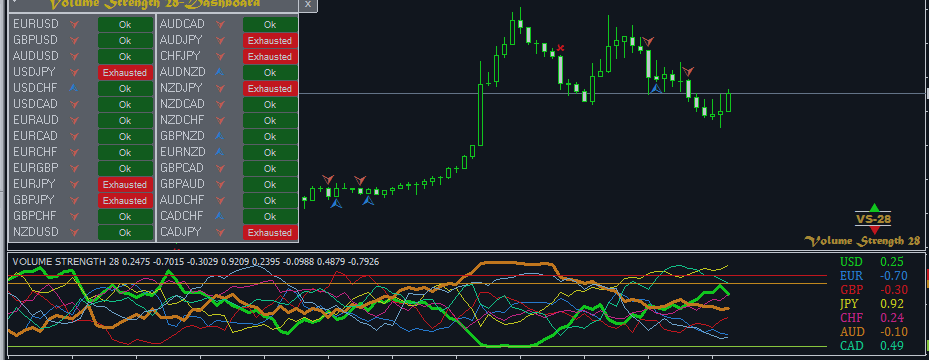
Version 1.6 ! Volume Strength 28 is better , easier to use and more awesome ! Based on complaint we got from the reviews, we understood many don't know how to really use the time frame setting on the input menu thus they have complaints of volatility, thus we have designed an Automatic Time Frame selection system that is suitable for novice traders.! The design of the indicator has been changed along with some calculation metrics. Based on complaints of high volatility we have been getting
TRADE RULES
BUY Entry: Enter Buy signal on Buy arrow and Currency strength> 3.0 and RSI (14) <65 or ADX (14) <30
Buy Exit: Use stop loss = 2 * ATR, Take Profit = 2 * ATR, Move Take Profit to nearest support , Partial Close = 1 ATR (Move Stop Loss To 1 ATR on partial Close), Exit profitable trade if RSI (2) <40 or Currency Strength <1.5
Sell Entry: Enter Sell signal on Sell Arrow and Currency strength 35 or ADX (14) 60 or Currency Strength>-1.5
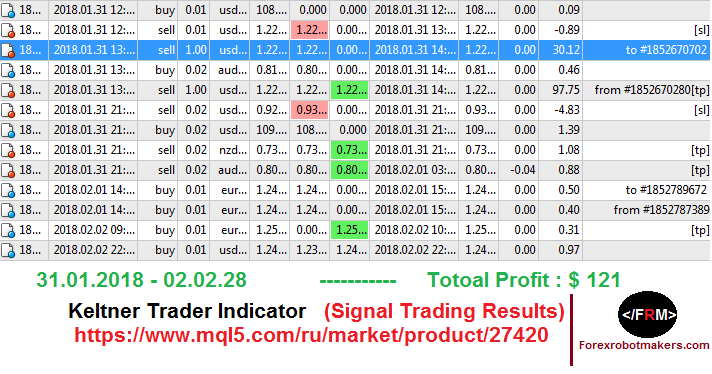
https://www.mql5.com/ru/market/product/27420

https://www.mql5.com/en/market/product/26112

Индикатор Camarilla Pivots Historical строит на графике исторические данные по уровням пивотов Камарилья. Уровни пивотов Камарилья были разработаны в 1989 году Ником Скоттом. Эти уровни используются в качестве основных уровней поддержки и сопротивления при внутридневной торговле. Уровни вычисляются по следующей формуле: R4 = C + RANGE * 1.1/2 R3 = C + RANGE * 1.1/4 R2 = C + RANGE * 1.1/6 R1 = C + RANGE * 1.1/12 PP = (HIGH + LOW + CLOSE) / 3 S1 = C - RANGE * 1.1/12 S2 = C - RANGE * 1.1/6 S3 = C -
Индикатор Volatility Ratio был разработан Джеком Сваггером для определения торговых диапазонов и поиска возможных пробоев. Коэффициент волатильности определен как истинный диапазон (True Range) текущего дня поделенный на истинный диапазон (True Range) за определенное количество дней (т.е. N периодов). Для расчета коэффициента волатильности используется следующая формула: Коэффициент волатильности (VR) = True Range за текущий день/True Range за N дней Истинный диапазон True Range рассчитывается
Pivots Dashboard – один из наиболее полных наборов инструментов для торговли по точкам разворота (пивотам, pivot points) из доступных в данный момент на рынке. Мы провели предварительное всестороннее исследование, чтобы убедиться, что продукт учитывает все особенности торговли точками разворота. Точки разворота являются важными уровнями, которые технические аналитики используют для определения направления движения, а также потенциальных уровней поддержки и сопротивления. Таким образом, точки


