Kourosh Hossein Davallou / Продавец
Опубликованные продукты
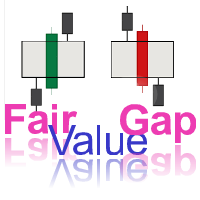
A Fair Value Gap (FVG) in Forex trading is essentially the difference between the current market price of a currency pair and what it's believed to be worth based on economic factors or reversion to the mean idea in technical analysis. Market price deviates significantly from this estimated "fair value," it can signal potential trading opportunities. Several factors can cause an FVG to appear. It often arises from market sentiment, economic news, or geopolitical events that temporarily push a cu
FREE

Harmonic Price Patterns Harmonic price patterns identify the stages of a retracement so that when the pattern is complete, you have a clear buy or sell signal. Retracements are vexing at all times, and any help is always welcome, although, with harmonic price patterns, the orthodoxy is to apply Fibonacci numbers. Again, Fibonacci numbers are not a proven theory, and in fact, there is a great deal of evidence that Fibonacci numbers appear in securities prices, including Forex, only about the numb
FREE

The 24-hour forex (FX) market offers a considerable advantage for many institutional and individual traders because it guarantees liquidity and the opportunity to trade at any conceivable time. Currencies can be traded anytime but an individual trader can only monitor a position for so long, however. Most traders can't watch the market 24/7 so they're bound to miss opportunities or worse. A jump in volatility can lead to a movement against an established position when the trader isn't around. A
FREE

Chart patterns are a common tool used by traders to identify potential trading opportunities in the financial markets. These patterns are formed by the price action of a security, and can provide valuable information about the direction in which the price is likely to move. Some of the most common chart patterns include head and shoulders, double tops and bottoms, triangles, and flags and pennants. By analyzing these patterns, traders can make informed decisions about when to enter or exit a tr
FREE

Order blocks are essential structures in trading that indicate areas where large institutional traders , like banks and hedge funds, have placed their orders. These blocks represent significant price levels where substantial buying or selling activity has occurred, providing clues about potential market movements. So, why should you, as a trader, care about order blocks? Well, knowing where these big orders are placed can give you a huge advantage. It’s like having a map showing where the treasu
FREE

Скользящая средняя RAINBOW Forex-трейдеры применяют скользящие средние по разным причинам. Кто-то использует их в качестве первичного аналитического инструмента, а кому-то они служат ориентиром для принятия инвестиционных решений. Здесь мы представим немного иные виды стратегий, а внедрение их в ваш стиль торговли зависит от вас! Техника, применяемая в техническом анализе для определения изменений трендов. Создается посредством размещения большого количества скользящих средних на одном графике.

The indicator is based on several useful indicators in the multi time frames that help us chart and table and alert.
The various parameters used in this indicator and the default ones are as follows. · Moving Average Mode: LMMA · Moving Average Period One: 4 · Moving Average Period Two: 8 · Moving Average Period Three: 15 · Moving Average Period Four: 30 · Moving Average Period Five: 80 · Mo

The indicator is based on several useful indicators in the multi time frames that help us chart and table and alert. This demo version and fix parameters. The full version can be downloaded at following address. https://www.mql5.com/en/market/product/34745 The various parameters used in this indicator and the default ones are as follows. · Moving Average Mode: LMMA · Moving Average Period One: 4 · Moving Average Period Two: 8 · Moving Average
FREE

Smart money is a powerful currency. This money is available to major investors who can identify, predict or even generate capital movements ahead of others. This money can flow into financial and capital markets and create dramatic price changes in various stocks. Therefore, detecting smart cash flow, which usually enters the market in a coherent manner and confronts the volume and value of transactions in a market with high returns, is one of the methods that some investors use to invest. But h
FREE

A stochastic oscillator is a momentum indicator comparing a particular closing price of a security to a range of its prices over a certain period of time. The sensitivity of the oscillator to market movements is reducible by adjusting that time period or by taking a moving average of the result. It is used to generate overbought and oversold trading signals, utilizing a 0-100 bounded range of values. This indicator show 8 stochastic on one chart.
FREE
Price Action переводится как «движение цены». Сторонники технического анализа считают, что цена учитывает все, что происходит на рынке. Поэтому индикаторы и советники не нужны, так как они рассчитываются на основе исторических данных о ценах и могут быть очень поздно. К моменту срабатывания сигнала индикатора направление цены, возможно, уже изменилось. Те индикаторы, которые пытаются предсказать направление цены, часто перерисовываются. Все это приводит к ненужным потерям.
С Price Action ва

Only NonFarm Payroll Trade The employment situation is a set of labor market indicators. The unemployment rate measures the number of unemployed as a percentage of the labor force. Non-farm payroll employment counts the number of paid employees working part-time or full-time in the nation's business and government establishments. The average workweek reflects the number of hours worked in the non-farm sector. Average hourly earnings reveal the basic hourly rate for major industries as indicate
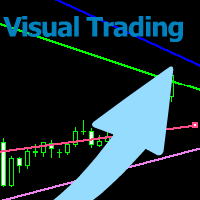
With this tool you can easily draw lines on the chart and the trade is done easily. The steps are as follows: First: Draw the buy and sell lines on the chart. Second: Draw the profit and loss lines on the chart. Third: Specify the volume of the transaction you want to trade. Fourth: Activate the lines. Warning When moving lines, be careful not to make a wrong trade.
Expert easily trades you. This is a DEMO version and can only be used on EURUSD . You can check the final version below: https://
FREE
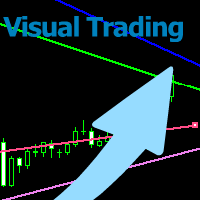
With this tool you can easily draw lines on the chart and the trade is done easily. The steps are as follows: First: Draw the buy and sell lines on the chart. Second: Draw the profit and loss lines on the chart. Third: Specify the volume of the transaction you want to trade. Fourth: Activate the lines. Warning When moving lines, be careful not to make a wrong trade.
Expert easily trades you. You can check out the ٍِDEMO version below : https://www.mql5.com/en/market/product/55493

Советник, позволяющий открывать и изменять позиции и ордера при помощи мыши (Стоп Лосс, Тейк Профит). Для работы с советником необходимо установить размер лота, тейк профит и стоп лосс для позиций. Для отложенных ордеров вам необходимо установить размер лота, тейк профит, стоп лосс и расстояние (pip). У советника есть только один входной параметр - цвет фона.

ANDREW’S PITCHFORK TRADING STRATEGY Essentially, Andrew’s Pitchfork is a tool for drawing price channels. While two lines surrounding price are usually enough to draw a channel, the Pitchfork has an extra line. It is the median line or the handle of the Pitchfork. The median line is central to this trading method. This is why Andrew’s Pitchfork is also known as the Median Line Method. TRADING RULES There are many ways to trade using Andrew’s Pitchfork but the basic idea is that pr
Multi Andrew PitchFork ANDREW’S PITCHFORK TRADING STRATEGY Essentially, Andrew’s Pitchfork is a tool for drawing price channels. While two lines surrounding price are usually enough to draw a channel, the Pitchfork has an extra line. It is the median line or the handle of the Pitchfork. The median line is central to this trading method. This is why Andrew’s Pitchfork is also known as the Median Line Method. TRADING RULES There are many ways to trade using Andrew’s Pitchfork but

Данный индикатор позволяет отображать три валютные пары в одном окне. Входные параметры: Symbol1 - первая валютная пара. symbol1mirrior - зеркальное отображение первой пары. s1color - цвет первой пары. Symbol2 - вторая валютная пара. symbol2mirrior - зеркальное отображение второй пары. Symbol3 - третья валютная пара. symbol3mirrior - зеркальное отображение третьей пары. Symbo4 - четвертая валютная пара. symbol4mirrior - зеркальное отображение четвертой пары.

The Price Channel pattern trading strategy is one of the smartest ways to make money trading. The Price Channel pattern represents two trend lines positioned above (channel resistance) and below (channel support) the price. The price action is contained between these two parallel trendlines. The separation between the two trendlines needs to be wide enough if you want to trade inside the Price Channel Pattern. If this is the case, you can buy at the channel support level and sell at the channel

The Price Channel pattern trading strategy is one of the smartest ways to make money trading. The Price Channel pattern represents two trend lines positioned above (channel resistance) and below (channel support) the price. The price action is contained between these two parallel trendlines. The separation between the two trendlines needs to be wide enough if you want to trade inside the Price Channel Pattern. If this is the case, you can buy at the channel support level and sell at the channe

Weekly Pivot There are a lot of advantages when trading with support and resistance lines, and they should be a staple in every trader's arsenal. Another effective method of deriving multiple horizontal based support and resistance lines is using a formula derived from yesterday's High, Low and Close bar. The formula maps out pivot point levels consisting of the pivot, and three levels of support and resistance, and these levels can be traded much the same way as trading with the regular suppo

This indicator is based on the Channel . Input Parameters channel_One - show trend line One on or off. timeFrame_One - time Frame of channel One . ColorChannel_One - color of trend line One. channel_Two - show trend line Two on or off. timeFrame_Two - time Frame of channel Two . ColorChannel_Two - color of trend line Two. channel_Three - show trend line Three on or off. timeFrame_Three - time Frame of channel Three . ColorChannel_Three - color of trend line three. channel_Four - show tr
FREE

A stochastic oscillator is a momentum indicator comparing a particular closing price of a security to a range of its prices over a certain period of time. The sensitivity of the oscillator to market movements is reducible by adjusting that time period or by taking a moving average of the result. It is used to generate overbought and oversold trading signals, utilizing a 0-100 bounded range of values. This indicator show 15 stochastic on one chart.
FREE

Валютный метр При торговле на Форексе мы торгуем по паре валют одновременно. Например, EUR / USD. Если мы торгуем по EUR / USD, это означает, что мы ожидаем, что EUR укрепится по отношению к USD. Если у нас короткая позиция по EUR / USD, это означает, что мы ожидаем ослабления евро по отношению к доллару США. Вы должны быть все знакомы с этой концепцией. Ключевым моментом в парах является то, что они просто указывают на силу одной валюты по отношению к другой. Если мы видим, что курс евро / долл

Our strategy relies on a choppy movement on most Forex pairs during the Asian session. Most traders in London sleep when the Sun shines over the Pacific and this results to a very slow movement of GBPUSD pair between 9:00 PM GMT and 7:00 AM GMT. Buy order: Place a buy-stop order just five pip above the upper band. Place a stop loss just one pip below the lower band. Place a profit target at the upper LawnGreen Arrow. Sell order: Place a sell-stop order just five pip below the lower band. Place

Этот индикатор работает на основе нескольких известных технических индикаторов в разных временных рамках. Работает. Эти технические показатели включают в себя: • Скользящие средние (MA) • Средний Направленный Индекс (ADX) • Параболическая остановка и разворот (SAR) • Расхождение сходимости скользящего среднего (MACD) • Индекс товарного канала (ТПП) • Осциллятор скользящей средней (OsMA) • Momentum (MOM) • Индекс относительной силы (RSI) • Процентный диапазон Уильямса (WPR) Это бесплатная версия
FREE

This Indicator works based on several well-known Technical Indicators in different time frame Works. These Technical Indicators include: Moving Averages (MA) Average Directional Index (ADX) Parabolic Stop and Reverse (SAR) Moving Average Convergence Divergence (MACD) Commodity Channel Index (CCI) Oscillator of a Moving Average (OsMA ) Momentum(MOM) Relative Strength Index (RSI) Williams' Percent Range (WPR)

Daily GBPUSD trade Our strategy relies on a choppy movement on most Forex pairs during the Asian session. Most traders in London sleep when the Sun shines over the Pacific and this results to a very slow movement of GBPUSD pair between 9:00 PM GMT and 7:00 AM GMT.
Input Parameters: Auto GMT shift extern int Broker_GMT_Shift = 0;//Manual Broker GMT shift extern int London_Night = 21; //London Night extern int London_Open = 7; //London Open

Индикатор Price Alert воспроизводит звуковой сигнал при достижении ценой определенного уровня, заданного трейдером. Если вы используете функцию уведомления по e-mail, не забудьте указать параметры вашей почты в настройках платформы MetaTrader. Входные параметры: WhenPriceGoesAbovePIP - если цена понднимется на указанное количество пипсов выше текущего уровня, сработает оповещение. WhenPriceGoesBelowPIP - если цена опустится на указанное количество пипсов ниже текущего уровня, сработает оповеще
FREE

This particular methodology. Please note the odd sequence in counting, as you will see, it is necessary for the inductive analysis. By starting with a top we are assured of beginning our count on a new wave. (The reverse would apply for a bearish wave.) The 2 point is a top. The 3 point is the bottom of the first decline. The 1 point is the bottom prior to point 2 (top), that 3 has surpassed. The 4 point is the top of the rally after point 3. The 5 point is the bottom after point 4 and is likely
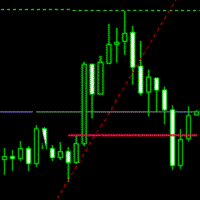
Breakout System This indicator is based on the trend line and breakthrough. Pair: EURUSD, GBPUSD. Timeframe: M15 Or H1. Input Parameters AlertsOn - alert on or off. TrendLine - show trend line. TrendLineStyle - style of trend line. UpTrendColor - color of up trend. DownTrendColor - color of down trend. ShowTakeprofit - show take profits. ShowTakeprofitStyle - style of take profit. UpperTakeprofitColor - color of up take profit. LowerTakeprofitColor - color of down take profit.