Young Ho Seo / Профиль
- Информация
|
10+ лет
опыт работы
|
62
продуктов
|
1182
демо-версий
|
|
4
работ
|
0
сигналов
|
0
подписчиков
|
https://www.mql5.com/en/market/product/4488
https://www.mql5.com/en/market/product/4475
https://algotrading-investment.com/portfolio-item/harmonic-pattern-plus/
Non Repainting and Non Lagging Harmonic Pattern Indicator – Customizable Harmonic + Japanese Candlestic Pattern Scanner + Advanced Channel + Many more
https://www.mql5.com/en/market/product/41993
https://www.mql5.com/en/market/product/41992
https://algotrading-investment.com/portfolio-item/profitable-pattern-scanner/
Supply Demand Indicator – Multiple Timeframe Scanning Added + Non Repainting + Professional Indicator
https://www.mql5.com/en/market/product/40076
https://www.mql5.com/en/market/product/40075
https://algotrading-investment.com/portfolio-item/ace-supply-demand-zone/
Momentum Indicator – Path to Volume Spread Analysis
https://www.mql5.com/en/market/product/30641
https://www.mql5.com/en/market/product/30621
https://algotrading-investment.com/portfolio-item/excessive-momentum-indicator/
Elliott Wave Indicator for the Power User
https://www.mql5.com/en/market/product/16479
https://www.mql5.com/en/market/product/16472
https://algotrading-investment.com/portfolio-item/elliott-wave-trend/
Forex Prediction - Turn Support and Resistance to the Advanced Strategy
https://www.mql5.com/en/market/product/49170
https://www.mql5.com/en/market/product/49169
https://algotrading-investment.com/portfolio-item/fractal-pattern-scanner/
MetaTrader 4 and MetaTrader 5 Product Page: https://www.mql5.com/en/users/financeengineer/seller#products
Free Forex Prediction with Fibonacci Analysis: https://algotrading-investment.com/2020/10/23/forex-prediction-with-fibonacci-analysis/
Free Harmonic Pattern Signal: https://algotrading-investment.com/2020/12/17/harmonic-pattern-signal-for-forex-market/
============================================================================================================================
Here are the trading education books. We recommend reading these books if you are a trader or investor in Forex and Stock market. In the list below, we put the easy to read book on top. Try to read the easy to read book first and try to read the harder book later to improve your trading and investment.
First Link = amazon.com, Second Link = Google Play Books, Third Link = algotrading-investment.com, Fourth Link = Google Books
Technical Analysis in Forex and Stock Market (Supply Demand Analysis and Support Resistance)
https://www.amazon.com/dp/B09L55ZK4Z
https://play.google.com/store/books/details?id=pHlMEAAAQBAJ
https://algotrading-investment.com/portfolio-item/technical-analysis-in-forex-and-stock-market/
https://books.google.co.kr/books/about?id=pHlMEAAAQBAJ
Science Of Support, Resistance, Fibonacci Analysis, Harmonic Pattern, Elliott Wave and X3 Chart Pattern (In Forex and Stock Market Trading)
https://www.amazon.com/dp/B0993WZGZD
https://play.google.com/store/books/details?id=MME3EAAAQBAJ
https://algotrading-investment.com/portfolio-item/science-of-support-resistance-fibonacci-analysis-harmonic-pattern/
https://books.google.co.kr/books/about?id=MME3EAAAQBAJ
Profitable Chart Patterns in Forex and Stock Market (Fibonacci Analysis, Harmonic Pattern, Elliott Wave, and X3 Chart Pattern)
https://www.amazon.com/dp/B0B2KZH87K
https://play.google.com/store/books/details?id=7KrQDwAAQBAJ
https://algotrading-investment.com/portfolio-item/profitable-chart-patterns-in-forex-and-stock-market/
https://books.google.com/books/about?id=7KrQDwAAQBAJ
Guide to Precision Harmonic Pattern Trading (Mastering Turning Point Strategy for Financial Trading)
https://www.amazon.com/dp/B01MRI5LY6
https://play.google.com/store/books/details?id=8SbMDwAAQBAJ
http://algotrading-investment.com/portfolio-item/guide-precision-harmonic-pattern-trading/
https://books.google.com/books/about?id=8SbMDwAAQBAJ
Scientific Guide to Price Action and Pattern Trading (Wisdom of Trend, Cycle, and Fractal Wave)
https://www.amazon.com/dp/B073T3ZMBR
https://play.google.com/store/books/details?id=5prUDwAAQBAJ
https://algotrading-investment.com/portfolio-item/scientific-guide-to-price-action-and-pattern-trading/
https://books.google.com/books/about?id=5prUDwAAQBAJ
Predicting Forex and Stock Market with Fractal Pattern: Science of Price and Time
https://www.amazon.com/dp/B086YKM8BW
https://play.google.com/store/books/details?id=VJjiDwAAQBAJ
https://algotrading-investment.com/portfolio-item/predicting-forex-and-stock-market-with-fractal-pattern/
https://books.google.com/books/about?id=VJjiDwAAQBAJ
Trading Education Book 1 in Korean (Apple, Google Play Book, Google Book, Scribd, Kobo)
https://books.apple.com/us/book/id1565534211
https://play.google.com/store/books/details?id=HTgqEAAAQBAJ
https://books.google.co.kr/books/about?id=HTgqEAAAQBAJ
https://www.scribd.com/book/505583892
https://www.kobo.com/ww/en/ebook/8J-Eg58EDzKwlpUmADdp2g
Trading Education Book 2 in Korean (Apple, Google Play Book, Google Book, Scribd, Kobo)
https://books.apple.com/us/book/id1597112108
https://play.google.com/store/books/details?id=shRQEAAAQBAJ
https://books.google.co.kr/books/about?id=shRQEAAAQBAJ
https://www.scribd.com/book/542068528
https://www.kobo.com/ww/en/ebook/X8SmJdYCtDasOfQ1LQpCtg
About Young Ho Seo
Young Ho Seo is an Engineer, Financial Trader, and Quantitative Developer, working on Trading Science and Investment Engineering since 2011. He is the creator of many technical indicators, price patterns and trading strategies used in the financial market. He is also teaching the trading practice on how to use the Supply Demand Analysis, Support, Resistance, Trend line, Fibonacci Analysis, Harmonic Pattern, Elliott Wave Theory, Chart Patterns, and Probability for Forex and Stock Market. His works include developing scientific trading principle and mathematical algorithm in the work of Benjamin Graham, Everette S. Gardner, Benoit Mandelbrot, Ralph Nelson Elliott, Harold M. Gartley, Richard Shabacker, William Delbert Gann, Richard Wyckoff and Richard Dennis. You can find his dedicated works on www.algotrading-investment.com . His life mission is to connect financial traders and scientific community for better understanding of this world and crowd behaviour in the financial market. He wrote many books and articles, which are helpful for understanding the technology and application behind technical analysis, statistics, time series forecasting, fractal science, econometrics, and artificial intelligence in the financial market.
If you are interested in our software and training, just visit our main website: www.algotrading-investment.com
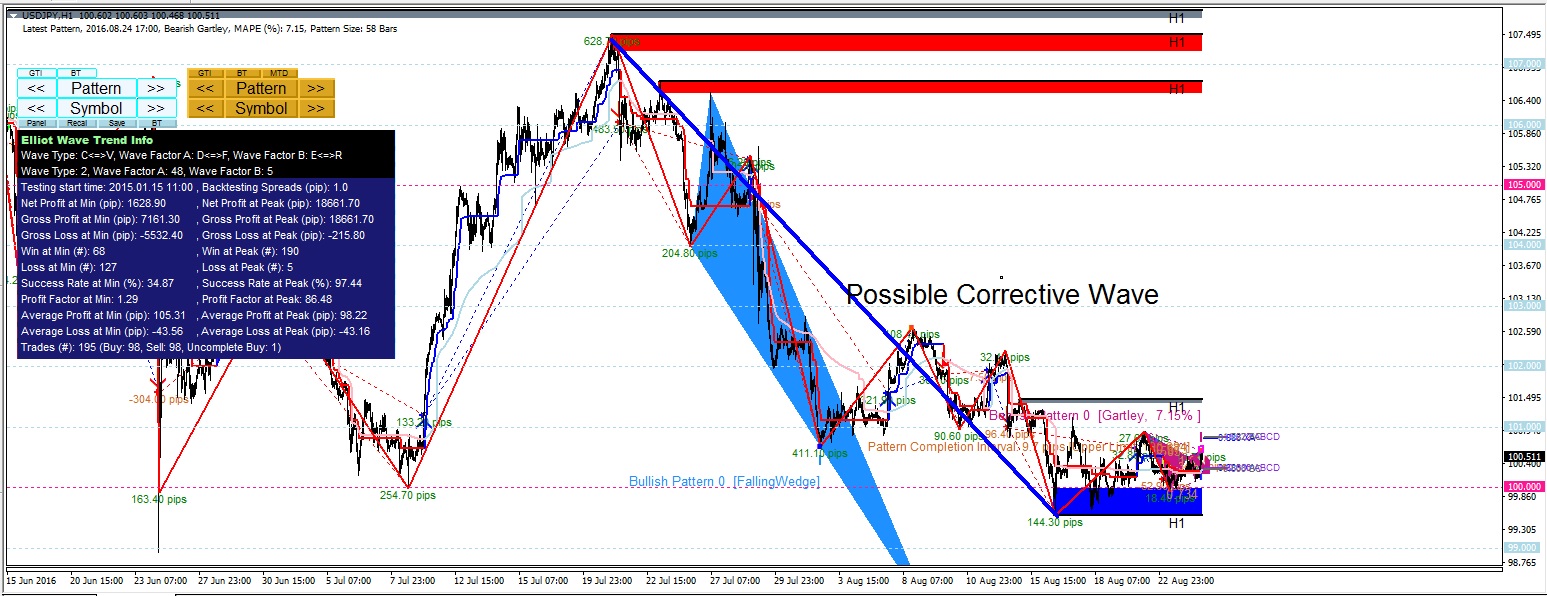
Since one of our customers asked if our Elliott Wave Trend can be used for other currency pairs. We present the market Outlook for USDJPY.
Currently Wave strucure of USDJPY is downwards but counting is rather unclear.
One of the screnario indicates the possible born of new wave 1. but let's see. This is one of the scenario only.
Note that we have used Wave Factor A and Wave Factor B greater than 10. For some curreny pairs can have quite high Wave Factor A and Wave Factor B values.
https://algotradinginvestment.wordpress.com/2016/08/24/usdjpy-outlook-2/
http://algotrading-investment.com/
Kind regards.
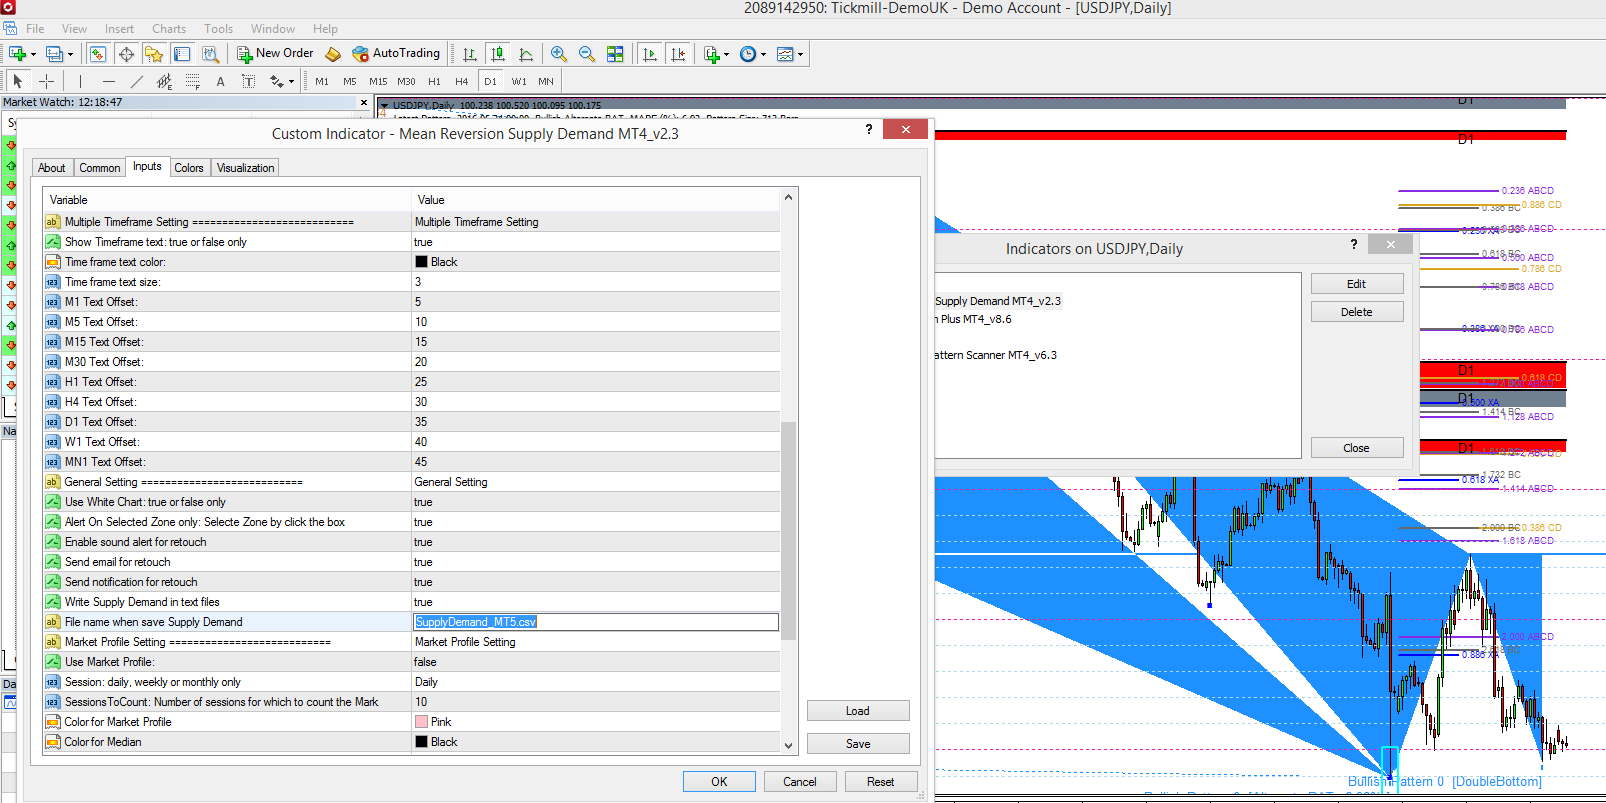
Currently we are not supporting iCustom with our Mean Reversion Supply Demand.
Even though we don't provide the direct work around with Mean Reversion Supply demand, you can still have some alternative way.
As you can see, you can geneate the supply demand csv.
This csv file contains all the supply demand levels in your chart.
We hope this is helpful for your autmation.
The file is located in your Meta Trader terminal folder.
Kind regards.
https://algotradinginvestment.wordpress.com/2016/08/24/mean-reversion-supply-demand-automation/
http://algotrading-investment.com/
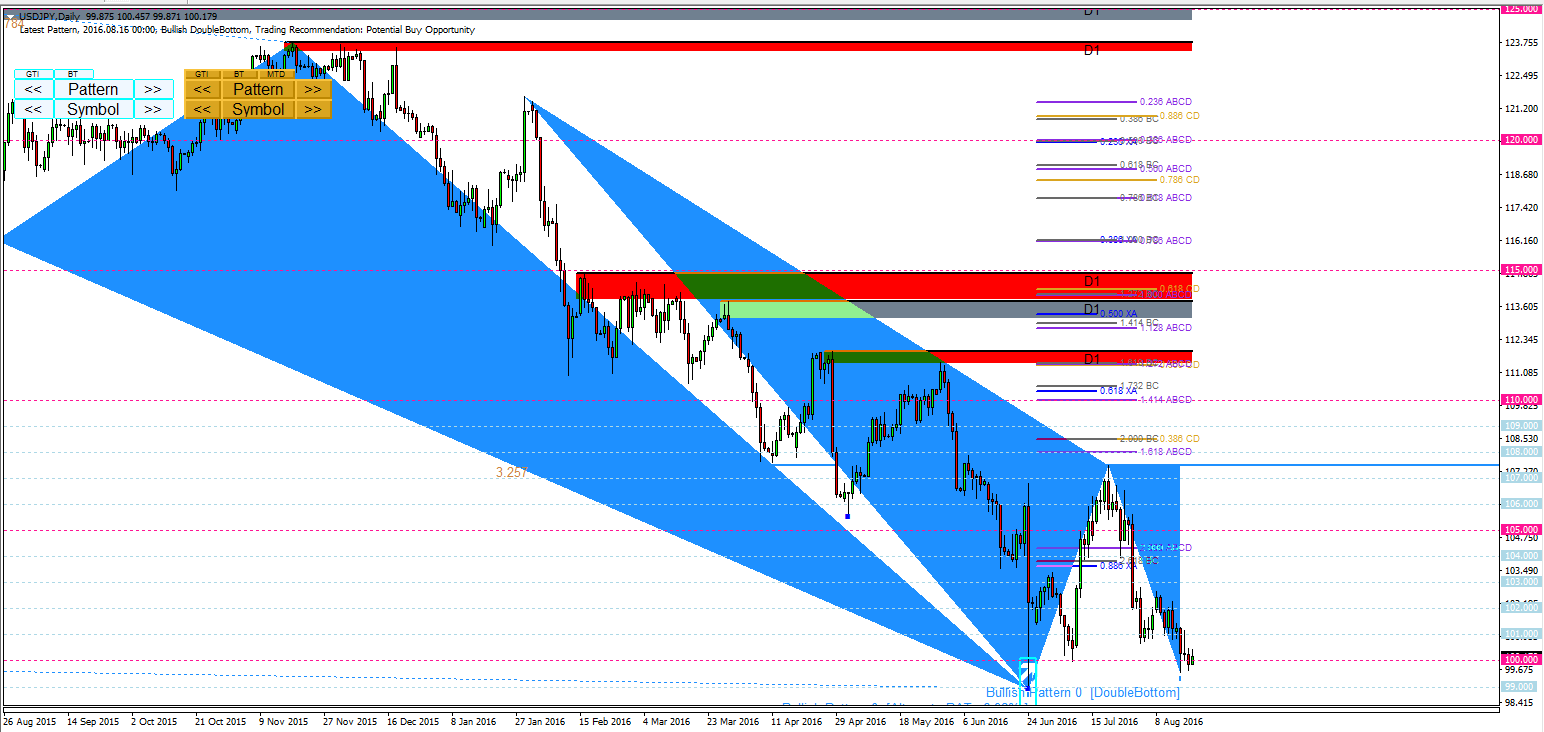
Current Snap shot of USDJPY.
Have a good weekend.
https://algotradinginvestment.wordpress.com/2016/08/20/usdjpy-outlook/
http://algotrading-investment.com/
Have a good weekend.
https://algotradinginvestment.wordpress.com/2016/08/20/gbpusd-market-outlook-2/
http://algotrading-investment.com/
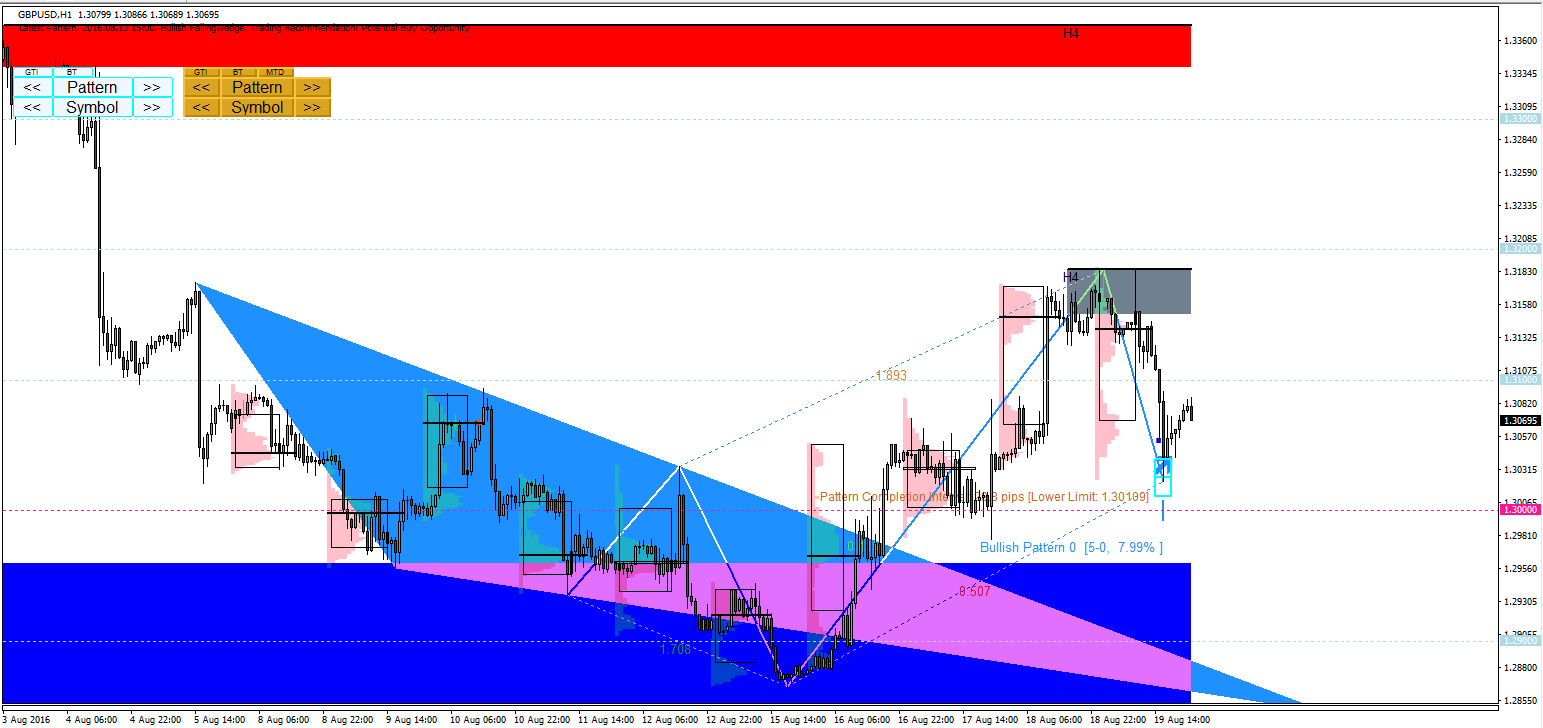
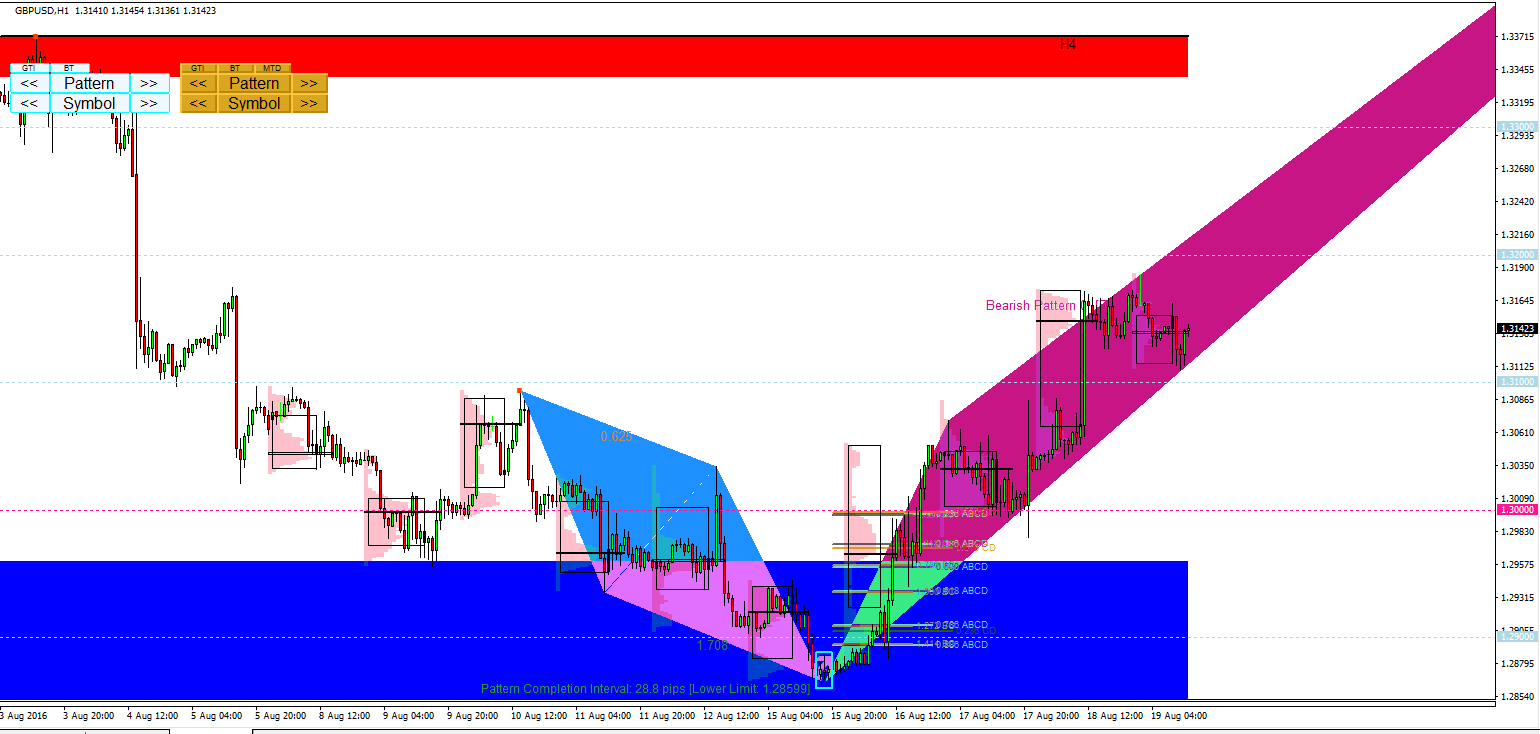
Weekend is approaching. Here is the current Snap shot of GBPUSD.
Interestingly the price are inside the confined area.
If you are going to trade this pattern, Make sure that you are locking the pattern first by simply pressing "Pattern" button.
https://algotradinginvestment.wordpress.com/2016/08/19/gbpusd-market-outlook/
http://algotrading-investment.com/
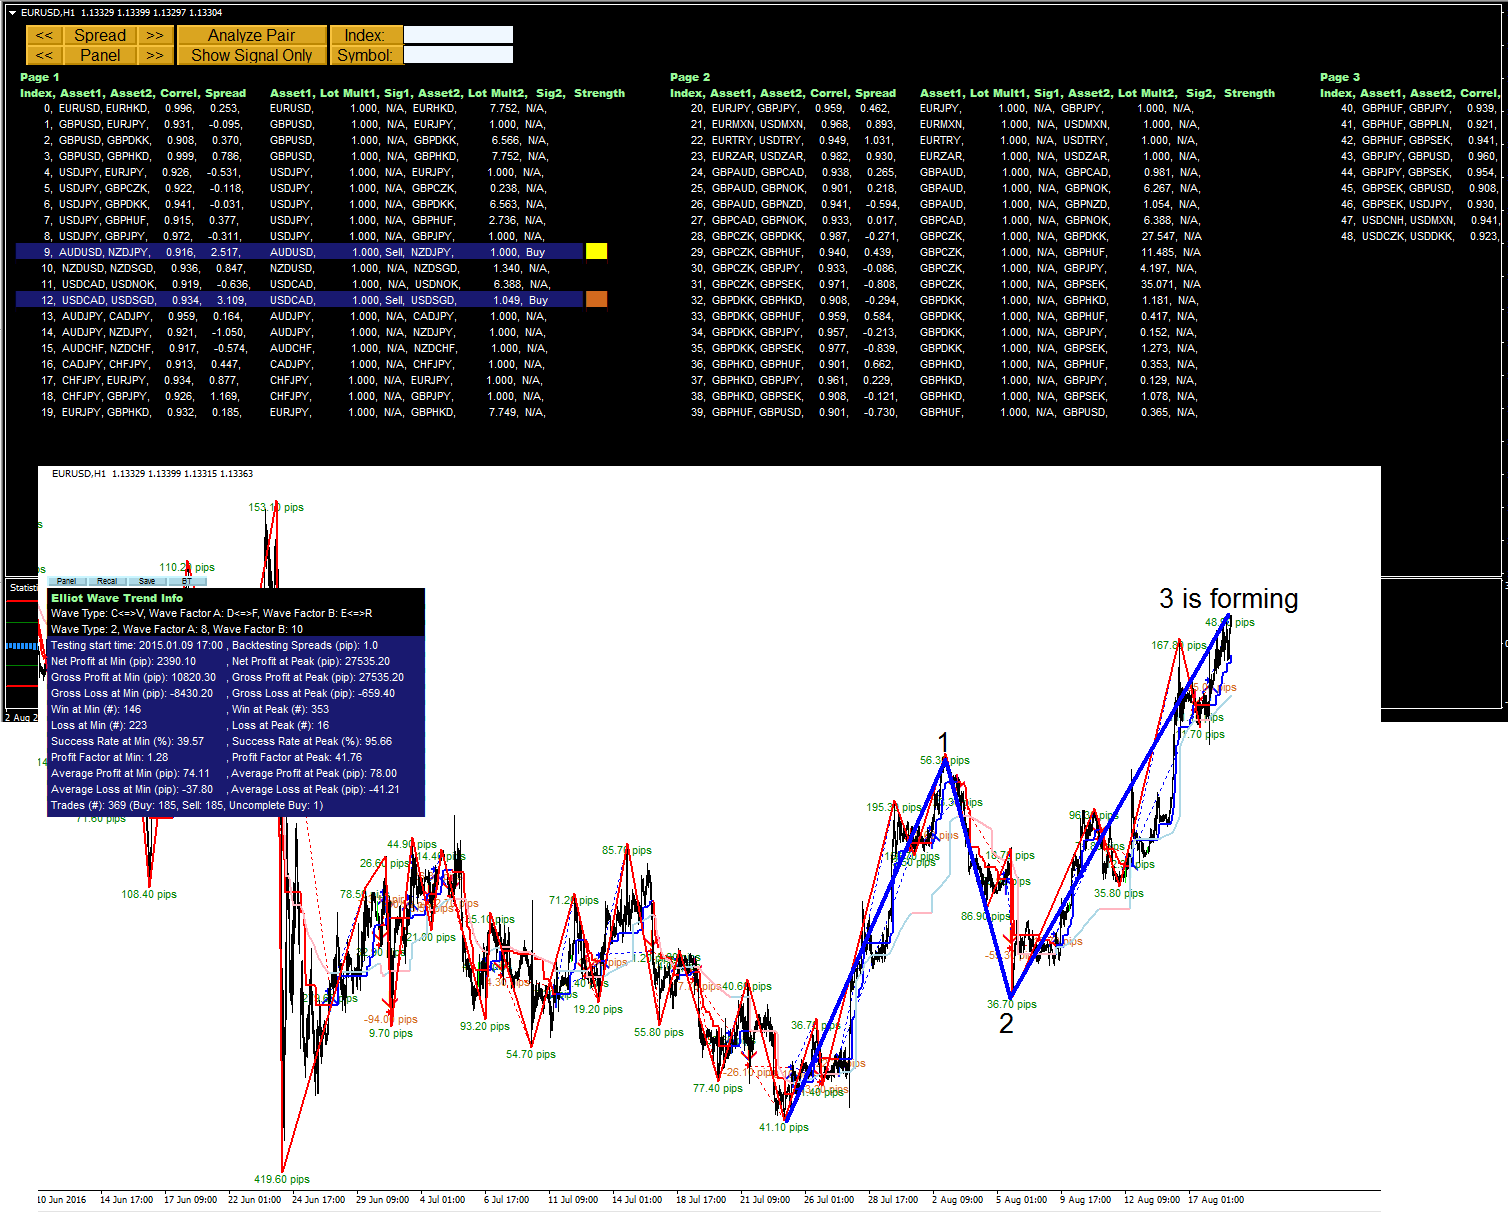
Massive bullish movement this week on EURUSD.
Our Pair Trading Station shows that all the hit from high spreads between currency pairs have been taken away from the fight between bull and bear. The high spreads in the USD pairs are all gone too.
https://algotradinginvestment.wordpress.com/2016/08/18/eurusd-outlook-6/
http://algotrading-investment.com/
•Decision Science and Risk Management
•Asset pricing (Black Sholes and Tree based model)
•Investment Model building and Portfolio Construction
•Predictive modelling (ARIMA, Decision Tree, Artificial Intelligence, etc)
•Data Mining and feature extraction
•Statistical knowledge discovery (including Econometrics)
•Price Action and Pattern Trading
•Elliott Wave trading (and its subcategories including Harmonic Pattern and Price Breakout Trading)
•Research and Developing Prop Trading Strategy
Here are the list of work currently we are planning to do on next couple of weeks.
1.Adding new powerful feature on Elliott Wave Trend
2.Adding new powerful feature on Mean Reversion Supply Demand
3.Adding new powerful feature on Price Breakout Pattern Scanner, Harmonic Pattern Plus ( they will be the same feature.)
4.New Product Launch
5.Polishing up our Algo Investment Tool and potential release.
If you need our assistant for your trading and investment, do not hesitate to visit our website
http://algotrading-investment.com/
https://algotradinginvestment.wordpress.com/2016/08/18/update-news-3/
Kind regards.
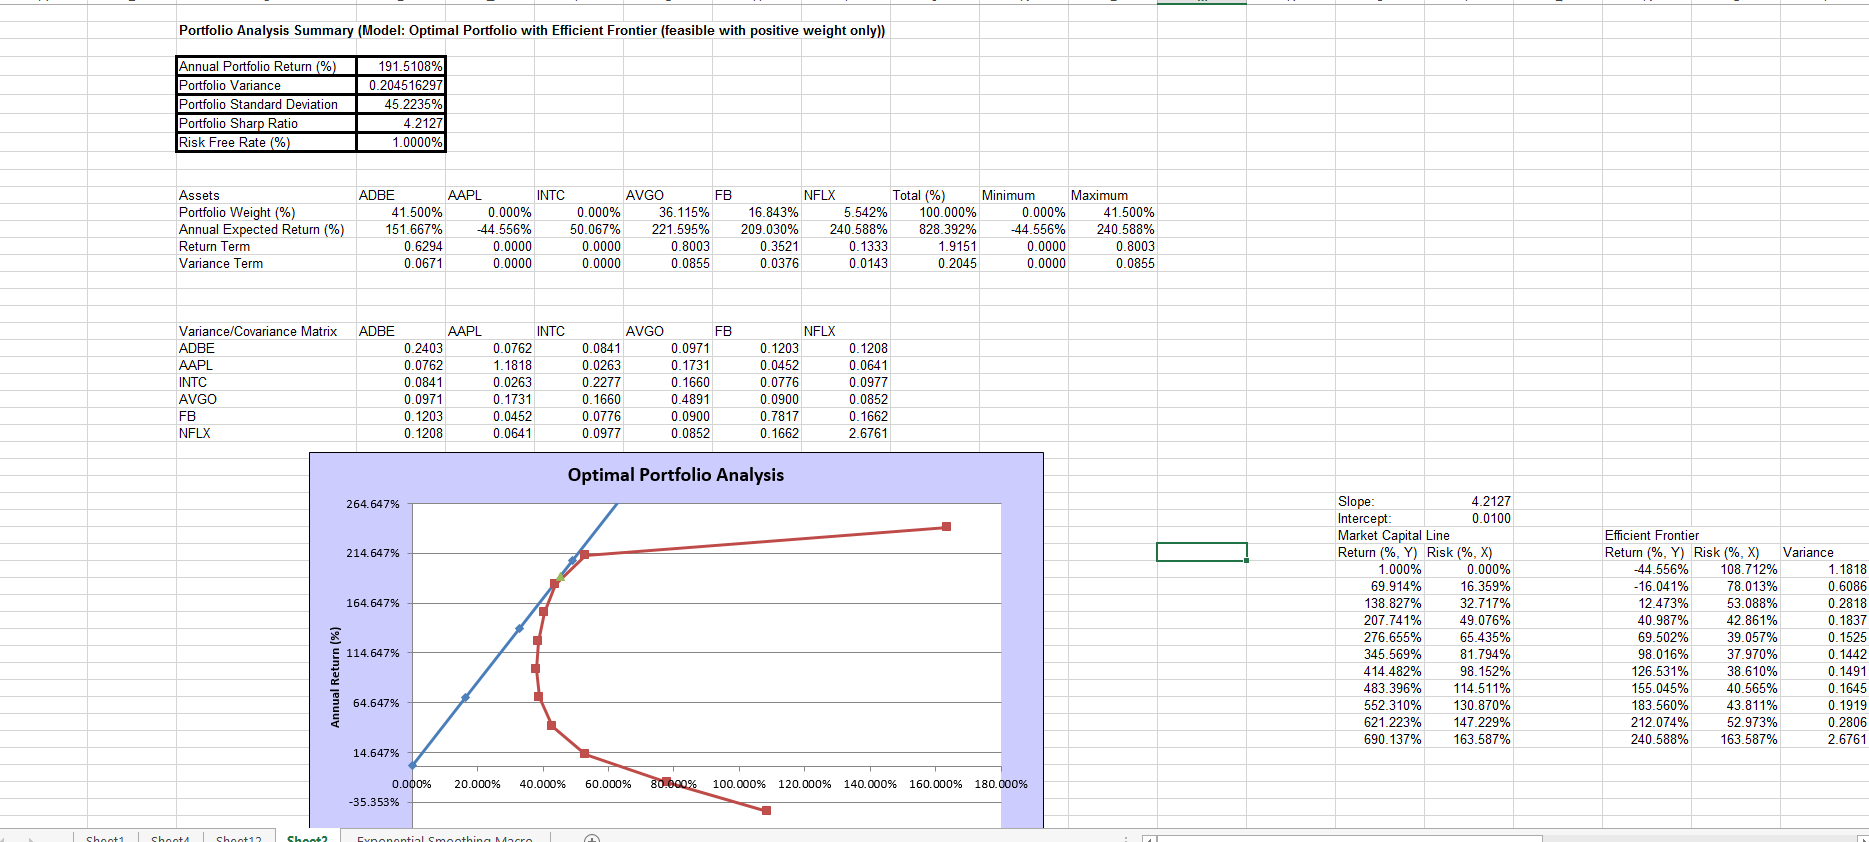
We have performed the analysis for Adobe System (ADE), Apple (APPL), Inter corporation (INTC), Avago Technologes (AVGO), Netflix (NFLX).
The results is rather interesting.
https://algotradinginvestment.wordpress.com/2016/08/17/portfolio-analysis/
http://algotrading-investment.com/
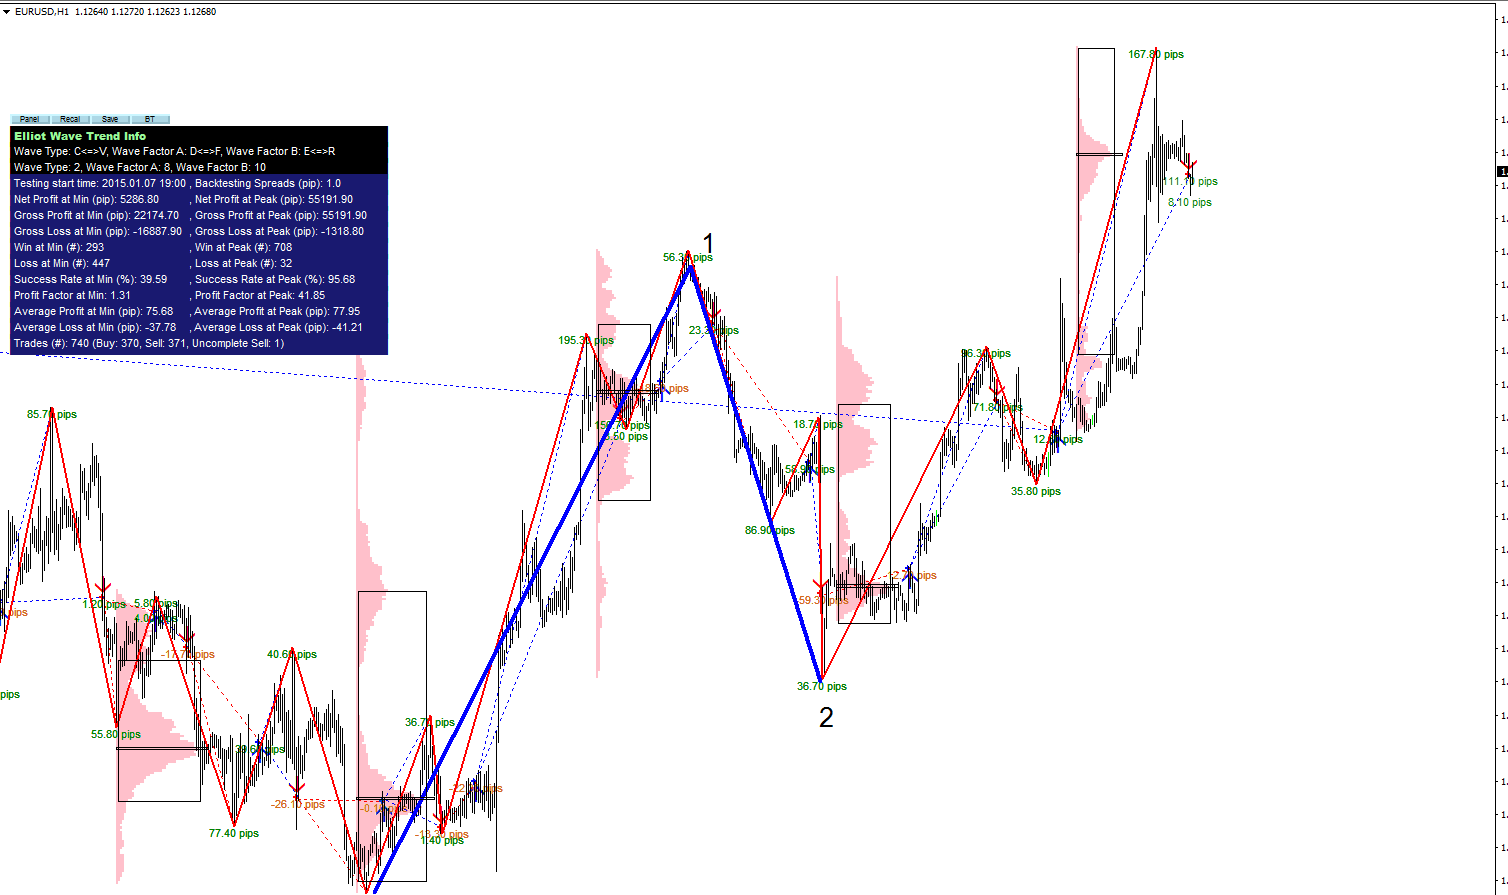
Current snapshot of EURUSD. Interesting rally have been paused.
Let's see what is happening next.
https://algotradinginvestment.wordpress.com/2016/08/17/eurusd-outlook-5/
http://algotrading-investment.com/
We are adding some powerful feature to our Elliott Wave Trend tool currently.
We alwyas thrive to improve our tools for our customers.
Please stay tuned for our further announcement.
https://algotradinginvestment.wordpress.com/2016/08/16/update-news-on-elliott-wave-trend-tool/
http://algotrading-investment.com/
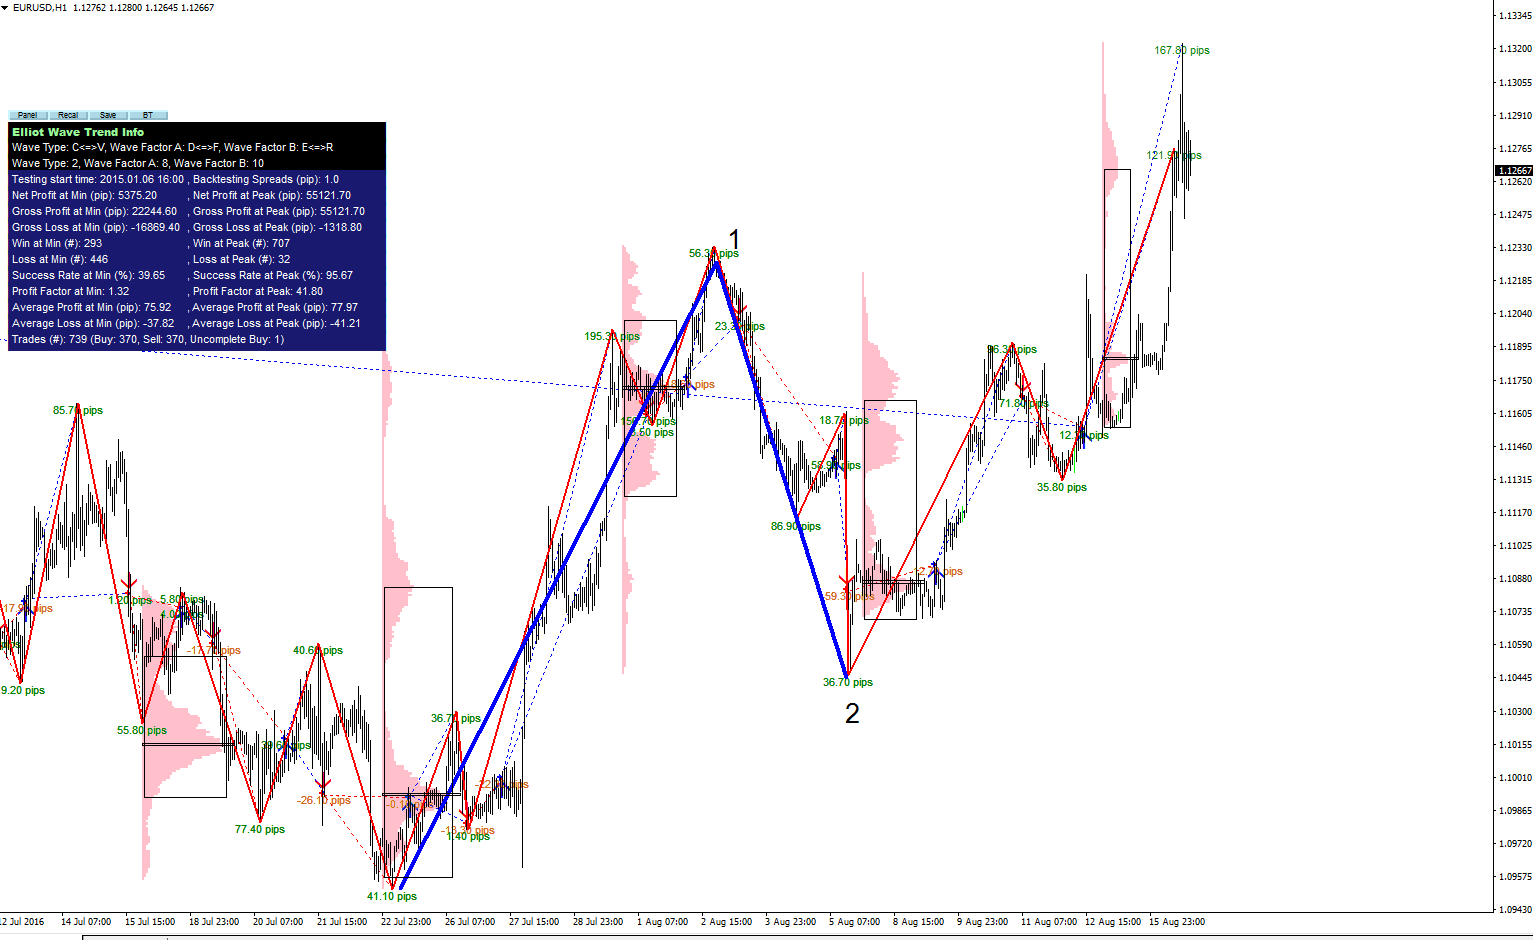
Since 280 pips rise at Wave 1, current movment made a remarkable high with total movement around 230 pips. If the price want to continue or want to bounce down and up one more time, it is not known. Also watch out 3 monthly market profile drawn in the charts.
https://algotradinginvestment.wordpress.com/2016/08/16/eurusd-outlook-4/
http://algotrading-investment.com/
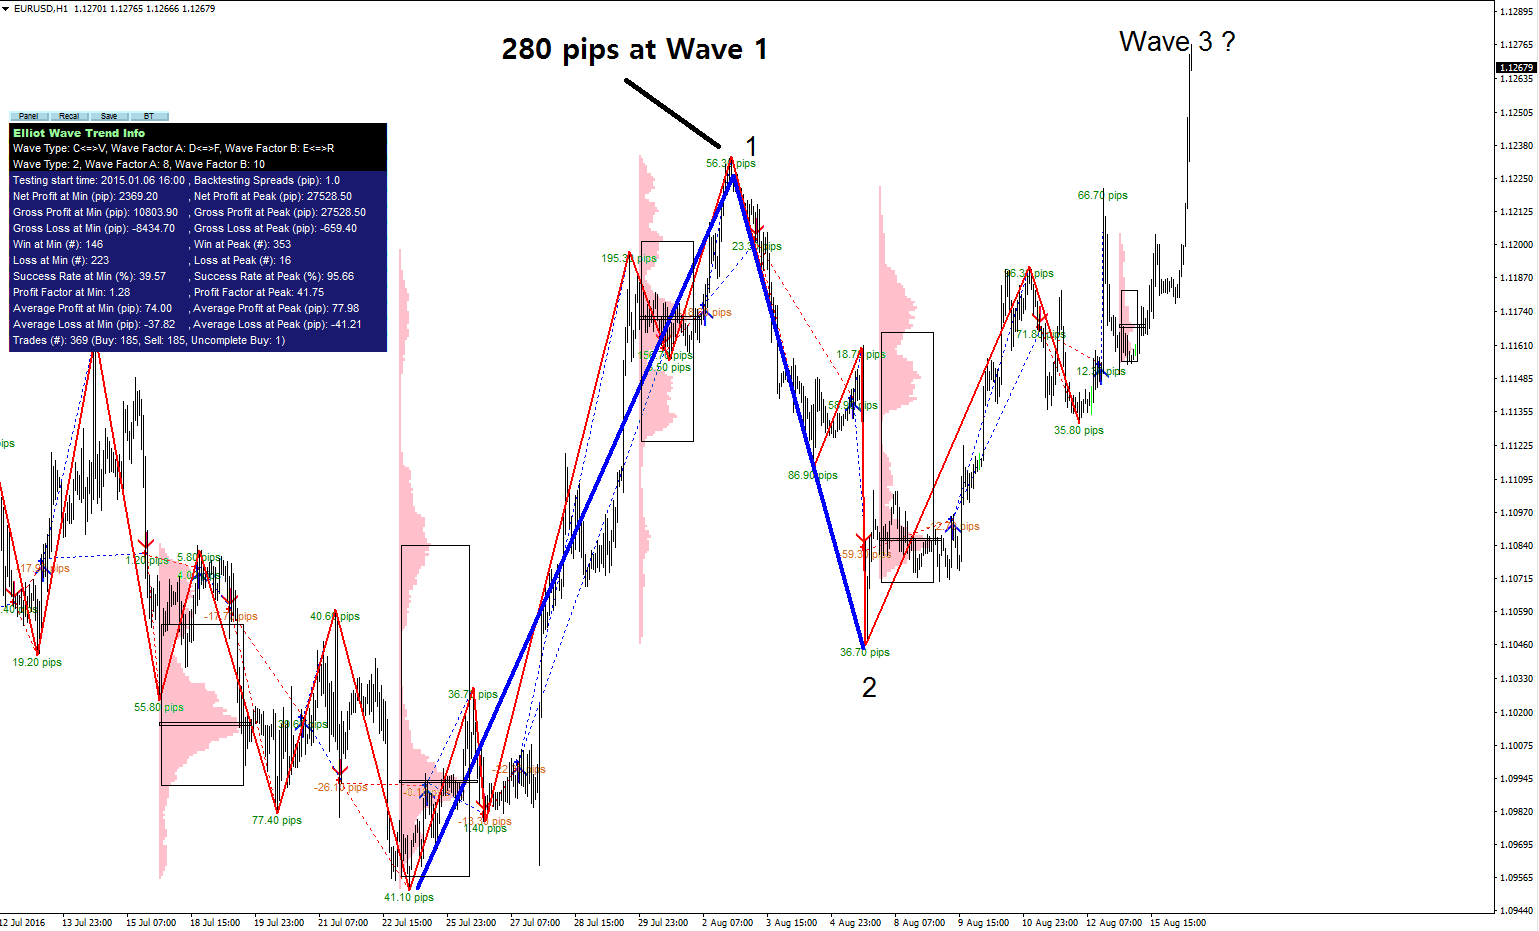
Following our last week, EURUSD outlook, EURUSD still attempting to make potential wave 3. Not yet it is too optimistic but still it is attempting.
Our analysis is based on our Elliott Wave Trend Analyser which turns your Elliott wave analysis into more scientific and evidential.
For non Elliott Wave practitioner, our Elliott Wave Trend analyser can be their best trend trading system too.
https://algotradinginvestment.wordpress.com/2016/08/15/eurusd-outlook-3/
http://algotrading-investment.com/
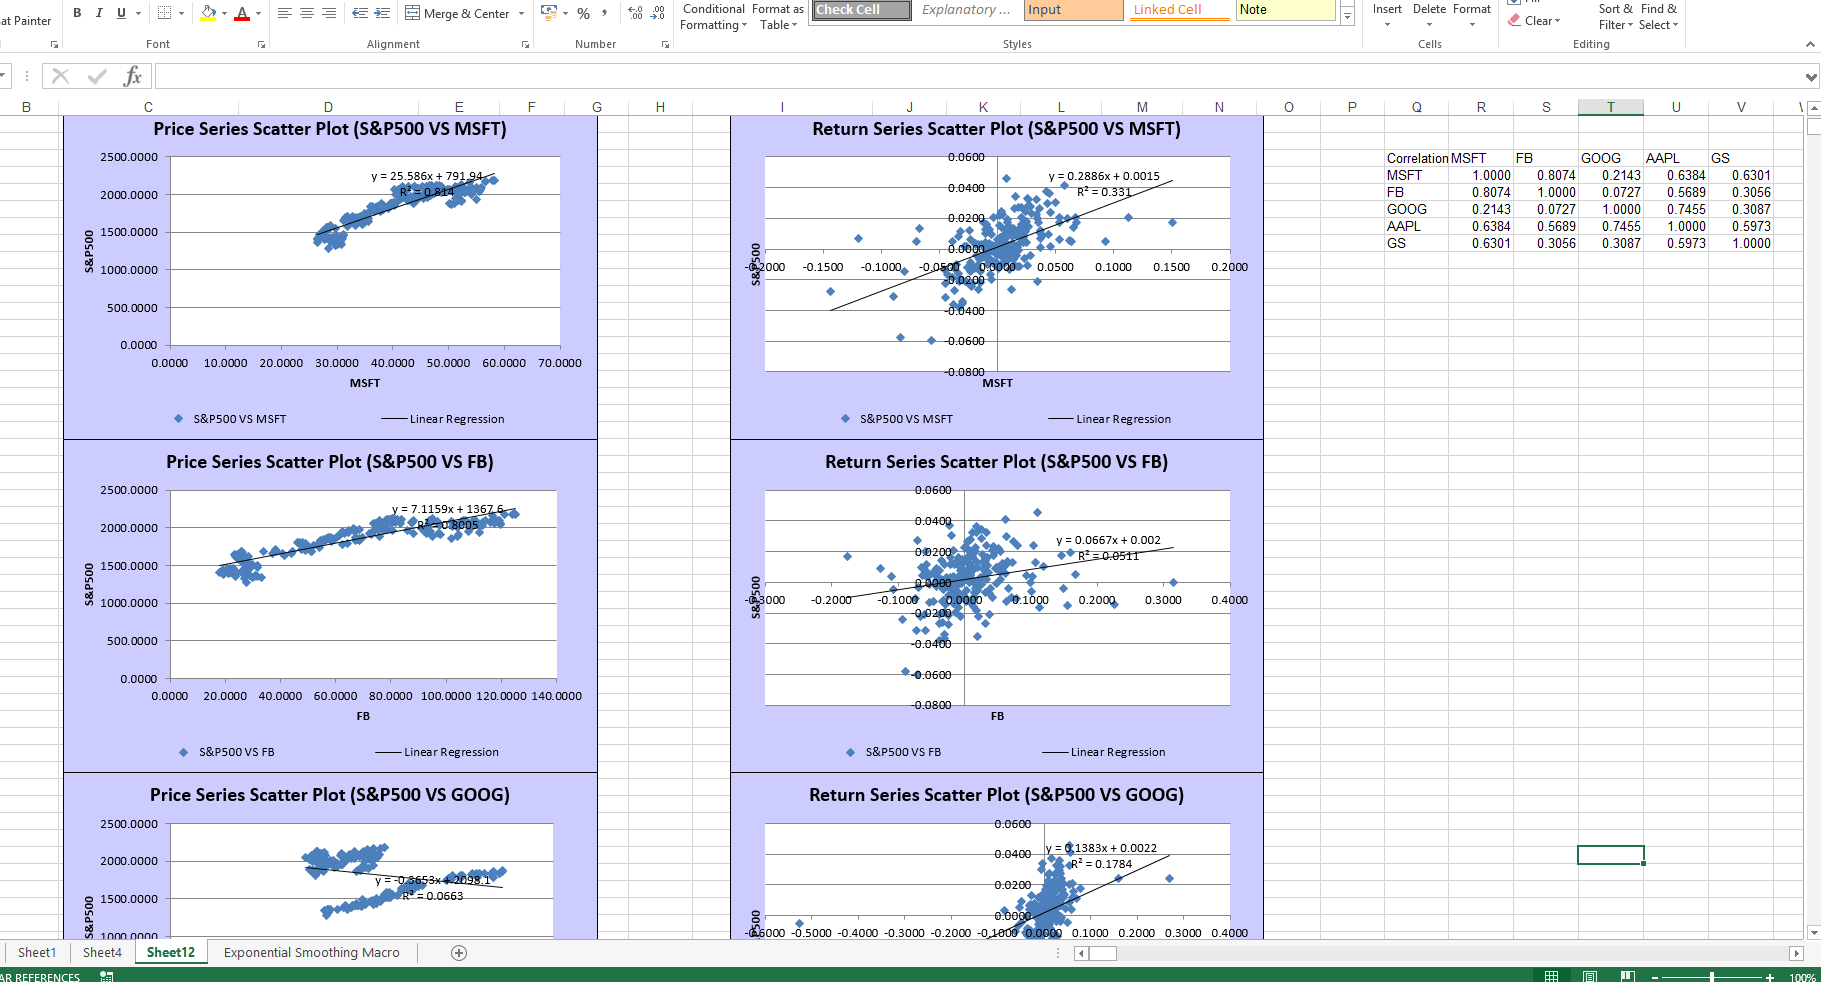
Regression analysis on S&P500 against Microsoft, Facebook, Google, Apple and Goldman Sachs.
This is fully automatic analysis performed from our Algorithmic Investment Tool. We are still working on this.
https://algotradinginvestment.wordpress.com/2016/08/14/market-analysis-2/http://algotrading-investment.com/
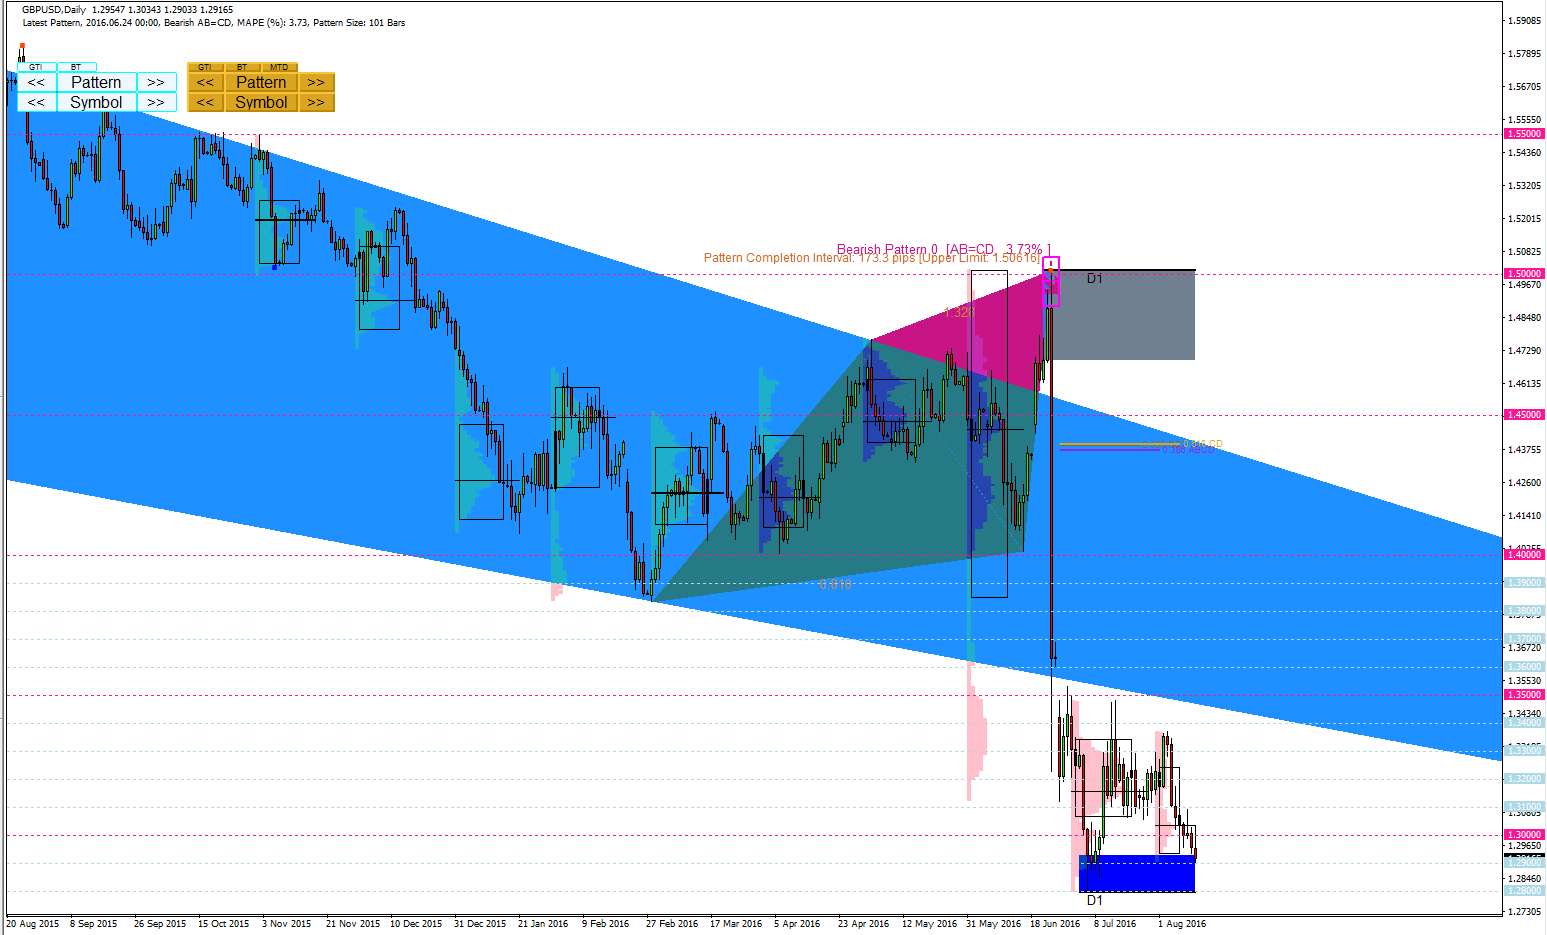
This is daily analysis on GBPUSD.
Finally GBPUSD touched demand zone.
https://algotradinginvestment.wordpress.com/2016/08/14/gbpusd-outlook/
http://algotrading-investment.com/
If you are not sure what is the descriptive statistics then you can have a look what they are in terms of a statistical point view.
https://en.wikipedia.org/wiki/Descriptive_statistics
Really sorry for the people do not like math. For trading and if you want to become a professional trader, then it is better for you to cover some basic math at least (I am talking about basic math). It is matter of your survival skills and for your longevity in your investment.
When you use Market Profile,
TPO – TPO or Time Price Opportunity is the basic building block of Market Profile. Each and every letter in the chart represents a TPO. Which in turn represents a point of time where the market touches a price. Each consecutive letter denotes a 30min period of Market Activity. In our example as shown below the letter ‘A’ represents how the price traded for the first 30min. Letter ‘B’ represents next 30min of activity. And Letter ‘C’ and ‘D’ represents subsequent market activity details and so on.
TPO Size : Practically speaking we need to define the size of TPO to make sure that your entire profile is visible. Generally one can try in Nifty Futures with TPO Size of 3 which mean each and every letter represents a block of 3 points in Nifty Futures. And TPO Size should depend upon the Trading Instrument. For greater accuracy of Key reference levels it is advisable to use TPO size as less as possible but with higher TPO Size more historical data can be seen and key reference levels out of range can be seen with higher TPO Size.
Initial Balance (IB) : Initial Balance represents the first hour of trade. Typically the high and low range of the letters ‘A’ & ‘B’. Longer the length of the Initial Balance stronger the conviction of Long term and Short term players.
Point of Control : Point of control is the price where most of the trade for the day happens. In other words the price where more number of TPO’s in a row. Todays ongoing POC levels are represented as DPOC (Developing POC) and Yesterdays POC (YPOC) and Previous POC levels are plotted as dotted green lines as shown above.
Value Area : Value Area is the fair price zone where the Other Timeframe Players (Long Term players and Shorter Term Players) loves to trade in this zone. 70% of the day’s trading happens here.
Value Area High (VAH) – The upper level of value area. (upper Red Bracket Level). YVAH – Yesterday’s value area high is marked as Red Dotted Line.
Value Area Low (VAL) – The lower level of value area. (Lower Red Bracket Level). YVAL – Yesterday’s value area high is marked as Blue Dotted Line.
Single Prints : When there is only one TPO in a Row. From the above picture you can identify that Letter ‘D’ and ‘L’ are single prints.
Range : High-Low range for the day
Open Range : First 10 minutes of the market movement range. It is represented as the Blue Vertical lines in the Initial Balance (IB)
Range Extension – An extension of price above or below the initial balance.
High Value Node (HVN) : An HVN is a price area of high TPO count or volume. The market traded for a long time at this level. These often form support or resistance levels when the price re-visits the area.
Low Value Node (LVN) : An LVN is a price area of low TPO count or volume. The market did not trade for very long time at this level. These often form support or resistance levels when the price re-visits the area.
https://algotradinginvestment.wordpress.com/2016/08/14/market-profile/
http://algotrading-investment.com/
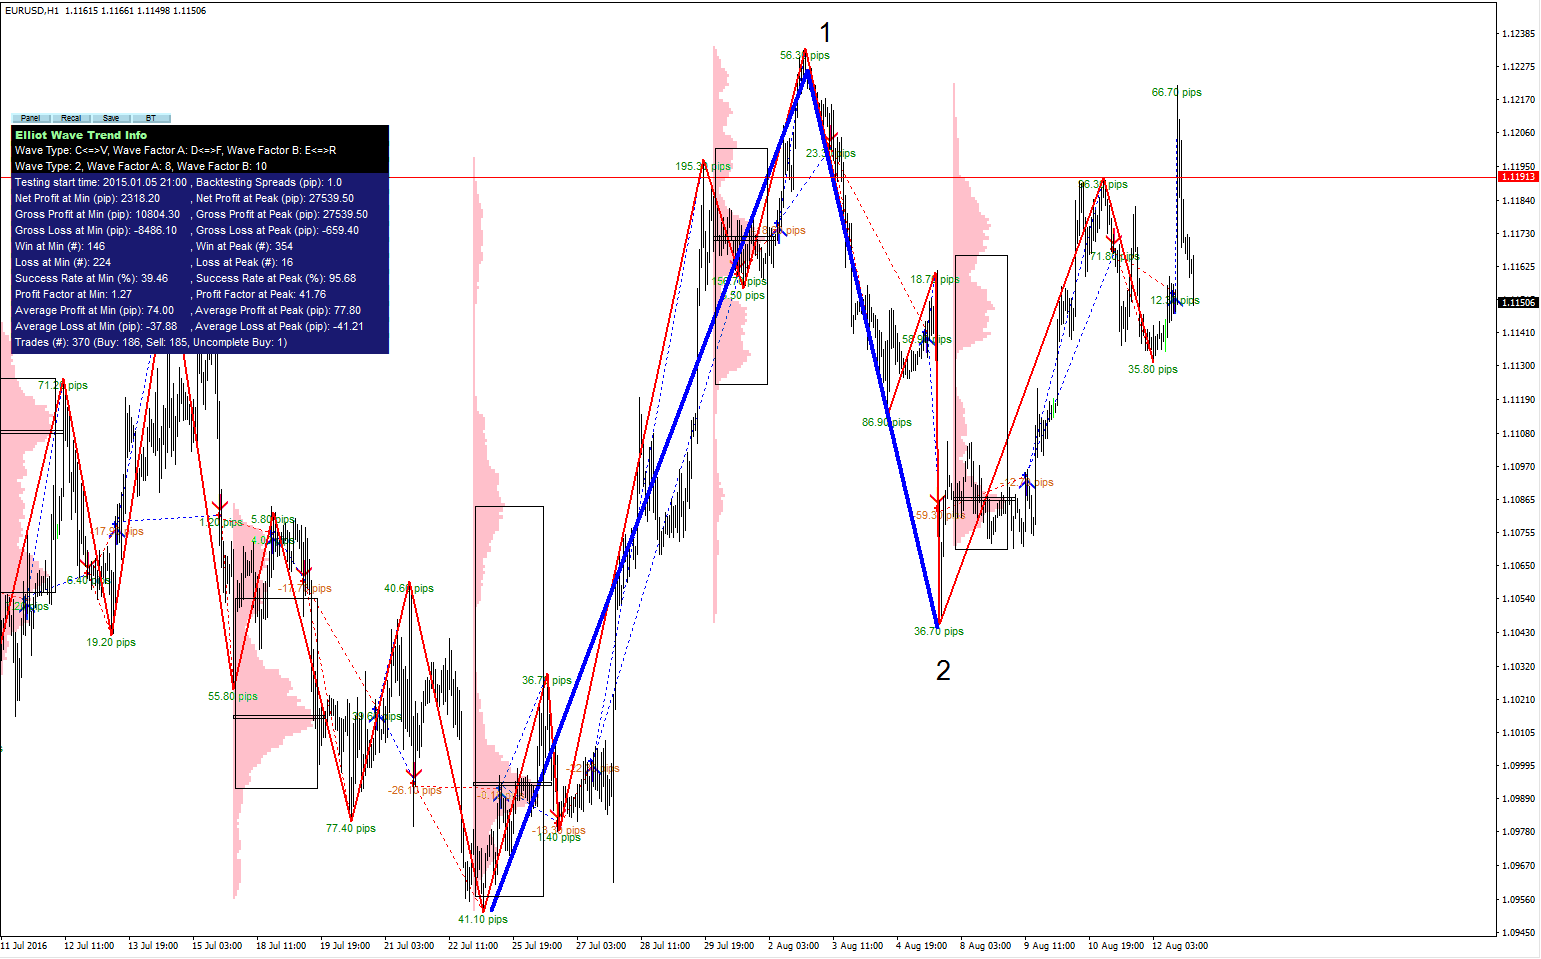
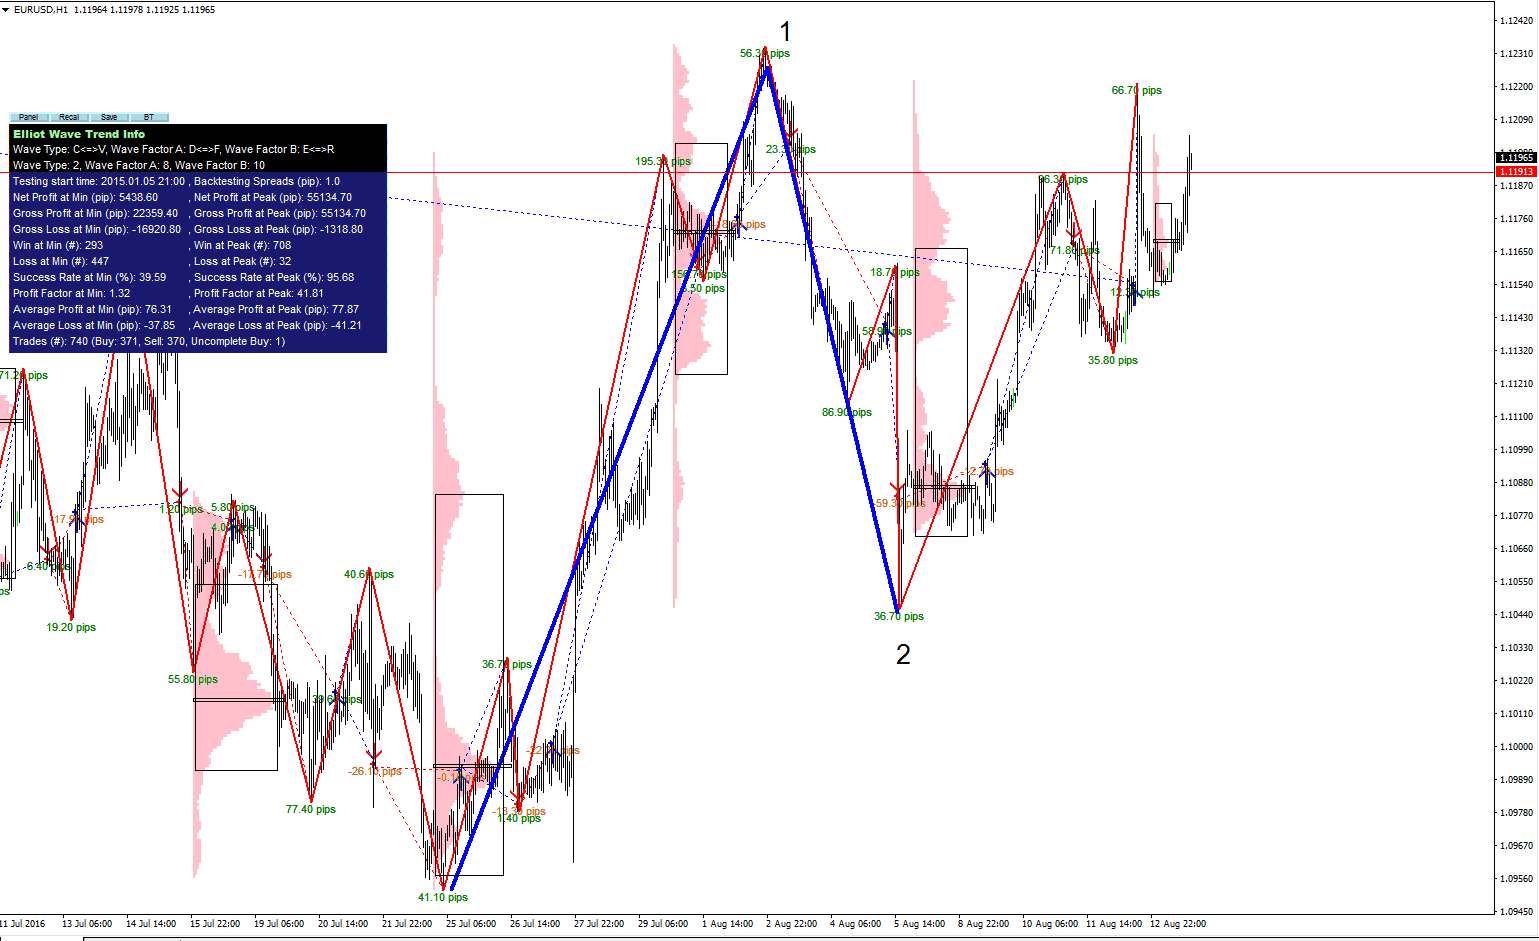
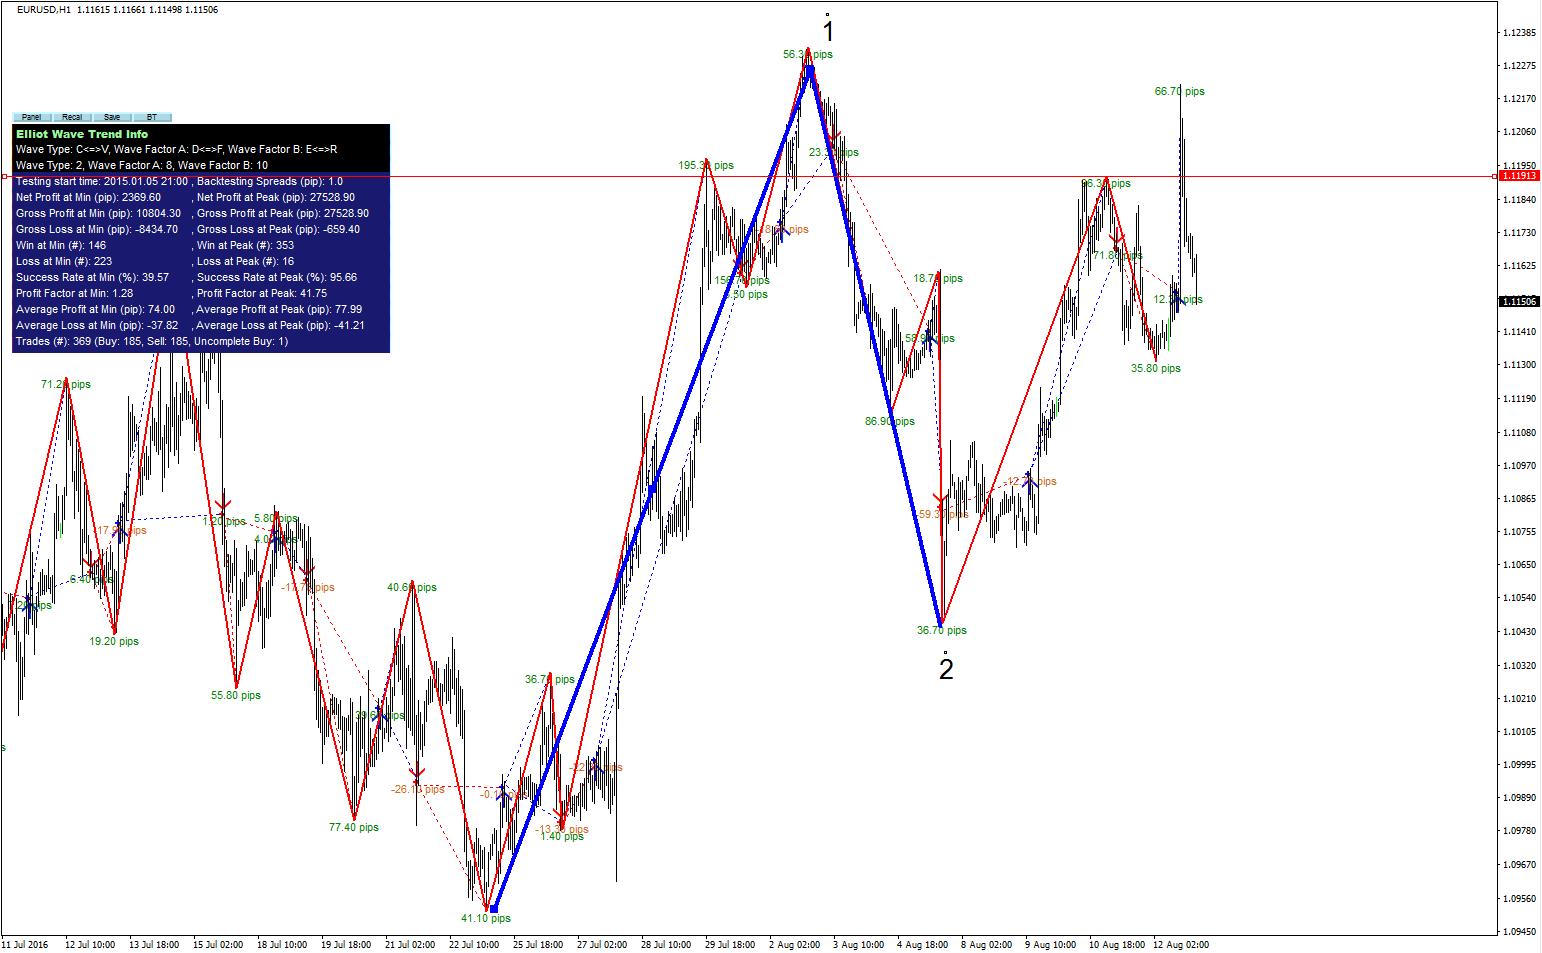
To make Elliott Wave 3, the EURUSD price must go over the wave 1.
First attempt of breaking the wave 1 high have been failed today.
But it is common to try several times. Let's wait and see.
Re-entry to 1.11913 must be watched out closely.
https://algotradinginvestment.wordpress.com/2016/08/13/eurusd-market-analysis/
http://algotrading-investment.com/
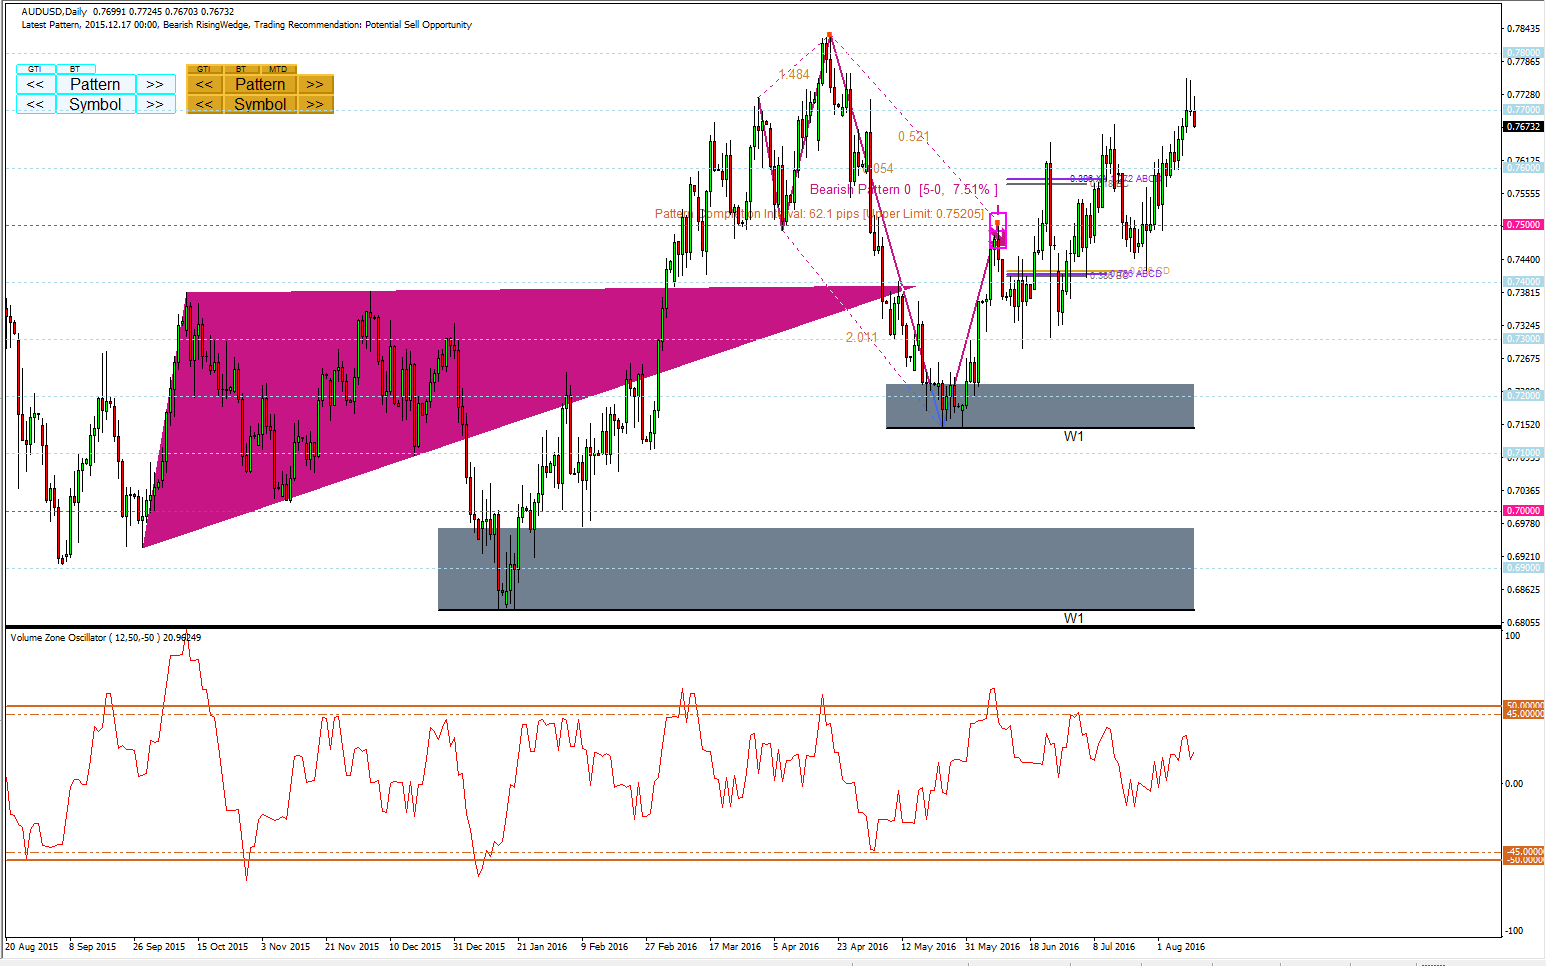
Watch out on two strong demand zone.
https://algotradinginvestment.wordpress.com/2016/08/12/audusd-market-outlook/
http://algotrading-investment.com/
Interesting Market Analysis on Microsoft, Facebook, Google, Apple, Goldman Sachs against S&P 500 index.
Interesting fact is Facebook have been extremely well last 5 years.
It has beta Smaller than 1.0. So it is less sensitive to overall market movement.
Goldman Sachs and google have the better CAPM return.
All these interesting analysis was produced by our Algorithmic Investment Tool
https://algotradinginvestment.wordpress.com/2016/08/12/market-analysis/
http://algotrading-investment.com/

Траектории движения финансового рынка схожи с полиномиальными искривлениями наличием случайных флуктуаций. Существует распространенное мнение, что можно разложить финансовые данные на множество различных циклических компонентов. Если какой-либо финансовый рынок обладает как минимум одним циклом, то в этих финансовых данных должна быть точка разворота. В таком случае, большинство данных финансовых рынков должны иметь кратные точки разворота, поскольку обычно они состоят из множества циклических
Траектории движения финансового рынка схожи с полиномиальными искривлениями наличием случайных флуктуаций. Существует распространенное мнение, что можно разложить финансовые данные на множество различных циклических компонентов. Если какой-либо финансовый рынок обладает как минимум одним циклом, то в этих финансовых данных должна быть точка разворота. В таком случае, большинство данных финансовых рынков должны иметь кратные точки разворота, поскольку обычно они состоят из множества циклических

