Fancy Linreg Candles
- Индикаторы
- Minh Truong Pham
- Версия: 1.0
- Активации: 5
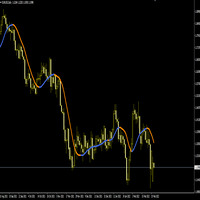
There are many linear regression indicators out there, most of them draw lines or channels, but this one actually draws a chart.
The beauty of the indicator like Heiken Ashi is it removes a lot of market noise.
4 (OHLC) arrays are filled with Linear Regression(LR) values of each price for the LR period (default=14).
The period of the Linear Regression is adjustable dependant on the market conditions. The SMA (default=14) also has period adjustment.
Candles are generated with Green for 'Up' candles (with wicks) and Red for 'Down' candles. An SMA of the LR Close is included because the way this indicator is supposed to be used is as follows;
If the green candles are above the SMA, go long. If the red candles are below the blue SMA, go short. In my opinion, I would use some other exit signal but entries look good for a lagging trend indicator.
Definitely has a Heiken Ashi feel about it.
On the Demo version, just press "start" on the Strategy Tester.
Try and set the MA to a lower value to closely match the candles. You may need to hide the background bars/candles(use properties) to see it perform better


