Contraction Breakout
- Индикаторы
- Darko Licardo
- Версия: 1.1
- Обновлено: 12 июня 2023
- Активации: 5
As traders, we know that identifying price contractions and consolidations is crucial for profitable trading. Fortunately, we have a powerful tool at our disposal.
The indicator to trade price consolidation is designed to identify price contraction and alerts us on formation. It does this by analyzing historical price data and identifying price action patterns.
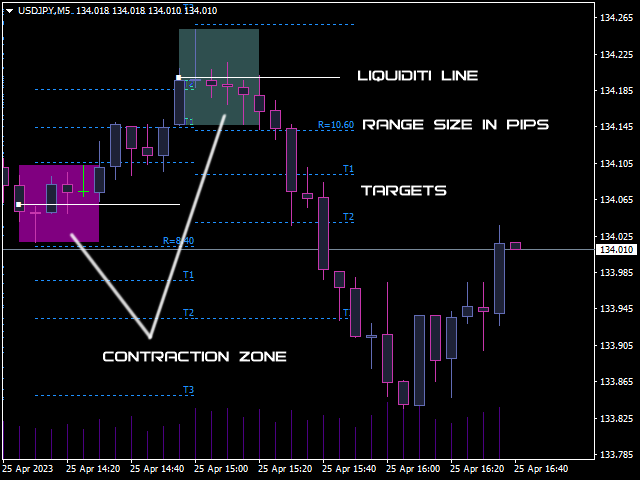
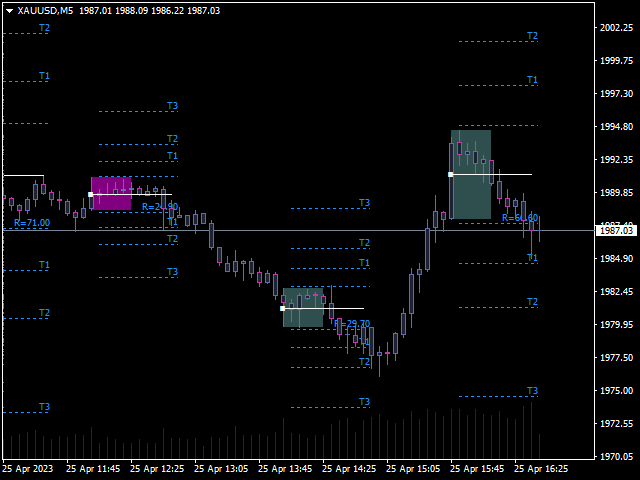
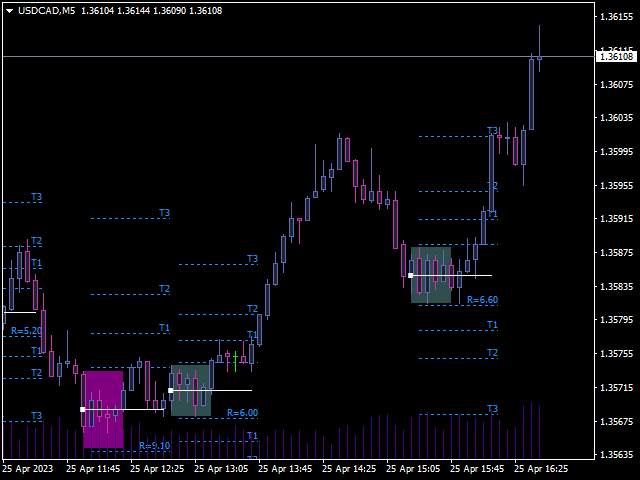
The algorithm then uses this information to mark the zone , potential targets and liquidity lines, giving us valuable insights into market behavior.
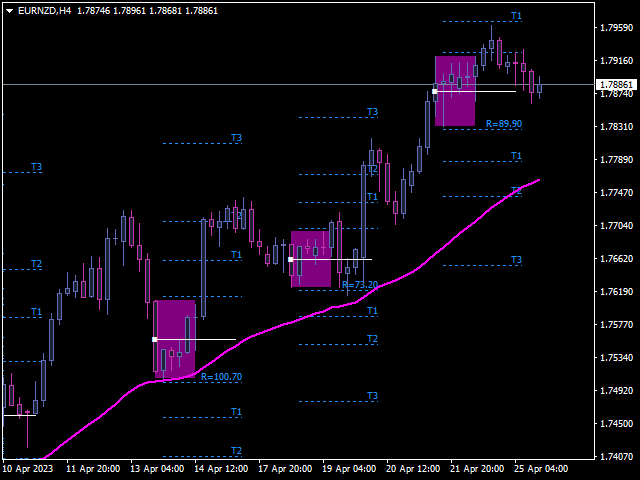
Traders can adjust parameters such as colors ,alerts types and how many previously formed zones to display on chart . Furthermore, the indicator can be used on a variety of assets, including stocks, commodities, and forex pairs on all timeframes.
Benefits of Using the Indicator
Using the indicator to trade price contractions or consolidation has several benefits for traders. Firstly, it saves screen time and effort by automating the process of identifying consolidations and breakouts.
Traders no longer have to manually shift through price data to find potential trading opportunities.
The algorithm, on the other hand, operates based on objective rules and parameters, eliminating the potential for emotional bias.
Thirdly, it provides valuable insights into market behavior
Additionally, it can help traders to identify potential exit points, minimizing losses and maximizing profits.
Using the Indicator in Practice
To use the indicator to trade price congestions or consolidation effectively, traders should first familiarize themselves with its features and capabilities.
(e.g. you can load indicator on the chart and analyze past contractions zones and price action related to them.)
Once the trader is comfortable with the algorithm, they can incorporate it into their trading routine.
Traders can use the algorithm to identify potential entry points, set stop orders or wait for candle close outside zones, and determine exit points.
They can also use the algorithm to manage risk by adjusting entry size based on the size of the range zone displayed on the support line of each zone.
Traders can also find potential contractions on higher TFs and find entry on lower TF.
Contraction types:
1.Contraction in ranging markets : price is ranging and makes one high volatility zone followed by more low volatility zones.
This also means that price stall on higher timeframe so we can check if there is a new contraction zone formed on higher time frame.
2.Contraction in trending market: market is in trend and price makes small contractions followed by breakouts in trend direction, if breakout is counter trend we can expect smaller moves up to T1.
3.Contractions on top and bottom:: after trend phase price make one or more contraction and price reverse
Liquidity line (white line in the middle of zone) is very helpful in trading, we can use it in several ways:
Often after zone breakout price retrace to breakout price or to liquidity lines.
Previous zone liquidity line attract price so we can use it as a target or new entry point
Conclusion
The indicator to trade price congestions or consolidation is a powerful tool that can help traders to identify potential trading opportunities and manage risk effectively.
By incorporating the algorithm into their trading routine and using it in conjunction with other strategies, traders can improve their trading performance and achieve greater success in the markets.

