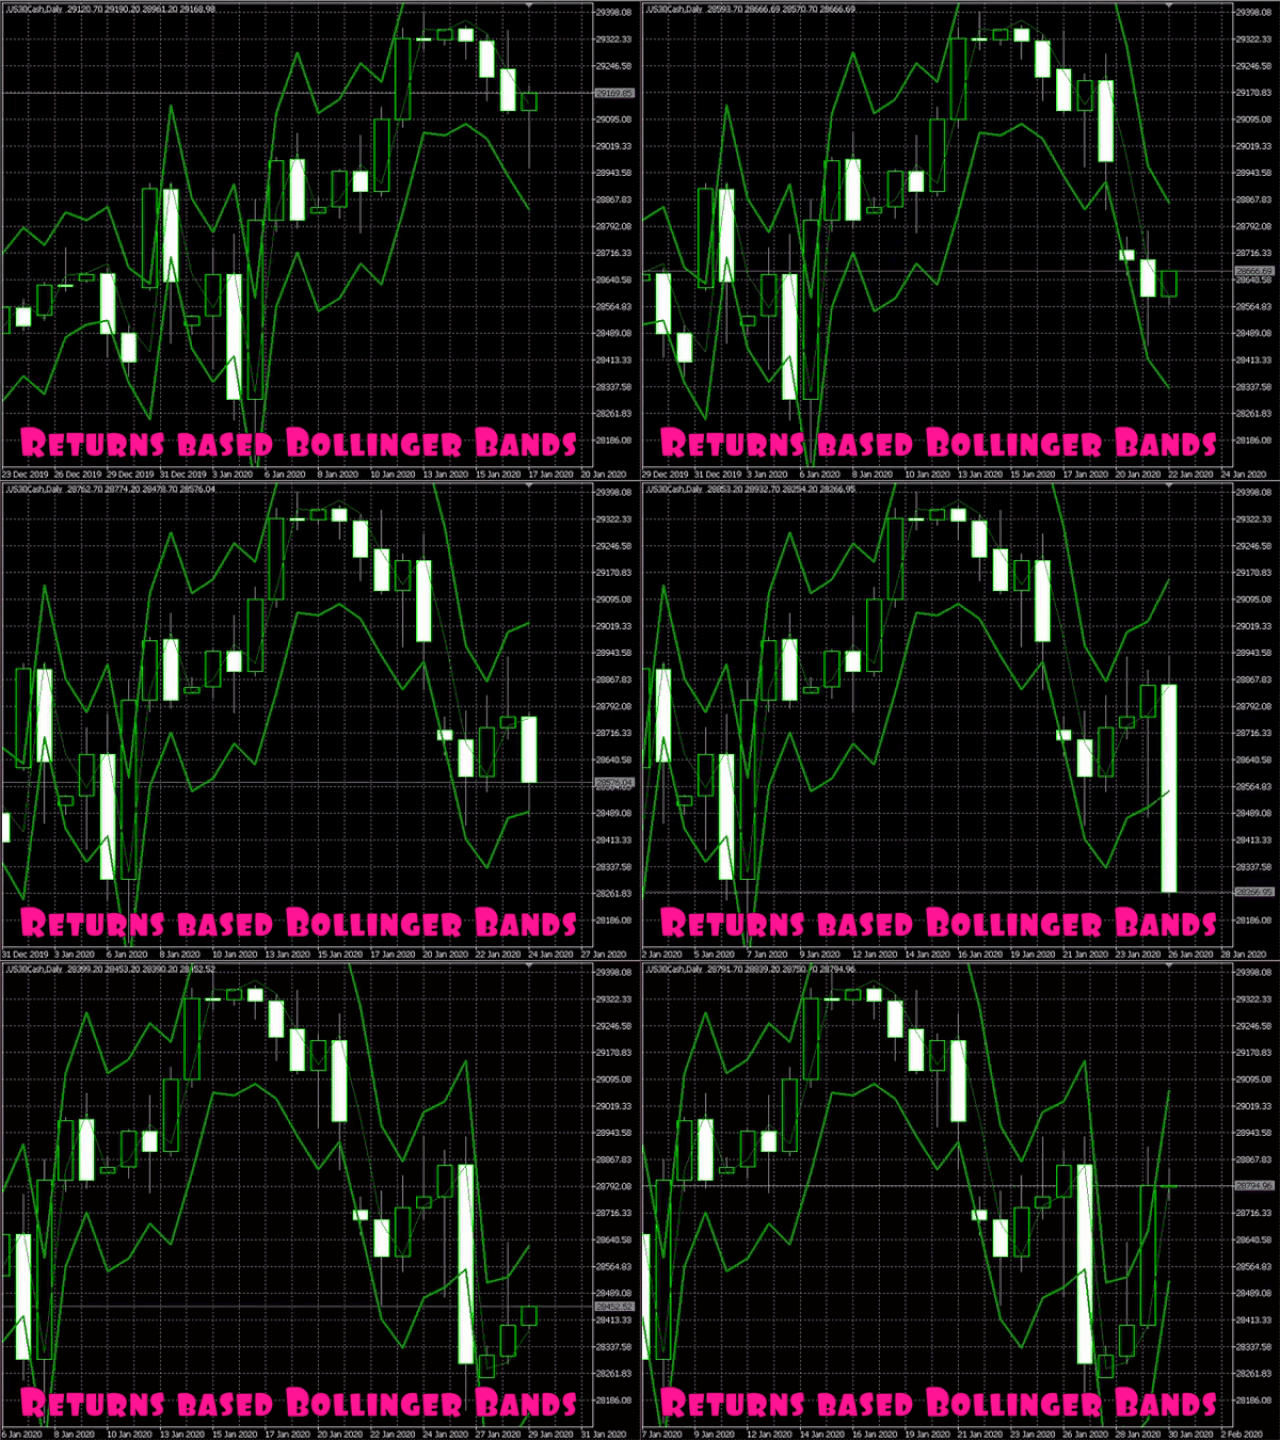
Returns based Bollinger Bands
- Индикаторы
- Florian Nuebling
- Версия: 1.0
- Активации: 5
Bollinger Bands based on Returns
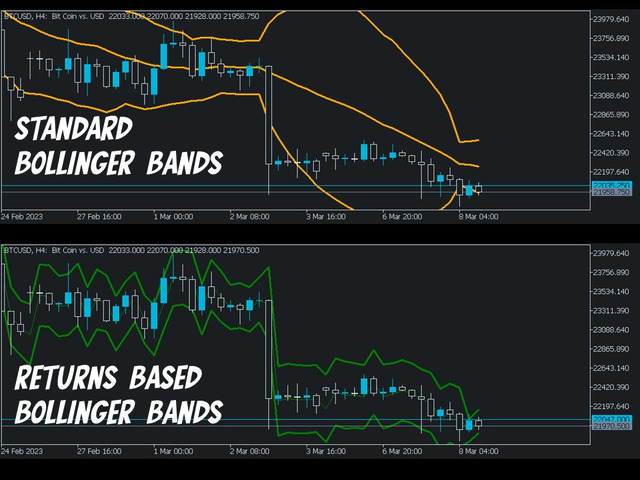
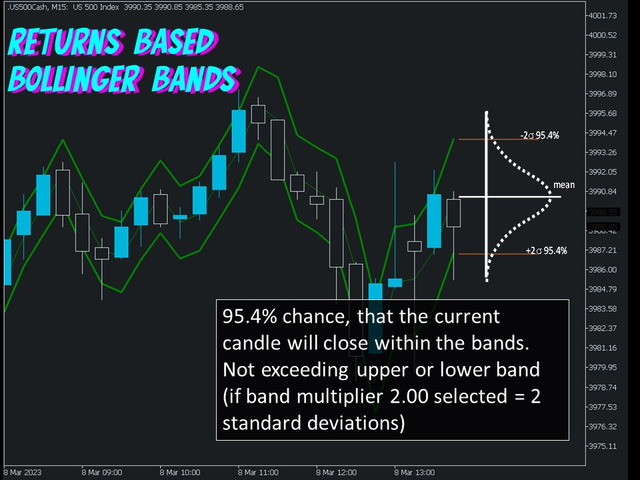
This indicator characterizes the price and volatility by providing a channel/band of standard deviations like the Bollinger Bands. In contrary to standard Bollinger Bands which uses price directly, this indicator uses returns due to normalization.
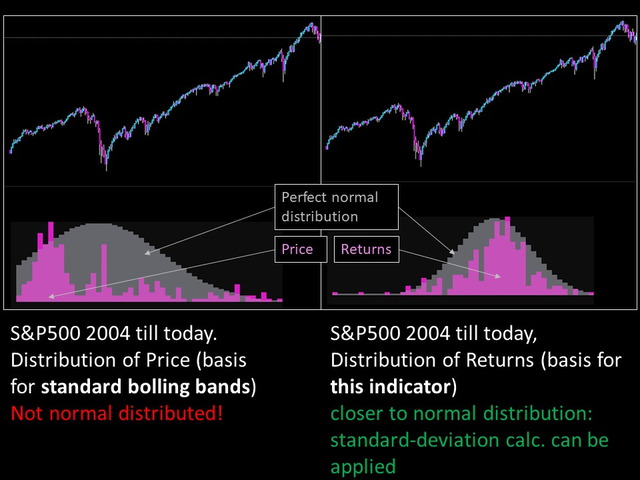
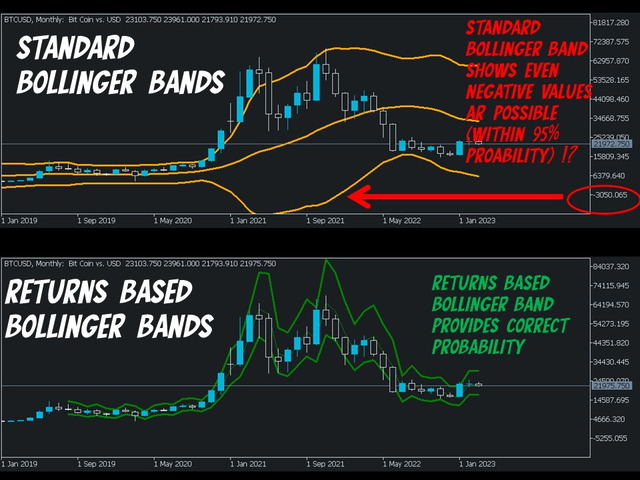
The standard Bollinger Bands based on price directly, were one of the first quant or statistical methods for retail traders available. The issue with these bands, standard deviations can only be calculated, if the underlying data is normal distributed. But price (data basis for Bollinger Bands) is log-normal distributed.
This indicator normalizes the underlaying price data to a normal distributed data, calculates the (standard) deviation and transfers the values back to its price domain. With this approach it is from statistical point of view, much more accurate and reflects the actual probabilities much better.
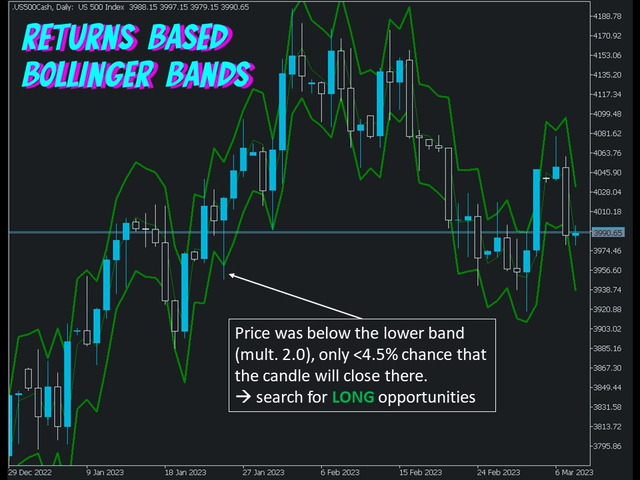
Similar as the standard Bollinger Bands, the upper and lower band for this indicator also reflects the limit, where it is unlike for the candle to close outside of this channel/band. If selected multiplier is 1.96 (1.96 Standard deviations), the probability is 95% that it will not close outside. If you choose multiplier 1.0 (1 SD), chances are 68.5% that it will not close outside.
Input:
Sample Size: 21 (periods back to calculate returns-based Bollinger Bands)
Multiplier: 1.96 (1.96 standard deviations)
Remark: Indicator is provided for statistical analysis and showing probabilities only and should not be construed as financial advice.

