Discrete Fourier Transform of Price
- Индикаторы
- Safwan Rushdi Khalil Arekat
- Версия: 10.2
- Обновлено: 26 января 2023
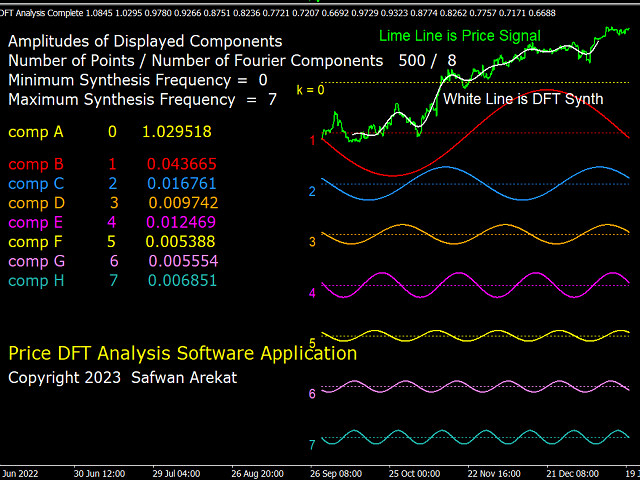
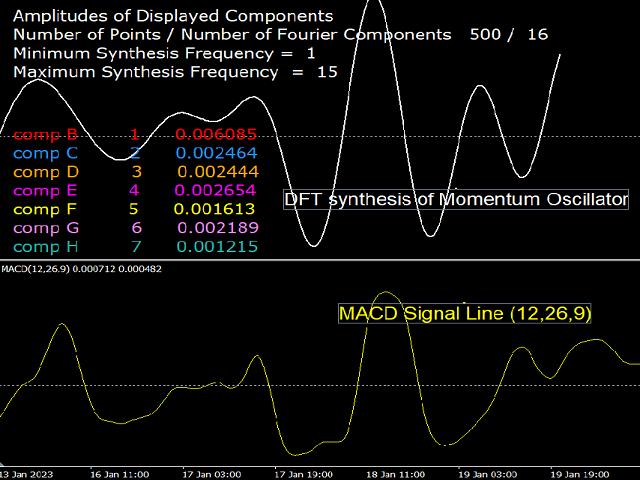
This indicator is a useful tool for visualising cyclic components in price. It calculates the Discrete Fourier Transform (DFT) of a price chart data segment selected by the user. It displays the cycles, the spectrum and the synthesised signal in a separate window. The indicator is intended as a learning tool only, being unsuitable for providing actual trade signals. Download the file - it is a free toy. Play with it to understand how signals can be transformed by controlling their cyclic components . This is the essential operation performed by digital filters. Many standard indicators like moving averages and oscillators (SMA, LWMA, EMA, MACD, CCI, DPO, AWSOME OSC,and Momentum, etc.), all have the form of such linear digital filters. This tool helps visualise the functioning of these indicators. The description contains very little mathematical equations as the goal is to concentrate on a conceptual framework and understanding.
Relation to electronic Digital Signal Processing (DSP): If we think of price as a signal in a digital electronic system, without complicating the situation with too much engineering detail, we can define price as a discrete time digital signal that is sampled once at repeating periodic linearintervals. The two main differences between price and the electronic digital signal is: first the price is always a positive definite quantity,and second the electronic signal is usually sampled at a much faster rates than price (for humans that is, not HFT systems). So, for example, the digital price signal will be the daily, hourly or quarter-hourly closing price, as it is conventionally represented.
If one inspects almost any price chart, one can see that the price changes in two readily discernible fashions, a fast erratic price change between consecutive periods, and a slower change in the overall price graph over many periods. In electronic systems, we identify the fast changes as “noise”, and the slower change as the actual “signal”. In trading language these are called “volatility” and “trend”, respectively. So, is there a "correct" way to decouple these two features, to obtain the desired trend on its own, which indicates the longer-term sustained price change? One approach is to apply the DFT.
The Discrete Fourier Transform DFT (sometimes called FFT): This method is one of the techniques used to analyse and process a discrete time signals in electronic systems (but it has vast application in many other fields), and it is not even the best technique at doing this in circuits, but it is simple enough to consider here . We will not go into the lengthy mathematics, rather, we concentrate on a conceptual description which we hope you will find to be sufficient and satisfying.
Brief Description of DFT: Any digital signal (or time series) having a length of N samples can be "Analysed" into N/2+1 sinusoidal oscillation components (cycles) of sequentially increasing period (decreasing frequency). The smallest period is twice the sampling length (i.e. two samples), and the largest period is N/2 samples. The amplitude of the cycles are different from each other, depending on the shape of the signal. The original signal can be "Synthesised" by adding all N/2+1 such cycles. If only a subgroup of cycles is used in the synthesis, then a different signal will be obtained. One can therefore customise the synthesis according to the desired signal. This is the essence of the "filter banks" technique in DSP.
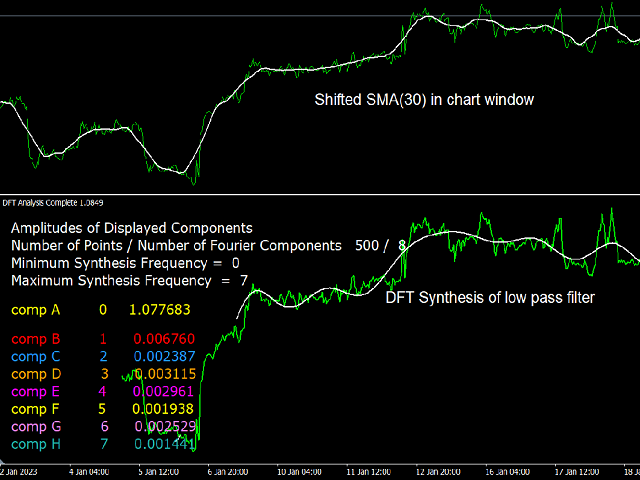
A Low Pass Filter: This filter can be obtained by using the dc (k=0) component, and a a range of low frequencies up to a certain cutoff (for example k=0 to k=7). This has the effect of the cancellation of all higher frequencies, hence the name low-pass. Because the trend signal is associated with low frequencies, and volatility to high frequency, the resulting signal corresponds to a de-noised trend signal. Thus a smoothed signal whose value and slow variation correspond to original signal .
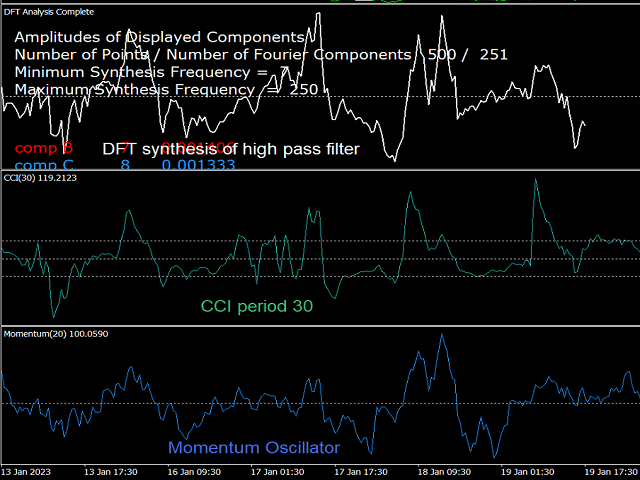
A High Pass Filter: This filter can be obtained by adding all frequencies above a certain minimum-pass frequency (for example k=7 to k=N/2). In any situation where the dc (k=0) component is eliminated, the resulting signal will be an oscillator. For the the high pass, the oscillator only includes the higher frequency components, thus the trend component is eliminated. Some standard indicators are high pass filter oscillators, such as the DPO and CCI oscillator, since their signal is obtained by subtracting a moving average from the original signal, thereby removing the dc component while keeping the high frequencies.
A Band Pass Filter: This filter uses a range of frequencies that does not include the highs and lows. For example k=7 to k=30. The resulting signal is an oscillator since the k=0 has been removed. Many oscillators in technical analysis have the form of a band pass oscillator, the most famous being the MACD, which is meant to function as a momentum oscillator. But the momentum oscillator adds the frequencies in a prescribed manner, as will bed clarified in other free indicators by this developer..
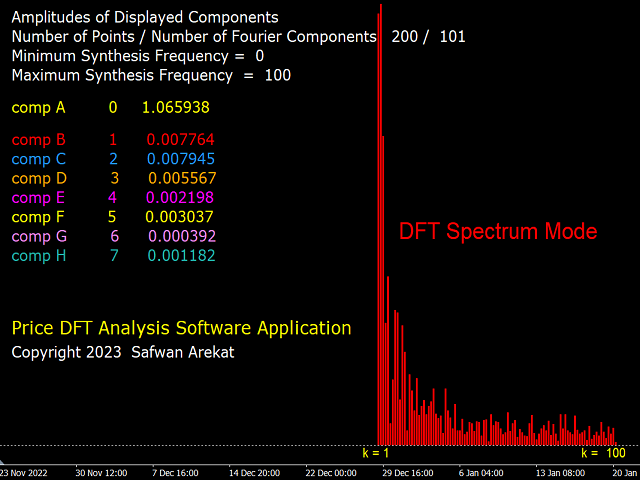
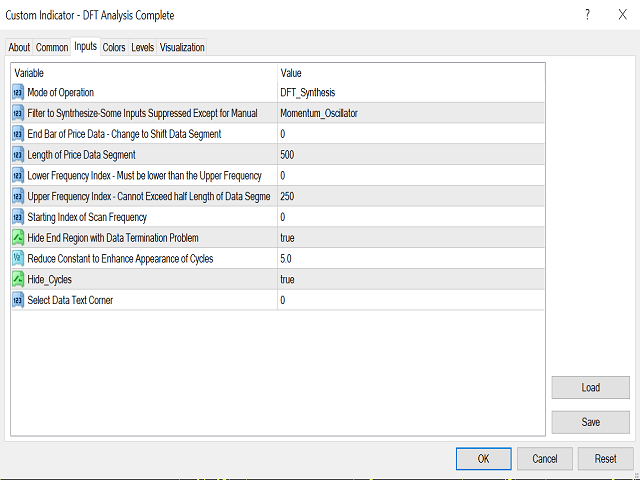
The Indicator Controls: An attempt has been made to keep the inputs parameters easy to understand and use. There are three modes of operation: 1) DFT Analysis, which displays the cycles present in the signal. 2) The synthesis mode where the filters described above can be customised. 3) DFT spectrum mode which displays the relative strength of each cycle. The user can "play" with this system with the goal of gaining a better understanding of the meaning and function of digital filters and how they are related to many of the technical indicators in common use.
Wishing you a great learning experience and . . . Enjoy !







Пользователь не оставил комментарий к оценке