Master of market structure
- Индикаторы
- Minh Truong Pham
- Версия: 1.0
- Активации: 5
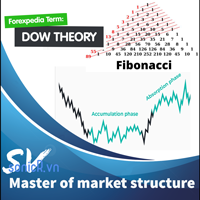
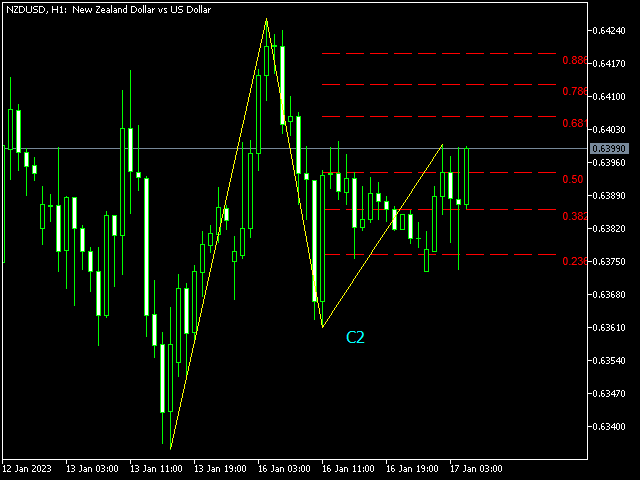
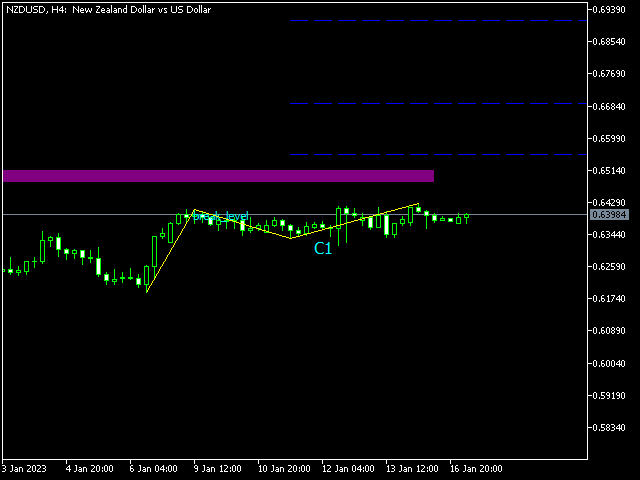
This indicator combine DOW theory with Fibonancy level to determine the structure of financial markets. It include resistance determine to provide an overview of the market.
The Dow Theory is an approach to trading developed by Charles H. Dow, who, with Edward Jones and Charles Bergstresser, founded Dow Jones & Company, Inc. and developed the Dow Jones Industrial Average in 1896.
In summarize, DOW theory is:
+ Technical framework that predicts the market is in an upward trend if one of its averages advances above a previous important high, accompanied or followed by a similar advance in another corresponding average.
+ The theory is predicated on the notion that the market discounts everything, consistent with the efficient market hypothesis.
+ In such a paradigm, different market indices must confirm each other in terms of price action and volume patterns until trends reverse.
Fibonacci levels are commonly used in forex trading to identify and trade off support and resistance levels. We have two type: Fibonacci Retracements and Fibonacci Extensions
Fib retracement is use to define pinpoint where to place orders for market entry, taking profits and stop-loss orders:
+ The Fibonacci trading strategy uses the "golden ratio" to determine entry and exit points for trades of all time frames.
+ This type of trading is highly contested as it is based on ratios that don't necessarily correlate to the individual trade.
+ Sticking to a numerical trading strategy like the Fibonacci strategy will help to limit or remove emotional bias from trades.
Fib extensions is used to define target of level 1 trend:
+ Because Fibonacci ratios are common in everyday life, some traders believe these common ratios may also have significance in the financial markets.
+ Fibonacci extensions don't have a formula. Rather, they are drawn at three points on a chart, marking price levels of possible importance.
+ The Fibonacci extensions show how far the next price wave could move following a pullback.
+ Based on Fibonacci ratios, common Fibonacci extension levels are 61.8%, 100%, 161.8%, 200%, and 261.8%.
+ Extension levels signal possible areas of importance, but should not be relied on exclusively.
