MP Andean Oscillator
- Индикаторы
- Pierre Ksachikian
- Версия: 1.0
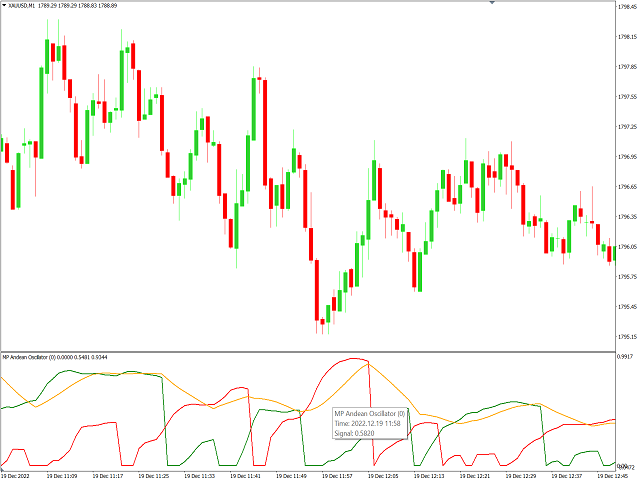
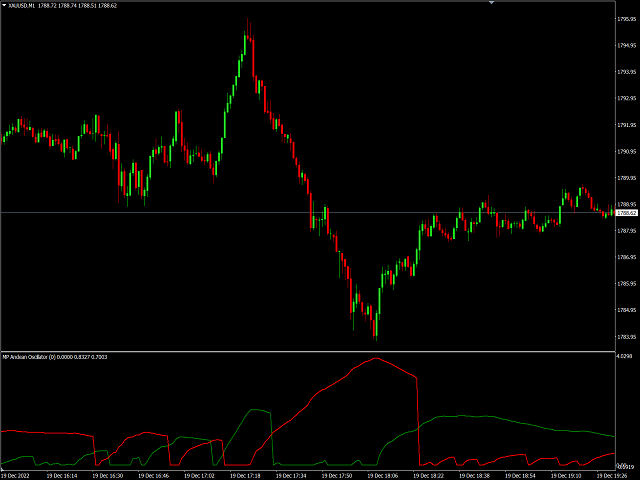
The MP Andean Oscillator is used to estimate the direction and also the degree of variations of trends.
It contains 3 components: Bull component, Bear component and Signal component. A rising Bull component indicates that the market is up-trending while a rising Bear component indicates the presence of down-trending market.
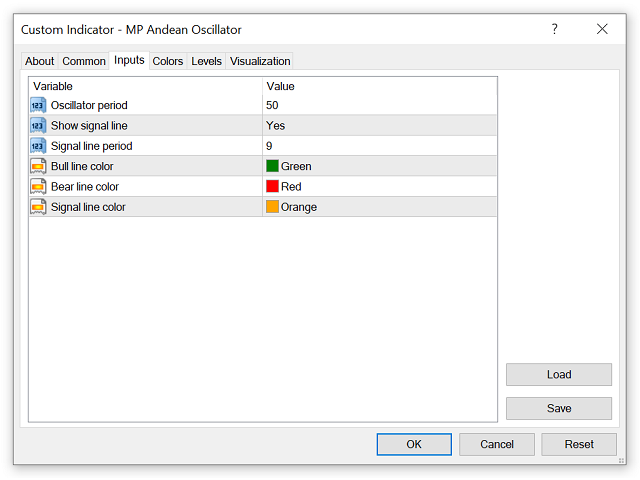
Settings:
- Oscillator period: Specifies the importance of the trends degree of variations measured by the indicator.
- Signal line per: Moving average period of the Signal line.
Usage rules:
- Long: Bull line crosses over Bear line
- Short: Bear line crosses over Bull line
- Exit Long: Bull line crosses under Signal line
- Exit Short: Bear line crosses under Signal line
Although the Signal line can be used to filter out false signals but it may induce a worse timing compared to above mentioned conditions.
Important notes:
___________________________________________________________________________________
Disclaimer:
Do NOT trade or invest based upon the analysis presented on this channel. Always do your own research and due diligence before investing or trading. I’ll never tell you what to do with your capital, trades or investments. I’ll also never recommend for you to buy, sell, long or short any asset, commodity, security, derivative or cryptocurrency related instrument as it's extremely HIGH RISK! You should always consult with a professional/licensed financial adviser before trading or investing in any type of assets.
Пользователь не оставил комментарий к оценке