MP Woodie Pivot Levels for MT5
- Индикаторы
- Pierre Ksachikian
- Версия: 1.0
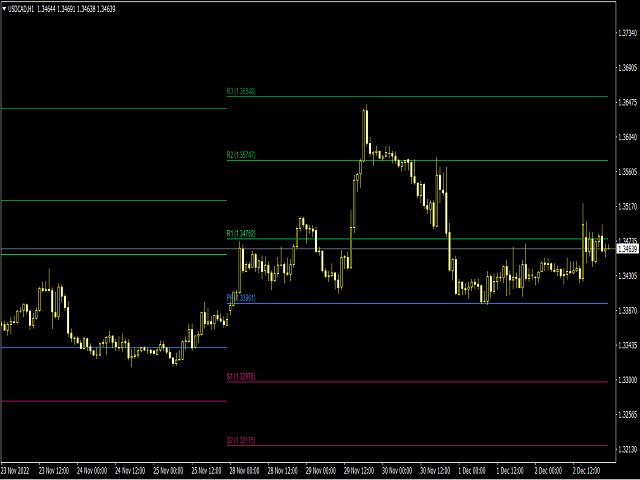
This indicator is stand alone version from MP Pivot Levels (All in one) containing Woodie Pivots.
Woodie’s pivot points are made up of multiple key levels, calculated from past price points, in order to frame trades in a simplistic manner. The key levels include the ‘pivot’ itself, and multiple support and resistance levels (usually up to three each). Traders use these levels as a guide for future price movements when setting up trades.
The pivot: (Previous high + previous low + 2 x previous close) / 4
| PIVOT LOCATION RELATIVE TO PRICE | DIRECTION BIAS |
|---|---|
| Price above pivot | Bullish bias |
| Price below pivot | Bearish bias |
R1: (2 x pivot) – previous low
R2: Pivot + high - low
R3: High + 2 x (Pivot – low)
S1: (2 x pivot) – Previous high
S2: Current pivot – (R1 – S1)
S3: Low – 2 x (High – pivot)
___________________________________________________________________________________
Disclaimer:
Do NOT trade or invest based upon the analysis presented on this channel. Always do your own research and due diligence before investing or trading. I’ll never tell you what to do with your capital, trades or investments. I’ll also never recommend for you to buy, sell, long or short any asset, commodity, security, derivative or cryptocurrency related instrument as it's extremely HIGH RISK! You should always consult with a professional/licensed financial adviser before trading or investing in any type of assets.