• Обзор
  • Отзывы
  • Обсуждение

Trend Lines continuous

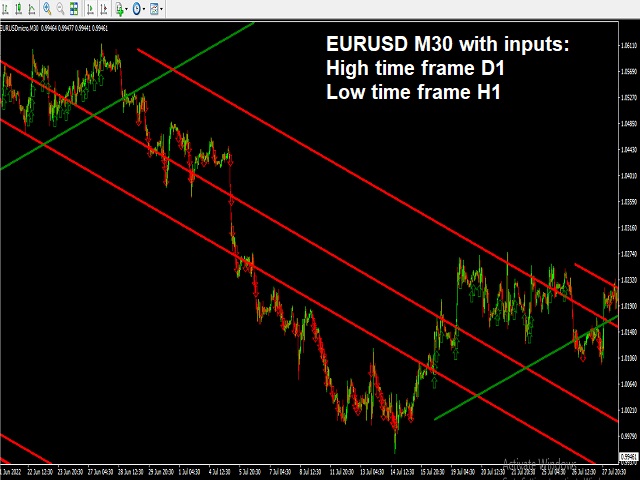
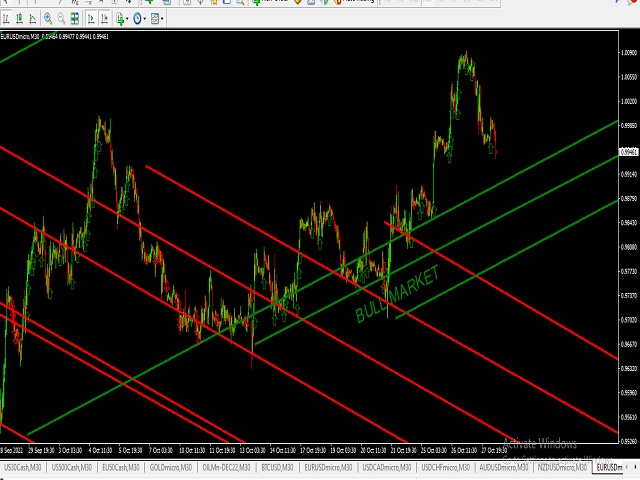
Trend Lines contiuous Signal (FREE one WEEK)  This indicator draws current trend line and provides Buy/Sell Signal based on calculations on Higher frame (Trend) and Lower frame(Entry signals)


* You should select the higher and lower frame for indicator calculations

* You select the Trend line colors as you prefer

* Enable or disable Alerts!

Trend lines UP/Down are drawn when a trend is detected

Wait for small arrows for entry :

*Normally an UP arrow in an UP Trend is a BUY signal :

---you Close the BUY position IF a Reverse DOWN Trend signal appears Or when Up trend line crossed down 

*Normally a DOWN arrow in a DOWN Trend is a SELL signal :

---you Close the SELL position IF a Reverse UP Trend signal appear     Or when DOWN trend line crossed up

my  proposed input parameters : 

M30 Chart :::::  High time frame : D1  Low time frame : H1    

M1 Chart :::::  High time frame : H1  Low time frame : M5  


Рекомендуем также
Nash Equilibrium MT4 рисует канал в виде тренда, а также конверта или полос. Вы можете использовать белые линии в качестве уровней перекупленности и перепроданности. В качестве средней линии между полосами индикатор отрисовывает белую штриховую линию, а также голубую (Aqua) и Оранжевую (Orange) линии. Смена одного цвета линии другим указывает на хороше момент для входа в рынок. Параметры nPeriod = 13 - число баров для расчета индикатора. nBars = 500 - число баров, на которых отображается индикат
G99 GRAVITY G99 Gravity is a channel indicator for the MetaTrader 4 terminal. This indicator allows finding the most probable trend reversal points. Unlike most channel indicators, G99 Gravity does not redraw. Attach the indicator to a chart, and the alert will trigger once a signal emerges. With our alerting system, you will never miss a single position opening signal! Advantages of the indicator Perfect for scalping. Excellent for identifying trend reversals. Suitable for beginners and exper
FiboStrategy MT4
Alexander Vinogradov
3 (2)
Индикатор основан на фибо-уровнях. Цель индикатора Рассчитать первое движение рынка (в направлении от 0 до 100 уровня). Исходя из направления, показывает возможное движение цены от 100 и выше к уровню Profit Level , а также в обратном направлении до уровня Correction level  и Revers level . Индикатор не перерисовывается! Все уровни индикатора настраиваются по желанию трейдера: CorrectLvl - уровень коррекции, при достижении которого отрисовывается уровень 100 (рынок сделал первое движение). Реко
BB St Dev Индикатор BB St Dev является аналогом индикатора Боллинджера. Верхняя и нижная части канала Боллинджера рассчитываются при помощи iStdDev . iStdDev является стандартным индикатором МetaТrader 4. У Moving average имеется специальный алгоритм для сглаживания. Настройки M - Период Moving average Параметр BandsDeviations - фактор формировании канала. В отличии от классических лент Боллинджера, BandsDeviations здесь может принимать любое значение. Параметр Visio Если Visio = False , то инди
Индикатор iVeles_Channel_Extremum_II_MTF вычисляет точки слома направлений движения цены на установленном в параметрах ТФ, на основе этих точек и выбранного их количества строится основной канал цены, который можно использовать в качестве уровней поддержки и сопротивления для меньшего ТФ, на котором установлен индикатор. В зависимости от направления движения основного тренда рассчитывается средняя линия канала по уровню Фибоначи, от которой, как правило, идет отскок в сторону тренда. Также по ур
ADX Pointer основан на индикаторе "Average Directional Index". Он рисует в окне графика три числа в соответствии со значением ADX. В индикаторе ADX можно установить период "ADX_Period", а также три уровня. Когда значение ADX превысит первый уровень ("ADX_Level1"), в окне графика появится число "1". Когда ADX превысит второй уровень ("ADX_Level2"), появится "2", а при превышении третьего уровня ("ADX_Level3") появится надпись "3". Простой. ADX Pointer работает на всех таймфреймах и валютных парах
Индикатор отображает в дополнительном окне значение стандартного отклонения цены от среднеквадратичной скользящей средней линий. На скриншоте показаны стандартный индикатор (нижний) и индикатор SqrtDev (верхний). Параметры SqrtPeriod - период среднеквадратичной линии и стандартного отклонения. SqrtPrice - тип используемых цен (выпадающий список). BarsCount - количество обрабатываемых баров (уменьшает время загрузки при установке на график и использовании в программах).
The Oscillometer
Francisco De A Vilar Enriquez
It is a new indicator that frames the price movement and tracks it. It consists of oscillation channel and its center line   CL . For its calculation it is only necessary to introduce the amplitude of the channel. Because of this, it is a non-lagging indicator as it is not calculated based on a number of previous candlesticks. It removes any level of noise , showing the underlying price movement cleanly via the center line . It allows you to easily identify the beginnings and ends of the trend ,
Ozi Arrow - уникальный авторский индикатор, имеющий возможность отображения сигналов в направлении основной тенденции, или против нее. Для своих расчетов определяет ценовой канал, и если в недавнее время цена была у его границ и все условия по дополнительным фильтрам соблюдены, отображает сигнал в виде стрелок. Ozi Arrow подходит для любого таймфрейма, валютной пары. Сигналы индикатора не пропадают не при каких условиях. Отличительной особенностью является наличие фильтра тенденции, при активаци
"Индикатор Squeeze пытается определить периоды консолидации на рынке. В целом рынок находится либо в периоде тихой консолидации, либо в вертикальном обнаружении цены. Выявляя эти спокойные периоды, мы имеем больше возможностей попасть в сделки с потенциалом для больших движений. После того, как рынок входит в состояние "сжатия", мы наблюдаем за общей динамикой рынка, чтобы получить помощь в прогнозировании направления рынка, и ожидаем высвобождения энергии рынка." Индикатор Modified TTM Squeeze
Индикатор представляет собой 2 линии разных периодов: одна линия краткосрочная (красная линия), другая долгосрочная (синяя линия). Каждая из линий- это жесткий  Moving Average, взвешенный по многим параметрам. Соответственно, торговать нужно по волатильности графика. В индикатор для удобства добавлены скользящие средние периодов High, Low, Median((High-Low)/2).  Входные параметры: IndicatorPeriod: несколько периодов (general-общий, вычисление по всем периодам; small-краткосрочный; medium-средний
Alpha Trend sign - это мой давний и очень популярный торговый инструмент, который проверяет нашу торговую систему и четко сигнализирует о транзакциях, которые не дрейфуют.   Основные функции:   • В зависимости от того, показывает ли рынок активную область, показатели могут быть очень интуитивными, чтобы определить, является ли текущая конъюнктура трендовой или шоковой.   И в соответствии с индикатором стрелка врезается на рынок, зеленая стрела подсказывает купить, красная стрела подсказывает
Multi Andrew PitchFork
Kourosh Hossein Davallou
5 (1)
ANDREW’S PITCHFORK TRADING STRATEGY       Essentially, Andrew’s Pitchfork is a tool for drawing price channels. While two lines surrounding price are usually enough to draw a channel, the Pitchfork has an extra line. It is the median line or the handle of the Pitchfork.     The median line is central to this trading method. This is why Andrew’s Pitchfork is also known as the Median Line Method. TRADING RULES      There are many ways to trade using Andrew’s Pitchfork but the basic idea is that pr
Simple Long Short Bar A very concise and clear indicator, very easy to understand, but it is very useful for tracking trends. The usage of this indicator is very simple: Long signal: If the price shows signs of a long market, then a yellow box will appear. Short signal: If the price shows signs of a short market, then a blue box will appear. Bull strength: If the size of the box is large, it means the bull strength is strong, and vice versa. Short strength: If the size of the box is small, it m
Все точки пересечения индикатора Troopers будут точками, в которых изменяется направление тренда. Игнорируются резкие колебания цены, а также шумы вокруг усредненных цен. Сигнальные точки, места где изменяется цвет, можно использовать как точки потенциального разворота рынка. Индикатор отслеживает рыночный тренд с очень высокой надежностью. Данную разработку можно использовать как для долгосрочной торговли, так и для пипсовки на мелких периодах. Алгоритм индикатора реализует разновидность техни
Mr Beast Cobertura
Luis Mariano Vazquez Marcos
Mr Beast Super Hedge Asesor experto diseñado para trabajar encerrando el precio entre 2 valores hasta que rompa en una dirección tanto de compra como de venta. Este robot de trading de Forex ha sido desarrollado por MRBEAST como una herramienta para facilitar el trading intradía. Tenga en cuenta que el uso de este robot implica ciertos riesgos y no garantiza ganancias consistentes en el mercado de divisas. El robot de trading se basa en algoritmos y estrategias que he diseñado, los cuales se han
Индикатор Four Moving Averages ( см. описание, видео ), аналог Four Moving Averages Message   одновременно отображает в главном окне графика четыре Средние Скользящие линии с настройками по умолчанию: Зеленая и Красная представляют собой краткосрочный тренд, Красная и Синяя - среднесрочный тренд, Синяя и Желтая - долгосрочный тренд. Настройки скользящих средних и цвета можно поменять. Однако замечу, что данные параметры подобраны таким образом, что позволяют торговать на всех временных интервала
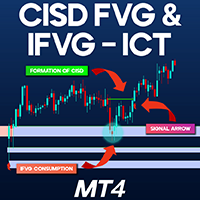
CISD FVG and IFVG ICT Indicator MT4 The CISD – CSD + FVG – IFVG indicator is an advanced ICT-based tool designed to identify CISD levels using Fair Value Gap (FVG) and Inverse Fair Value Gap (IFVG) . Built for MetaTrader 4 , this liquidity indicator dynamically maps CISD zones with directional arrow signals. These Change in Delivery Price (CISD) levels help traders understand market shifts and trend developments in real time.   CISD – CSD + FVG – IFVG Indicator Specifications Below is a summary
FREE
Provide ideas for trend trading. Automatic calculation and generation of trend channels. The channel line, also known as the pipeline line, is to draw a straight line parallel to the trend line in the opposite direction of the trend line, and the straight line crosses the highest or lowest price of the recent period. These two lines run the price in the middle and have obvious pipe or channel shapes. Necessary for traders: tools and indicators Waves automatically calculate indicators, channel
Данный индикатор отображает точки входа в рынок с помощью лент Боллинжера и точки выхода, которые определяются по заданному расстоянию в пунктах от точки входа. Линия индикатора выше цены говорит о медвежьем тренде. Если линия ниже цены, то на рынке присутствует бычий тренд. Информационная панель показывает результаты работы индикатора, чтобы можно было его настроить более точно и видеть, как параметры влияют на результат. Оповещение о точках входа и выхода приходит на телефон.  Преимущества Пр
The Icarus Auto Dynamic Support and Resistance  Indicator provides a highly advanced, simple to use tool for identifying high-probability areas of price-action automatically - without any manual input whatsoever. .  All traders and investors understand the importance of marking horizontal levels on their charts, identifying areas of supply and demand, or support and resistance. It is time-consuming and cumbersome to manually update all instruments, across all timeframes, and it requires regular
Oscillator The Trend Signal indicator is an indicator designed to generate trend signals. It uses its own set of algorithms and the moving average indicator to find signals. It has the feature of filtering the signals with the channel system. In this way, it tries to improve the quality of the signals. Features and Trade strategy There are two channels in the indicator. These channels are 70 and -70 channels. You will reach the signals without losing time thanks to the alarm features found on t
Вот несколько показателей, которые работают вместе. Он в основном работает с движущихся средних и различных уровней ATR создания динамического канала, через который цена осушенных. Как я всегда рекомендую, вы должны попробовать его, прежде чем использовать его вживую, так что вы понимаете, как это работает. Сигнал входа на рынок похож на другие индикаторы MA, но с этим у вас также есть графический анализ момента, когда тренд найден и динамические уровни, чтобы скорректировать стоп-лосс и получит
FREE
Keltner Channel Indicator Keltner Channel is an oscillator like Bollinger Bands. Keltner Channel is a very good tool to time entries for your strategy. Keltner Channel displays a channel where price is supposed to stay unless we are in overbought or oversold situations. Various strategies use Keltner Channel indicator successfully to spot overbought / oversold situations and look for reversals. Keltner Channel indicator uses ATR to determine overbought and oversold situations. Inputs of the indi
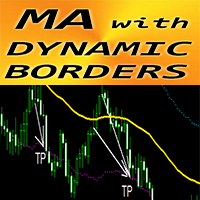
Индикатор Crypto_Forex "Скользящая средняя с динамическими границами" для MT4. - Индикатор имеет уникальную функцию, связанную со скользящей средней - Динамические границы волатильности. - Динамические границы волатильности используют для расчета значения Среднего истинного диапазона. - Этот индикатор отлично подходит для определения цели TakeProfit и размещения SL на пограничных линиях. - Индикатор также отлично сочетается с записями Price Action. // Отличные торговые роботы и индикаторы дос
Sign of victory - это новый индикатор на трех цифровых фильтрах. Индикатор строит в отдельном окне три гистограммы, а также рисует стрелку на ценовом графике. Каждая гистограмма это цифровой фильтр, который преобразует котировки и раскладывает их на тенденции: покупка или продажа. На скриншотах вы можете видеть примеры открытия сделок по данному индикатору, они отмечены стрелками. Данный индикатор поможет трейдерам лучше оценить состояние рынка. Особенности Sign of victory Индикатор прекрасно п
Strong Levels
Mahmoud Helmy Sedik Mohamed Mansour
One of the most popular methods in technical analysis used by both institutional and retail traders is determining the resistance and support levels using the so-called Pivot Point, which in turn is the starting point when defining market sentiment as bullish or bearish. Resistance and support levels are distinguished for their ability to limit the appreciation/depreciation of a certain asset. The most-commonly used technical tools for determining resistance/support levels include: prior tops/bo
Scalping channel   - индикатор направления движения цены. Куда смотрит канал - туда движется цена. Когда канал смотрит вниз, а цена находится вверху канала - открываем сделку на продажу. Когда канал смотрит вверх, а цена находится внизу канала - открываем сделку на покупку. Это простая скальпинговая стратегия для торговли внутри дня, на таймфреймах M1, M5, M15, M30.  Каждый кто купит этот индикатор, получит в подарок робота скальпера, который торгует по этому индикатору автоматически.  Если тор
Advanced Trend Breaker Free Dashboard!!!   Advanced Trend Breaker DashBoard: https://www.mql5.com/en/market/product/66336   Breaker's smart algorithm detects the trend,Support and resistance, filters out market noise and find entry signals!!! Test the demo version and explore its features, it would be useful tool added to your trading arsenal. Do not foget down load Free DashBoard!!!   Advanced Trend Breaker DashBoard !!! Advantages You Get Easy, visual and effective trend detection. Support an
Индикатор сильных уровней. Обычно, цена либо отскакивает от них или мощно пробивает сильным движением. Также, часто в районах таких уровней цена переходит в боковое движения, набирая силу перед новым импульсом. Настройки: Timeframe - Выбор таймфрейма; TopColor - Цвет зон поддержки; BotColor - Цвет зон сопротивления; Price_mark - Цвет ценовых меток; Price_Width - Размер ценовых меток.
С этим продуктом покупают
Gann Made Easy - это профессиональная, но при этом очень простая в применении Форекс система, основанная на лучших принципах торговли по методам господина У.Д. Ганна. Индикатор дает точные BUY/SELL сигналы, включающие в себя уровни Stop Loss и Take Profit. Пожалуйста, напишите мне после покупки! Я поделюсь своими рекомендациями по использованию индикатора. Также вас ждет отличный бонусный индикатор в подарок! Вероятно вы уже не раз слышали о торговли по методам Ганна. Как правило теория Ганна от
Gold Stuff
Vasiliy Strukov
4.86 (253)
Gold Stuff - трендовый индикатор, разработанный специально для золота, также может использоваться на любых финансовых инструментах. Индикатор не перерисовывается и не запаздывает. Рекомендуемый тайм-фрейм H1.  По данному индикатору написан советник EA Gold Stuff, Вы можете найти его в моем профиле. Свяжитесь со мной сразу после покупки для получения   персонального бонуса!  Вы можете получить бесплатную копию нашего индикатора Strong Support and Trend Scanner, пожалуйста, в личку. мне! Настройки
Внутридневная стратегия, основанная на двух фундаментальных принципах рынка. В основе алгоритма лежит анализ объемов и ценовых волн с применением дополнительных фильтров. Интеллектуальный алгоритм индикатора дает сигнал только тогда, когда два рыночных фактора объединяются в одно целое. Индикатор рассчитывает волны определенного диапазона, а уже для подтверждения волны индикатор использует анализ по объемам. Данный индикатор - это готовая торговая система. Все что нужно от трейдера - следовать с
Dynamic Forex28 Navigator — инструмент для торговли на рынке Форекс нового поколения. В НАСТОЯЩЕЕ ВРЕМЯ СКИДКА 49%. Dynamic Forex28 Navigator — это эволюция наших популярных индикаторов, объединяющая мощь трех в одном: Advanced Currency Strength28 Indicator (695 отзывов) + Advanced Currency IMPULSE with ALERT (520 отзывов) + CS28 Combo Signals (бонус). Подробности об индикаторе https://www.mql5.com/en/blogs/post/758844 Что предлагает индикатор Strength нового поколения?  Все, что вам нравило
Представляю Вам отличный технический индикатор GRABBER, который работает, как готовая торговая стратегия "Все включено"! В одном программном коде интегрированы мощные инструменты для технического анализа рынка, торговые сигналы (стрелки), функции алертов и Push уведомлений.  Каждый покупатель этого индикатора получает дополнительно БЕСПЛАТНО:  Grabber Утилиту для автоматического управления открытыми ордерами, Пошаговый видео-мануал : как установить, настроить и торговать, Авторские сет-файлы для
В настоящее время скидка 20%! Лучшее решение для новичка или трейдера-эксперта! Эта приборная панель работает на 28 валютных парах. Он основан на 2 наших основных индикаторах (Advanced Currency Strength 28 и Advanced Currency Impulse). Он дает отличный обзор всего рынка Forex. Он показывает значения Advanced Currency Strength, скорость движения валюты и сигналы для 28 пар Forex на всех (9) таймфреймах. Представьте, как улучшится ваша торговля, когда вы сможете наблюдать за всем рынком с помощ
Инновационный индикатор, использующий эксклюзивный алгоритм для быстрого и точного определения тренда. Индикатор автоматически рассчитывает время открытия и закрытия позиций, а также подробную статистику работы индикатора на заданном отрезке истории, что позволяет выбрать наилучший торговый инструмент для торговли. Вы также можете подключить свои пользовательские стрелочные индикаторы к Scalper Inside Pro для проверки и расчета их статистики и прибыльности. Инструкция и настройки: Читать... Осно
After your purchase, feel free to contact me for more details on how to receive a bonus indicator called VFI, which pairs perfectly with Easy Breakout for enhanced confluence!   Easy Breakout is a powerful price action trading system built on one of the most popular and widely trusted strategies among traders: the Breakout strategy ! This indicator delivers crystal-clear Buy and Sell signals based on breakouts from key support and resistance zones. Unlike typical breakout indicators, it levera
Scalper Vault — это профессиональная торговая система, которая дает вам все необходимое для успешного скальпинга. Этот индикатор представляет собой полную торговую систему, которую могут использовать трейдеры форекс и бинарных опционов. Рекомендуемый тайм фрейм М5. Система дает точные стрелочные сигналы в направлении тренда. Она также предоставляет вам сигналы выхода и рассчитывает рыночные уровни Ганна. Индикатор дает все типы оповещений, включая PUSH-уведомления. Пожалуйста, напишите мне после
Apollo Secret Trend — это профессиональный индикатор тренда, который можно использовать для поиска трендов на любой паре и тайм фрейме. Индикатор может легко стать вашим основным торговым индикатором, который вы можете использовать для определения рыночных тенденций, независимо от того, какую пару или временной интервал вы предпочитаете торговать. Используя специальный параметр в индикаторе, вы можете адаптировать сигналы к своему личному стилю торговли. Индикатор предоставляет все типы оповещен
Enigmera
Ivan Stefanov
5 (7)
ENIGMERA: Основы рынка Важно: демо-версия на MQL5.com работает в Strategy Tester и может не полностью отображать функциональность Enigmera. Ознакомьтесь с описанием, скриншотами и видео для подробной информации. Не стесняйтесь обращаться с вопросами! Код индикатора был полностью переписан. Версия 3.0 добавляет новые функции и устраняет ошибки, накопившиеся с момента появления индикатора. Введение Этот индикатор и торговая система представляет собой уникальный подход к финансовым рынкам. ENIGMER
Trend Screener
STE S.S.COMPANY
4.78 (93)
Индикатор тренда, революционное уникальное решение для торговли и фильтрации тренда со всеми важными функциями тренда, встроенными в один инструмент! Это 100% неперерисовывающийся мультитаймфреймный и мультивалютный индикатор, который можно использовать на всех инструментах/инструментах: форекс, товары, криптовалюты, индексы, акции. ПРЕДЛОЖЕНИЕ ОГРАНИЧЕННОГО ВРЕМЕНИ: Индикатор скринера поддержки и сопротивления доступен всего за 50$ и бессрочно. (Изначальная цена 250$) (предложение продлено) Tre
FX Volume
Daniel Stein
4.59 (34)
FX Volume: Оцените подлинную динамику рынка глазами брокера Краткий обзор Хотите вывести свою торговлю на новый уровень? FX Volume дает вам информацию в реальном времени о том, как розничные трейдеры и брокеры распределяют свои позиции — задолго до появления запаздывающих отчетов типа COT. Независимо от того, стремитесь ли вы к стабильной прибыли или ищете дополнительное преимущество на рынке, FX Volume поможет выявлять крупные дисбалансы, подтверждать пробои и совершенствовать управление риск
Lux Trend
Mohamed Hassan
5 (3)
After purchase, please contact me to get your trading tips + more information for a great bonus!   Lux Trend is a professional strategy based on using Higher Highs and Lower Highs to identify and draw Trendline Breakouts! Lux Trend  utilizes two Moving Averages to confirm the overall trend direction before scanning the market for high-quality breakout opportunities, ensuring more accurate and reliable trade signals. This is a proven trading system used by real traders worldwide, demonstrating
TPSproTREND PrO
Roman Podpora
4.68 (25)
VERSION MT5        —        ИНСТРУКЦИЯ RUS           —        INSTRUCTIONS  ENG Основные функции: Точные сигналы на вход БЕЗ ПЕРЕРИСОВКИ! Если сигнал появился, он остается актуальным! Это важное отличие от индикаторов с перерисовкой, которые могут предоставить сигнал, а затем изменить его, что может привести к потере средств на депозите. Теперь вы сможете входить в рынок с большей вероятностью и точностью. Также есть функция окрашивания свечей после появления стрелки до достижения цели (take
FX Power: Анализируйте силу валют для более эффективной торговли Обзор FX Power — это ваш незаменимый инструмент для понимания реальной силы валют и золота в любых рыночных условиях. Определяя сильные валюты для покупки и слабые для продажи, FX Power упрощает принятие торговых решений и выявляет высоковероятные возможности. Независимо от того, хотите ли вы следовать за трендами или предсказывать развороты с использованием экстремальных значений дельты, этот инструмент идеально адаптируется под
Golden Trend Indicator
Noha Mohamed Fathy Younes Badr
4.9 (10)
Golden Trend indicator  is The best indicator for predicting trend movement this indicator never lags and never repaints and never back paints    and give  arrow buy and sell    before the candle appear  and it will help you and  will make your trading decisions clearer its work on all currencies and  gold and crypto and all time frame This unique  indicator uses very secret algorithms to catch the  trends, so you can trade using this indicator and see the trend clear on charts  manual guide and
PUMPING STATION – Ваша персональная стратегия "всё включено" Представляем PUMPING STATION — революционный индикатор Forex, который превратит вашу торговлю в увлекательный и эффективный процесс! Это не просто помощник, а полноценная торговая система с мощными алгоритмами, которые помогут вам начать торговать более стабильно! При покупке этого продукта вы БЕСПЛАТНО получаете: Эксклюзивные Set-файлы: Для автоматической настройки и максимальной эффективности. Пошаговое видео-руководство: Научитесь т
- Real price is 80$ - 40% Discount (It is 49$ now) - Lifetime update free Contact me for instruction, add group and any questions! Related Products:  Bitcoin Expert , Gold Expert - Non-repaint - I just sell my products in Elif Kaya profile, any other websites are stolen old versions, So no any new updates or support. Introduction The breakout and retest strategy is traded support and resistance levels. it involves price breaking through a previous level.  The break and retest strategy is design
Важным ключевым элементом в трейдинге являются зоны или уровни, от которых принимаются решения о покупке или продаже торгового инструмента. Несмотря на попытки крупных игроков скрыть свое присутствие на рынке, они неизбежно оставляют следы. Наша задача заключалась в том, чтобы научиться находить эти следы и правильно их интерпретировать. ИНСТРУКЦИЯ RUS       INSTRUCTIONS  ENG        Рекомендуем использовать с индикатором -  TPSpro  TREND PRO -  Version MT5 Основные функции: Отображения активных
Volatility Trend System - торговая система дающая сигналы для входов.  Система волатильности дает линейные и точечные сигналы в направлении тренда, а также сигналы выхода из него, без перерисовки и запаздываний. Трендовый индикатор следит за направлением среднесрочной тенденции, показывает направление и ее изменение. Сигнальный индикатор основан на изменении волатильности, показывает входы в рынок. Индикатор снабжен несколькими типами оповещений. Может применяться к различным торговым инструмен
Gold Venamax – это лучший биржевой технический индикатор. Алгоритм индикатора анализирует движение цены актива и отражает волатильность и потенциальные зоны для входа. Особенности индикатора: Это супер индикатор с Magic и двумя Блоками трендовых стрелочников для комфортной и профитной торговли. Красная Кнопка переключения по блокам выведена на график. Magic задается в настройках индикатора, так чтобы можно было установить индикатор на два графика с отображением разных Блоков. Gold Venamax можно
Introduction to X3 Chart Pattern Scanner X3 Cherart Pattern Scanner is the non-repainting and non-lagging indicator detecting X3 chart patterns including Harmonic pattern, Elliott Wave pattern, X3 patterns, and Japanese Candlestick patterns. Historical patterns match with signal patterns. Hence, you can readily develop the solid trading strategy in your chart. More importantly, this superb pattern scanner can detect the optimal pattern of its kind. In addition, you can switch on and off individu
[ MT5 Version ]  [ Kill Zones ]  [ SMT Divergences ] How to trade using Order Blocks:  Click here User Interface Performance:  During testing in the strategy tester, the UI may experience lag. Rest assured, this issue is specific to the testing environment and does not affect the indicator's performance in live trading. Elevate your trading strategy with the  Order Blocks ICT Multi TF  indicator, a cutting-edge tool designed to enhance your trading decisions through advanced order block analys
Gold Trend – хороший биржевой технический индикатор. Алгоритм индикатора анализирует движение цены актива и отражает волатильность и потенциальные зоны для входа. Самые лучшие сигналы индикатора: Для SELL = красная гистограмма + красный указатель SHORT + желтая сигнальная стрелка в этом же направлении. Для BUY = синяя гистограмма + синий указатель LONG + аква сигнальная стрелка в этом же направлении. Преимущества индикатора: И ндикатора выдает сигналы с высокой точностью. Подтвержденный сигнал
Персональная реализация Order Blocks, простой, но эффективной стратегии позиционной торговли. Трейдер должен войти в рынок или искать сделки в направлении последнего блока ордеров, если ценовой диапазон не был нарушен в направлении, противоположном прорыву. Открытые блоки для наглядности не прорисовываются. [ Руководство по установке | Руководство по обновлению | Устранение неполадок | FAQ | Все продукты ] Бычий открытый блок - это первый бычий бар после нового рыночного минимума. Медвежий откр
Volume Break Oscillator — это индикатор, который сопоставляет движение цены с тенденциями объема в форме осциллятора. Я хотел интегрировать анализ объема в свои стратегии, но меня всегда разочаровывали большинство индикаторов объема, таких как OBV, Money Flow Index, A/D, а также Volume Weighted Macd и многие другие. Поэтому я написал этот индикатор для себя, я доволен его полезностью, и поэтому я решил опубликовать его на рынке. Основные характеристики: Он выделяет фазы, в которых цена движе
Этот индикатор делает скальпинг простым и 100% интуитивным. Candle Probability Scalper покажет тебе в один миг проценты силы покупателей и продавцов в РЕАЛЬНОМ ВРЕМЯ , на текущей свече. Проценты обновляются на каждом тике, что значит, что с каждой секундой ты будешь знать, что делает большинство участников, без каких-либо задержек. Это поможет тебе в определении силы каждой стороны и, соответственно, куда может поденоться цена. Вот простая инструкция по использованию: 1. Посмотри на проценты по
Special offer : ALL TOOLS , just $35 each! New tools   will be   $30   for the   first week   or the   first 3 purchases !  Trading Tools Channel on MQL5 : Join my MQL5 channel to update the latest news from me Volumatic VIDYA (Variable Index Dynamic Average) — это продвинутый индикатор, предназначенный для отслеживания трендов и анализа давления покупок и продаж в каждой фазе тренда. Используя Variable Index Dynamic Average как основную технику динамического сглаживания, этот инструмент предос
PRO Renko System - это высокоточная система торговли на графиках RENKO. Система универсальна. Данная торговая система может применяться к различным торговым инструментам. Система эффективно нейтрализует так называемый рыночный шум, открывая доступ к точным разворотным сигналам. Индикатор прост в использовании и имеет лишь один параметр, отвечающий за генерацию сигналов. Вы легко можете адаптировать алгоритм к интересующему вас торговому инструменту и размеру ренко бара. Всем покупателям с удовол
Другие продукты этого автора
Buy Sell Zones   Simple indicator for BUY / Sell Zones moving Buy and Sell zones : Closest zone is wide and clear : Red for Sell zone , Green for Buy zone >>> old far zones are in bold lines :::BUY Zones (GREEN) appear only in UP Trend and disappear in DOWN Trend :::SELL Zones (RED) appear only in DOWN Trend and disappear in UP Trend input parameters ::: index bars : bars range for zone calculation levels : number of zones  Up move/Down move arrows mail and message Alerts !! used on any symbol u
Smart and simple Indicator based on wolves waves reversal pattern also near to falling and rising wedge and butterfly patterns with Stoploss and entry signal preferred time frame M30 : with parameters bars count used for calculation = 200 and moving average for accuracy = 100; you can try it for other higher or lower parameters and try your own set of inputs higher timeframe = lower input !!! important note ::: Indicator don't back draw when first installed on Chart  once installed wait for new
Simple indicator for BUY / Sell Zones moving Buy and Sell zones : Closest zone is wide and clear : Red for Sell zone , Green for Buy zone >>> old far zones are in bold lines :::BUY Zones (GREEN) appear only in UP Trend and disappear in DOWN Trend :::SELL Zones (RED) appear only in DOWN Trend and disappear in UP Trend input parameters ::: index bars : bars range for zone calculation levels : number of zones  Up move/Down move arrows mail and message Alerts !! used on any symbol used on any timefr
Price Predictor is an indicator that shows precise price reversals taking into account a higher time frame and a lower time frame candle patterns calculations it is great for scalping and swing trading  . Buy and sell arrows are shown on the chart as for entry signals.  BIG Arrows indicates the trend - SMALL Arrows signal a trade (BUY/SELL)   - A Green BIG UP Arrow with a support green line indicates a Bull Market : wait for buy signal       - A Green SMALL Up Arrow after a BIG green arrow is
Crazy Dancing moving RES/SUP Levels Automatic redrawing of moving Supports and resistances levels  to indicate price breaking supports (signal SELL)  or breaking resistance levels (signal BUY) Very simple appearing indicator but very clever and smart too !!!! Main Inputs: # of bars for the support and resistances levels + the initial shift from start + moving average for filter signaling Smaller values for bars /shift inputs when using Higher Time frames (D1-H4) and the reverse higher values for
SMOOTH STRENGTH METER INDICATOR (SMOOTH LINE) it draws Currencies TREND Volatility Power / Strength lines : -       Detects the 2 highly TRENDED Volatile pairs  ( will be the Bold Lines ) - A very Helpful Indicator - It draws smooth lines for up to 20 currencies pairs representing Volatility  strength and power - First it indicates the most powerful trended direction pairs : Strongest / Weaker -       MAIN FUNCTION  :it gives indication of the       UP trend most Volatile Line  and the      DOWN
Automatic redrawing of Trend Supports and resistances levels and Possible Wedge pattern formation to indicate price breaking of Rising Wedge (signal SELL) or price breaking of falling Wedge (signal BUY) Very simple and smart indicator  ALERTS AND MOBILE NOTIFICATIONS availavle !!! you can edit the calculation bars of the bars count for formation of the trend lines and the initial shift from current price  Smaller values for bars /shift inputs when using Higher Time frames (D1-H4) and the reverse
:::: It is programmed to work on any M5 Chat windows !! Used to determine the Strongest currency pairs and the Weakest pairs also detect the peak of deviation of currencies strength  IT CAN BE USED FOR INDICES AND STOCKS TOO !! Strategy one : It can be used in to BUY Strongest pair and SELL Weakest one Strategy two: It can be used on Daily basis to Hedge BUY Strongest pair with high % (ex: +1%) and BUY Weakest one with % lower(ex: -0.7%) the same with SELL  Strategy three: on 3days  or above ca
Auto redrawn Pivot support resistance horizontal lines  with signal of Buy/Sell possibilities with SL level and with trend support resistance lines too used for all symbols and time frames  you can adjust inputs parameters (only 2) and test it on various symbols and time frames input number of bars for calculation and moving average for signal accuracy example : use it on M30 time frame with input 200 for bars count and 100 for MA
A simple Approach to Elliot waves patterns Signal generated on trend continuation when breaking the "5" level or on corrective direction after 1-5 waves detected 1-5 labeled points arrows used for signal UP/DOWN direction Chaotic patterns in Blue are drawn all times until  a 1-5 Elliot wave pattern detected  1-5 Red pattern in Bull Market : UP arrow in BULL trend continuation OR DOWN arrow  as a reversal DOWN direction as pattern correction 1-5 Green pattern in Bear Market :DOWN arrow in BEAR tr
YOU DON'T HAVE TO SHIFT ON ALL TIME FRAMES FOR EACH CURRENCY PAIR TO CONCLUDE ITS TREND AND ITS POWER YOU HAVE IT ALL IN ONE TABLE , 20 CURRENCY PAIR WITH 5 TIME FRAMES ALSO , COMPARE BETWEEN CURRENCIES STRENGTH AND ALERTS THE STRONGER /WEAKER PAIR BASED ON 5 TIMEFRAMES CALCULATIONS The Power meter currencies table is a very helpful tool to indicate the TREND strength of up to 20 currencies pairs  using 5 time frames M5 M30 H1 H4 and D1 ( latest version You SELECT you own 5 timeframes from M1 t
HEDGING  MASTER line indicator    It compares the power/strength lines of two user input symbols and create a SMOOTHED line that indicates the degree of deviation of the 2 symbols Strategy#1- FOLLOW THE INDICATOR THICK LINE when CROSSING O LEVEL DOWN --- TRADE ON INDICATOR THICK LINE (TREND FRIENDLY) !! Strategy#2- TRADE INDICATOR PEAKS (Follow indicator Reversal PEAKS Levels)!! you input - the index of calculation ( 10/20/30....)                 - the indicator Drawing start point (indicator hi
Auto redrawn Pivot support resistance horizontal lines  with signal of Buy/Sell possibilities with SL level and with trend support resistance lines too used for all symbols and time frames  you can adjust inputs parameters (only 2) and test it on various symbols and time frames input number of bars for calculation and moving average for signal accuracy example : use it on M30 time frame with input 200 for bars count and 100 for MA
This Indicator provides Buy/Sell Signal based on calculations on Higher frame (Trend) and Lower frame(Entry signals) * You should select the higher and lower frame for indicator calculations * You select the Trend line colors as you prefer * Enable or disable Alerts! Trend lines UP/Down are drawn when a trend is detected Wait for small arrows for entry : *Normally an UP arrow in an UP Trend is a BUY signal : ---you Close the BUY position IF a Reverse DOWN Trend signal appears Or when Up trend li
Simple moving trend lines with support and resistance moving levels  used on any time frame on any symbols input: # of bars for trend lines (10-20- 50-100-200----) as per your time frame and your strategy  and     moving period ( 10-20 -50-100-200----) as per your time frame and your strategy Direction Arrows : UP and DOWN are drawn when breaking the trend lines ALerts available at Arrows appearance...  
Select from up to 6 Strategies solo or Combine different strategies for signal generation  (Combining more than 2 strategies may LIMIT a lot the number of signals)! ALL From Chart !!! Also Inputs editing from Chart !!! Push your strategy bottom (one strategy) OR Combine signal from as may strategies (up to 6) : Selected and enabled strategies will be in GREEN !!! 1- BUY SELL areas 2- Support resistance break signal 3- Elliot wave continuation /reversal signal 4- Advanced Moving averages 5- Tren
SMOOTH DEVIATION line indicator for 2 symbols   It compares the power/strength lines of two user input symbols and create a SMOOTHED line that indicates the degree of deviation of the 2 symbols Strategy#1- FOLLOW THE INDICATOR THICK LINE when CROSSING O LEVEL DOWN --- TRADE ON INDICATOR THICK LINE (TREND FRIENDLY) !! Strategy#2- TRADE INDICATOR PEAKS (Follow indicator Reversal PEAKS Levels)!! you input - the index of calculation ( 10/20/30....)                 - the indicator Drawing start point
Simple 3 Moving  supports and resistance levels (Your Review /comment and feedback is important  !! Thanks) Signal UP and Down possibilities created on crossing the multi supports/resistance levels supports all time frames Adjusted inputs for area covered for generating the levels and the shifts needed to cover 3 areas supports /resistances levels for example you may use main parameters in M30 time frames: extern int ShiftFromStart=20;  extern int barsCount=20; extern int sequenceShifts=50;  in
Trend Whale
Mohamed yehia Osman
Smart EA based on Trend and Support Resistance Levels with SL results given on EURUSD  H1 for last 10 months IF AUTOLOT enabled: **if LotRisk =1- 3 ---- Profit up to 50%  DD up to 17% **if LotRisk > 5 /10 /20 --- HIGH RISK --- HIGH Profit up to 1600 % or More but High DD up to 40% tested also on other symbols GBPUSD with positive results *** used parameters on H1 timeframe  bars 25  shift 4 ma index 0.85 for lower time frames Inputs will me doubled or tripled ...  for higher time frames inputs
Trend Bar Balance Indicator Simple indicator based on trend detection and support resistance breakage  It detects the major trend and the minor support and resistance levels *** a signal for UP /BUY is detected and alerted in a BULL trend and a resistance level break *** a signal for DOWN /SELL is detected and alerted  in a Bear trend and a support level break THE POWER OF THIS INDICATOR I USE IT WHEN YOU COMBINE ITS DAILY SIGNALS FROM DIFFERENT CHART SYMBOLS AT SAME TIME AND CLOSE ALL ORDERS BY
SYMBOL POWER based on inputted 5 time frames and Compared to 20 Other Symbols !! Great Indicator YOU DON'T HAVE TO SHIFT ON ALL TIME FRAMES FOR EACH CURRENCY PAIR TO CONCLUDE ITS TREND AND ITS POWER YOU HAVE IT ALL IN ONE TABLE , 20 CURRENCY PAIR WITH 5 TIME FRAMES ALSO , COMPARE BETWEEN CURRENCIES STRENGTH AND ALERTS THE STRONGER /WEAKER PAIR BASED ON 5 TIMEFRAMES CALCULATIONS ALEERTS enable /disable using 5 time frames M5 M30 H1 H4 and D1   ( latest version You SELECT you own 5 timeframes from
Automatic redrawing of Trend Supports and resistances levels and Possible Wedge pattern formation to indicate price breaking of Rising Wedge (signal SELL) or price breaking of falling Wedge (signal BUY) Very simple and smart indicator  ALERTS AND MOBILE NOTIFICATIONS availavle !!! you can edit the calculation bars of the bars count for formation of the trend lines and the initial shift from current price  Smaller values for bars /shift inputs when using Higher Time frames (D1-H4) and the reverse
Multi Strategies Single Combined   Select from up to 6 Strategies solo or Combine different strategies for signal generation  (Combining more than 2 strategies may LIMIT a lot the number of signals)! ALL inputs and Strategies selection From Chart !!! Also Inputs editing from Chart !!! Push your strategy bottom (one strategy) OR Combine signal from as may strategies (up to 6) : Selected and enabled strategies will be in GREEN !!! 1- BUY SELL areas 2- Support resistance break signal 3- Elliot wave
Trend Lines Signal   This Indicator provides Buy/Sell Signal based on calculations on Higher frame (Trend) and Lower frame(Entry signals) * You should select the higher and lower frame for indicator calculations * You select the Trend line colors as you prefer * Enable or disable Alerts! Trend lines UP/Down are drawn when a trend is detected Wait for small arrows for entry : *Normally an UP arrow in an UP Trend is a BUY signal : ---you Close the BUY position IF a Reverse DOWN Trend signal appear
Multi Strategies Combined Signal All in One   Multi Strategies Single Combined   Select from up to 6 Strategies solo or Combine different strategies for signal generation  (Combining more than 2 strategies may LIMIT a lot the number of signals)! ALL inputs and Strategies selection From Chart !!! Also Inputs editing from Chart !!! Push your strategy bottom (one strategy) OR Combine signal from as may strategies (up to 6) : Selected and enabled strategies will be in GREEN !!! 1- BUY SELL areas 2-
SYMBOL POWER based on inputted 5 time frames and Compared to 20 Other Symbols !! Great Indicator YOU DON'T HAVE TO SHIFT ON ALL TIME FRAMES FOR EACH CURRENCY PAIR TO CONCLUDE ITS TREND AND ITS POWER YOU HAVE IT ALL IN ONE TABLE , 20 CURRENCY PAIR WITH 5 TIME FRAMES ALSO , COMPARE BETWEEN CURRENCIES STRENGTH AND ALERTS THE STRONGER /WEAKER PAIR BASED ON 5 TIMEFRAMES CALCULATIONS ALEERTS enable /disable using 5 time frames M5 M30 H1 H4 and D1     ( latest version You SELECT you own 5 timeframes fr
TWO SYMBOLS CORRELATION  line indicator    It compares the power/strength lines of two user input symbols and create a SMOOTHED line that indicates the degree of deviation of the 2 symbols Strategy#1- FOLLOW THE INDICATOR THICK LINE when CROSSING O LEVEL DOWN --- TRADE ON INDICATOR THICK LINE (TREND FRIENDLY) !! Strategy#2- TRADE INDICATOR PEAKS (Follow indicator Reversal PEAKS Levels)!! you input - the index of calculation ( 10/20/30....)                 - the indicator Drawing start point (ind
Symbols Strength meter Graph  :::: It is programmed to work on any M5 Chat windows !! Used to determine the Strongest currency pairs and the Weakest pairs also detect the peak of deviation of currencies strength  IT CAN BE USED FOR INDICES AND STOCKS TOO !! Strategy one : It can be used in to BUY Strongest pair and SELL Weakest one Strategy two: It can be used on Daily basis to Hedge BUY Strongest pair with high % (ex: +1%) and BUY Weakest one with % lower(ex: -0.7%) the same with SELL  Strateg
Trend Follower and Reversal Trend handler * EA opens X Lot position (calculated according to Lot risk value) with trend with indicated TP if Trend reversal occurs * EA opens 5 X Lot (if input " Reversal Lot scaling" = 5     ) position with reversal trend with indicated TP and same SL for old trend position * Increasing LOT risk value + Increasing Reversal Lot scaling value = High Risk and High Profit and High DD * Decreasing LOT risk value + Decreasing Reversal Lot scaling = Low Risk and Low Pr
Фильтр:
Нет отзывов
Ответ на отзыв