PointZero

5

Concept

Market arranges in Time upcoming Phases according to the present Results of its Interest.

Directing Modulations are an Interaction of immanent Periods, which show in Reference

  • to Time cyclic Activity and
  • to Price leveling Activity.

PointZero is a projecting Price Mask of this Concept of Time and Price and

  • categorizing developed Price Movements related to their own Range: how far moved ?
  • indicating their Status by marking special Events: when which Action ?
  • setting the Situation in a functional Relation to the presented Support/ Resistance - Motive: miss/ hit/ pass ?


synthesize and project

Arrange with its underlying, grounding Components

  • Time Price Channel
  • Triple Pivot

and its conditional indicating Period Event Notation a situational Coordinate System.


Content

Time Price Channel

The D1/ W1/ MN - Channel consists of Shells around the ranging Center, which reflect the

periodic Alterations by its Separation in High-/Low-Bands and central Moving Averages.


Period Event Notation

Positions, Expansions and Distances are measured against the own Range,

as also against the Channelrange, of which a Period the Body and (Part of) the Move is.

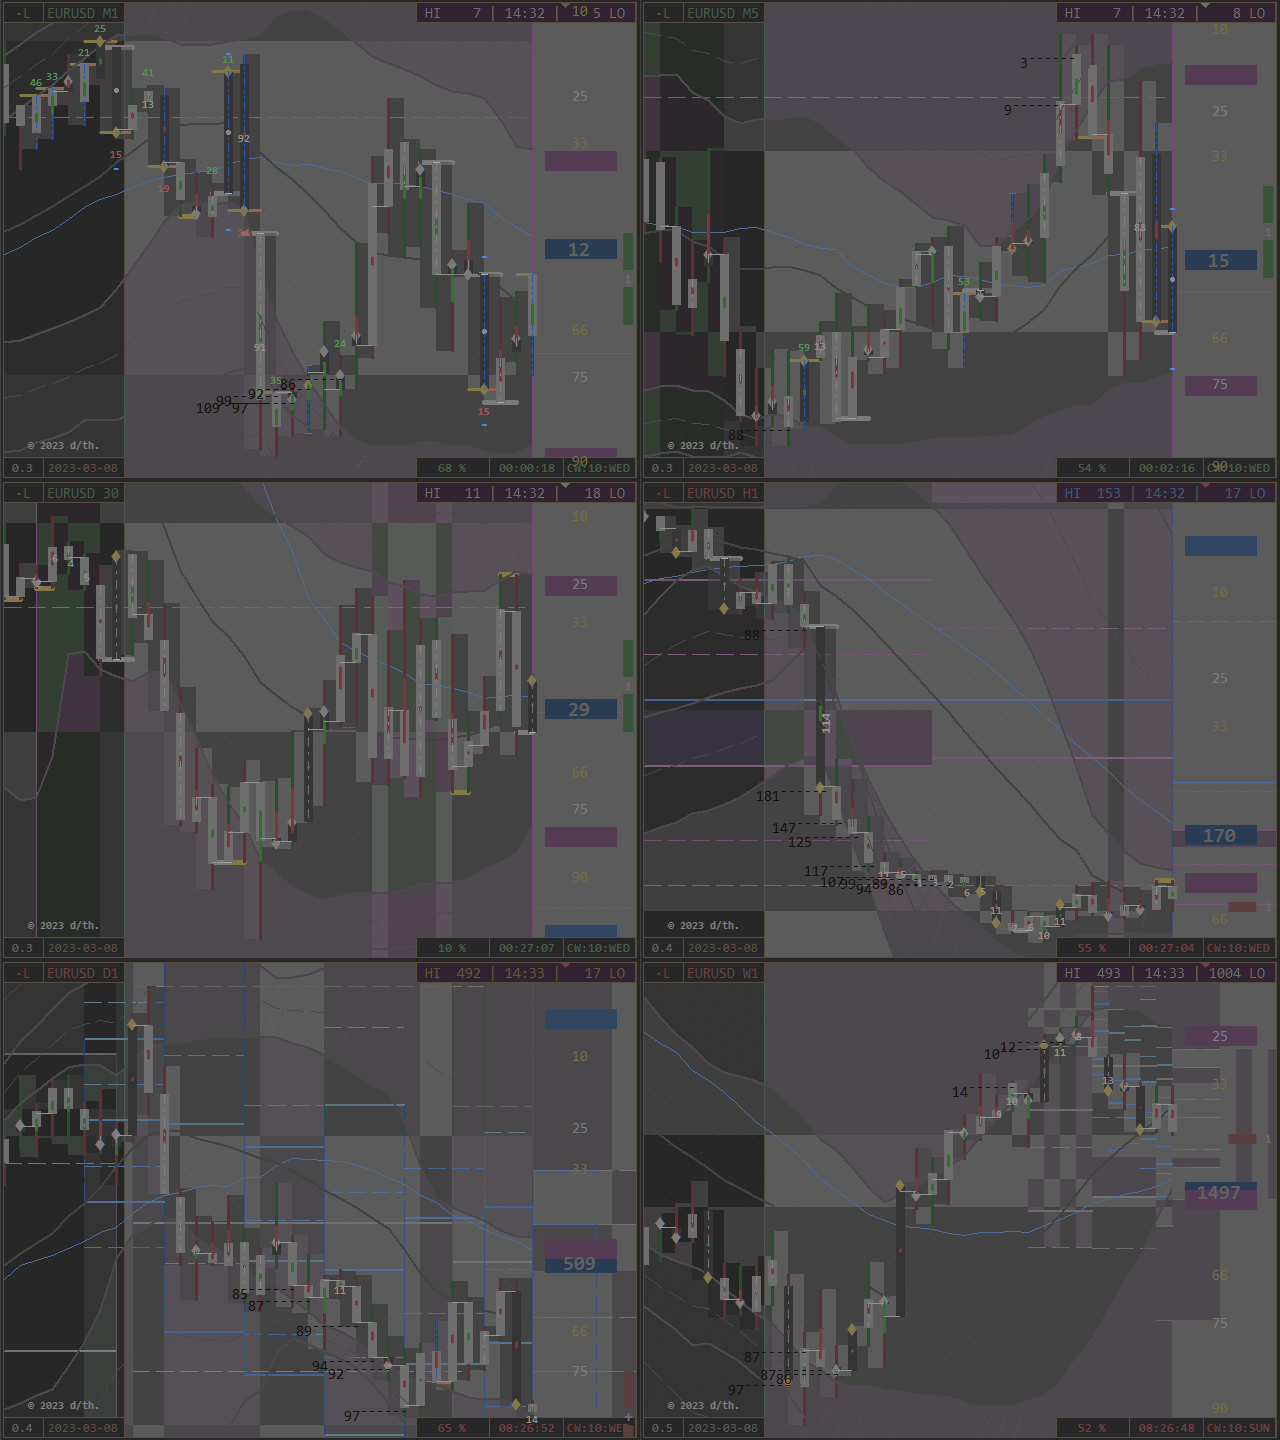
Special Events are displayed:

  • Close/ Open at High/ Low/ Center (colored Notes)
  • Break of weekly Channelbands (as Range Percentage)
  • Move 0 - 100 % of Range: Open to Close = High to Low (blue dotted Trend)
  • Move Proportions (white Values)
  • Offset of Move - Center against Range - Center (central Colortrend)
  • Parity of actual OHLC and previous OHLC (white Trend on Period and Offset Arrows on Scale)
  • Parity of up and down - Wick (blue Stars)
  • limiting Tick Values (Fraction Hits, green/ red)


Pivot Period Ports

D1/ W1/ MN - Pivots create besides their Portlevels a colored Background, indicating cyclic and leveling Phases.


Layers:

  • Projectors, Ranges and Scales (set PointZeros in Relation to their own and to the actual Channelrange)
  • Mirroring of Movements as Bars and Trendlines
  • Coloring of Bands/ Periods
  • Periods on/ off
  • geometrical Chartstructure with Universal Mask


Additional Benefits:

  • a positioning Autofocus
  • a Logbook as directional Protocol
  • a systemic Clock informs about periodic Phases (Pivot and Realtime)
  • a Screenshot Function (Button on Chart and as automatic Interval)
  • a detailed Definition of Objects and Functions by the Descriptive Mode (as Tool Tips)
  • an adjustable Price Column and automatic Chartfitting


Contemplate its Concentrate

The Signal Density is related to Markets actual Phase, chosen Timeframe/ Security and Components.

PointZero generates as resulting Composition a defined Setting of Support and Resistance:

No Matter which Hemisphere: [ Open = Support | Resistance = Close ]


Both look like the Other.

The MindMask resolves the active Status.


A Picture is worth a thousand Words.

Indicative : Colorized : Universal


Please find all necessary Informations to this Product in its Compendium.

Below as Orientation the Extract of the individual Indicator-Adjustments.


Indicator PointZero

Think global - Act local


[VALUE] =

  • Boolean: Button Position on Chart
  • Cn: Corner n0 to 3 (left upper to right lower)
  • Variabledefault Value


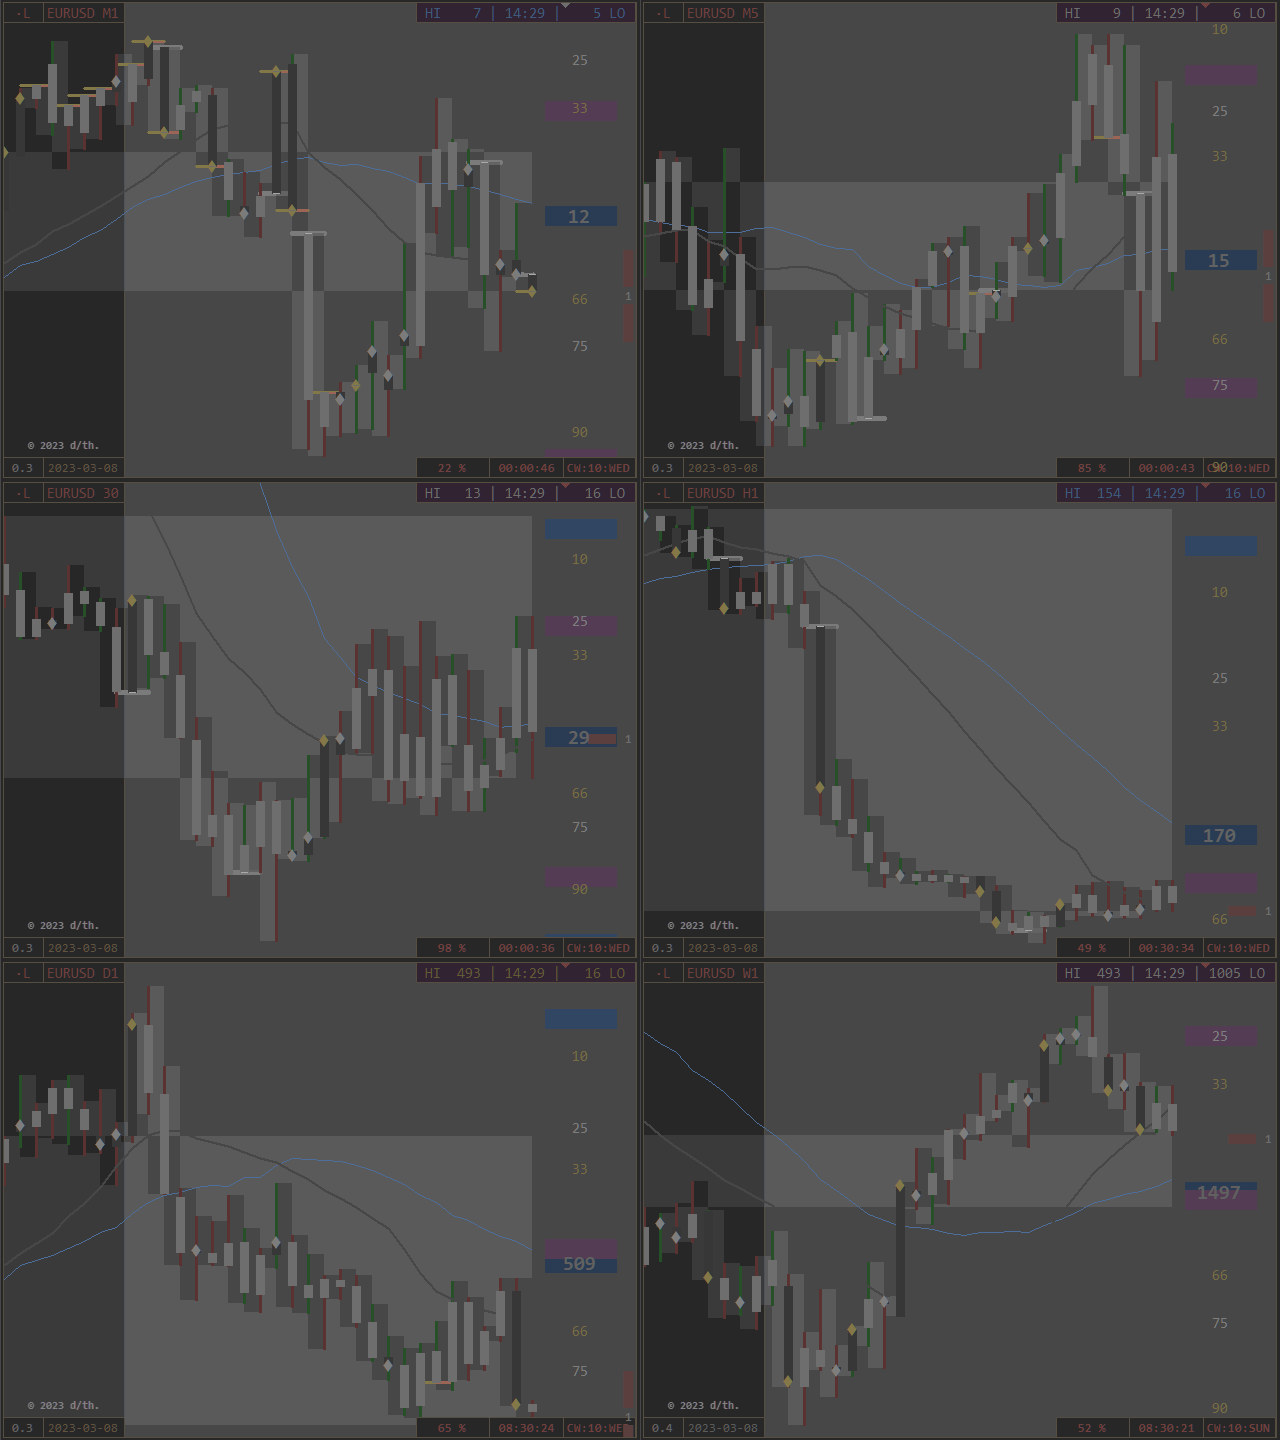
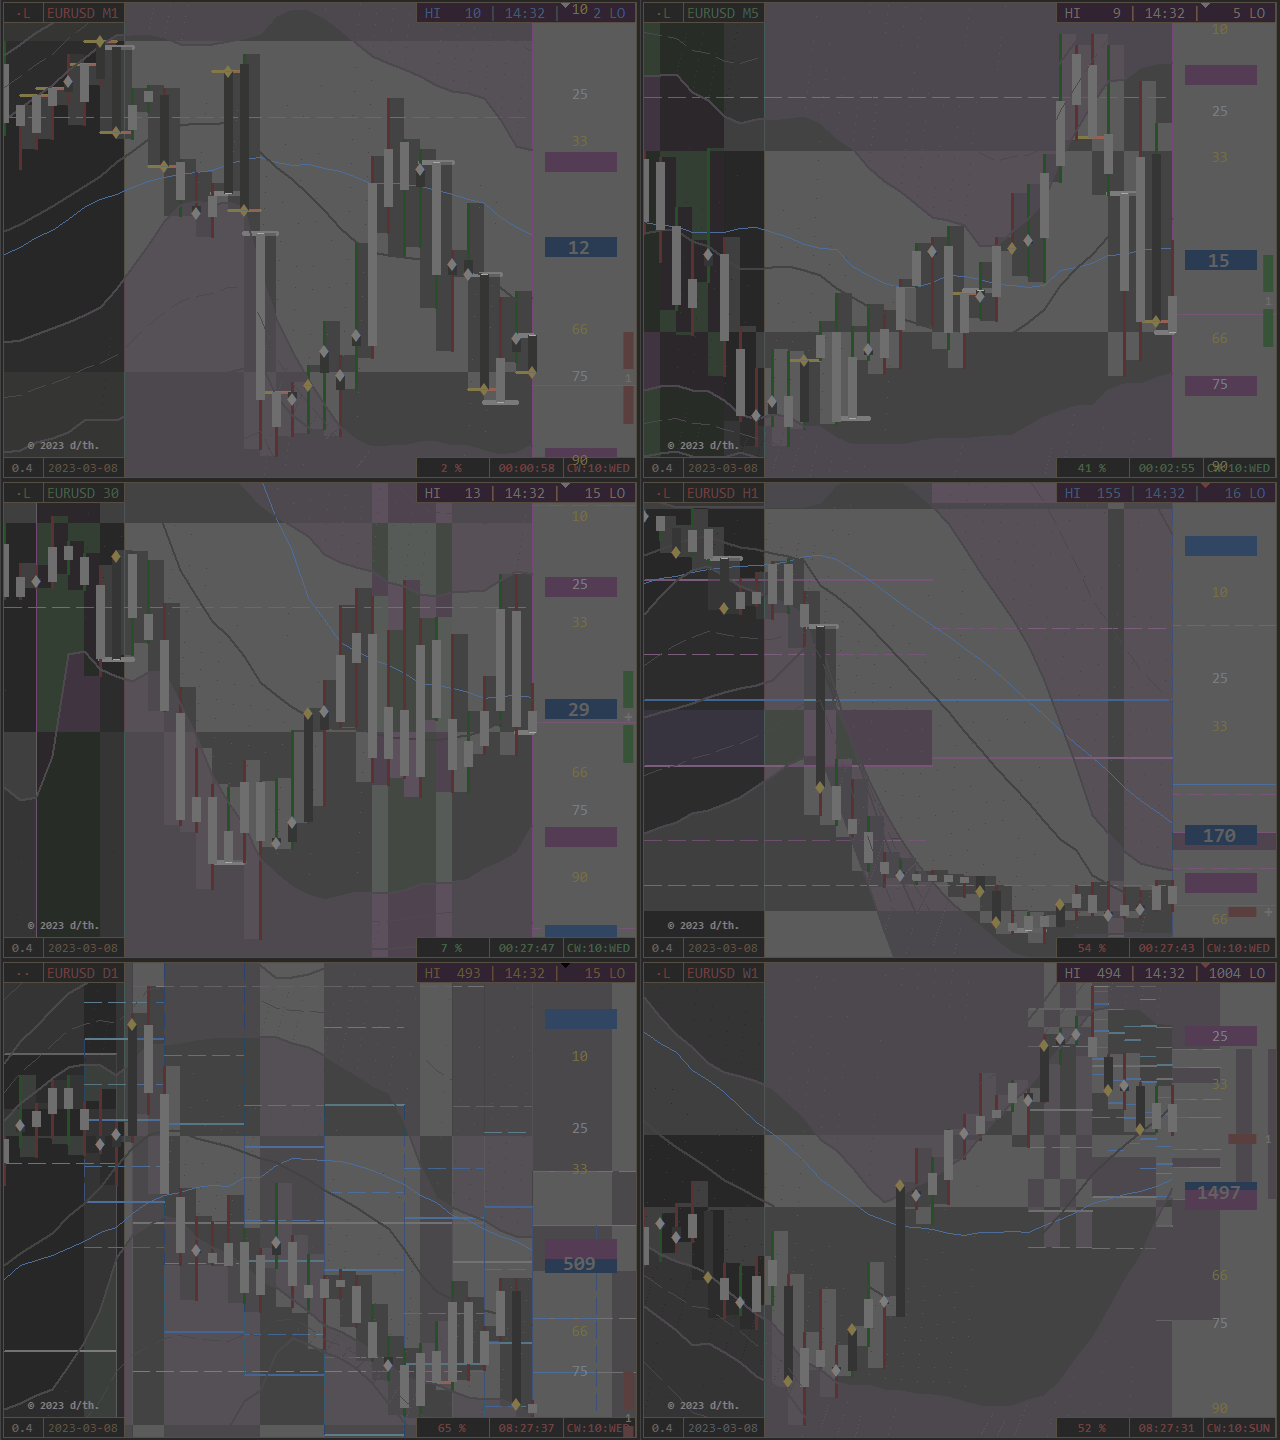
The default View of the Chart consists of following Components and is read like follows:

Move: Trace dark-gray/ Trend bright-gray

works as moving Range and ranging Move.

central MA: daily gray, weekly blue

Range Color by Open: Offset to prior Close/ Open/ Center (conditional)*

Note*: no separate Center-Color, the Open is passed by/of both Directions.

Close Color by Move: Offset to prior Open (= actual)

  • directional on: Null = white/ Full = orange
  • navigational off: up = green/ down = red
  • PointZeros off: noted by a white Haircross,

Toggle Close Signal via Countdown-Button.

Every Period works by its own Range-Shadow with the variable Chart-Coloring.

Identify their Phase by Coloring the Ranges with Button in Corner 3 most right (CW:WD)

Visual of centered Range-Creation and -Filling:
The Chart generates a (mostly central) gray Zone as Spread between

the highest Low and the lowest High of the visible Chart-Periods.


[5.1] Bools (on/ off) 

Code = Logic = Notation of Ordination


[5.1A] Fundament

Body of Chart


The first Options are the framing calculatoric Fundament of any Indicator Processing.

The visual Conjunction of both Mask-Complements delivers accidentially extra Room

for additional Buttons in the Sub-Chart, to have direct Access to these three Core-Options.

Bands and Pivots define the periodic Arrangement,

on which the Pen notes its designing Movements.

The Colors of Channel and Pivots cooperate = they are softened or amplified

and process accordingly to the Color Theory an indicating Background Tone.

The overlaying Period Event Notation is called by variable Conditions and

visualizes the Tracing/ Trending of Bull and Bear in their Habitates/ Hemispheres.


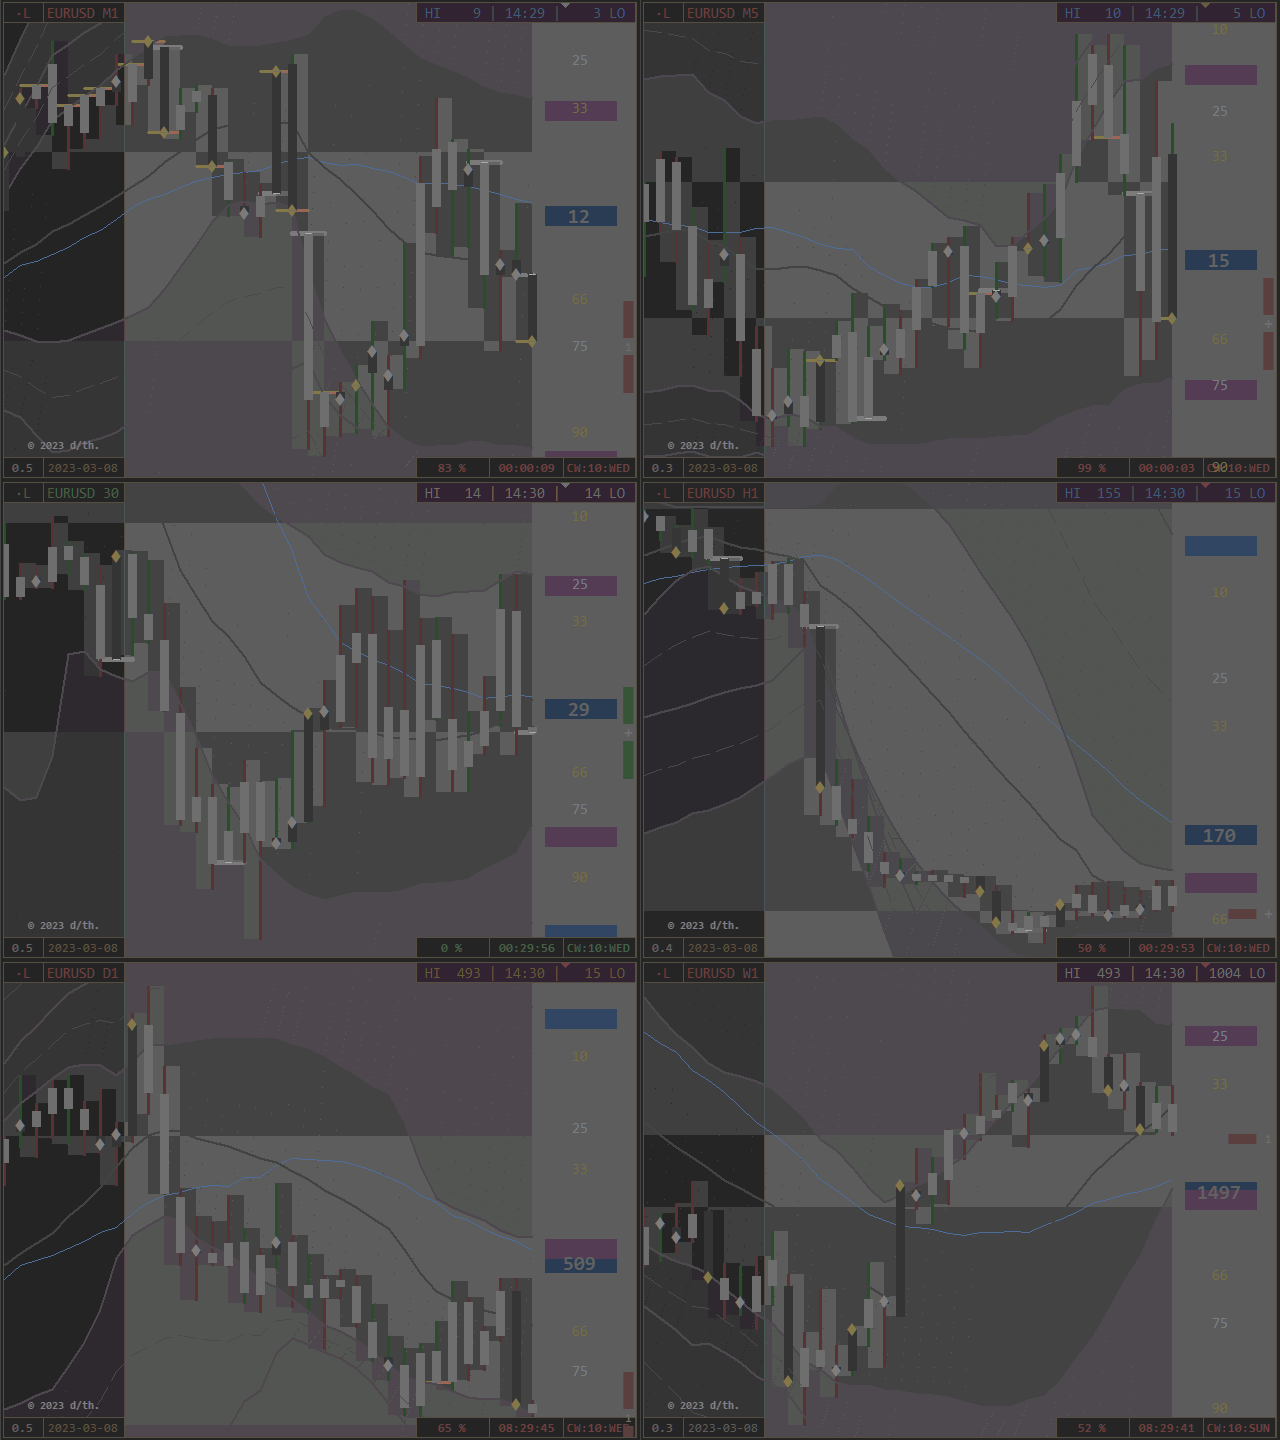
Time Price Channel [SUB]

To identify its Construction fully, colorize its dimmed Trendlines by Countdown-Button [C3]

(or preadjust via Colored Bands in Options).

  • hemispheric = 2 x 50% Coloring Ranges, depicted as colored Shells
  • gray D1, blue W1 Center = 0
  • Shells divided by Center-Trend
  • asymmetric Appearance due to separate Calculations 
  • of High and Low - Bands and central Moving Averages
    • Definition of Moving Average
    • variable Price Line 
    • Price of Time = external Argument
    • Definition of Channel-Band
    • constant Time Line 
    • (ime of Price = internal Argument

3-lettered Abbrevations on Price-Column:

  • Timeframe: MN = M, W1 = W, D1 = D
  • + Position HILO
  • e.g. WLO = Low of W1 - Channel (blue)


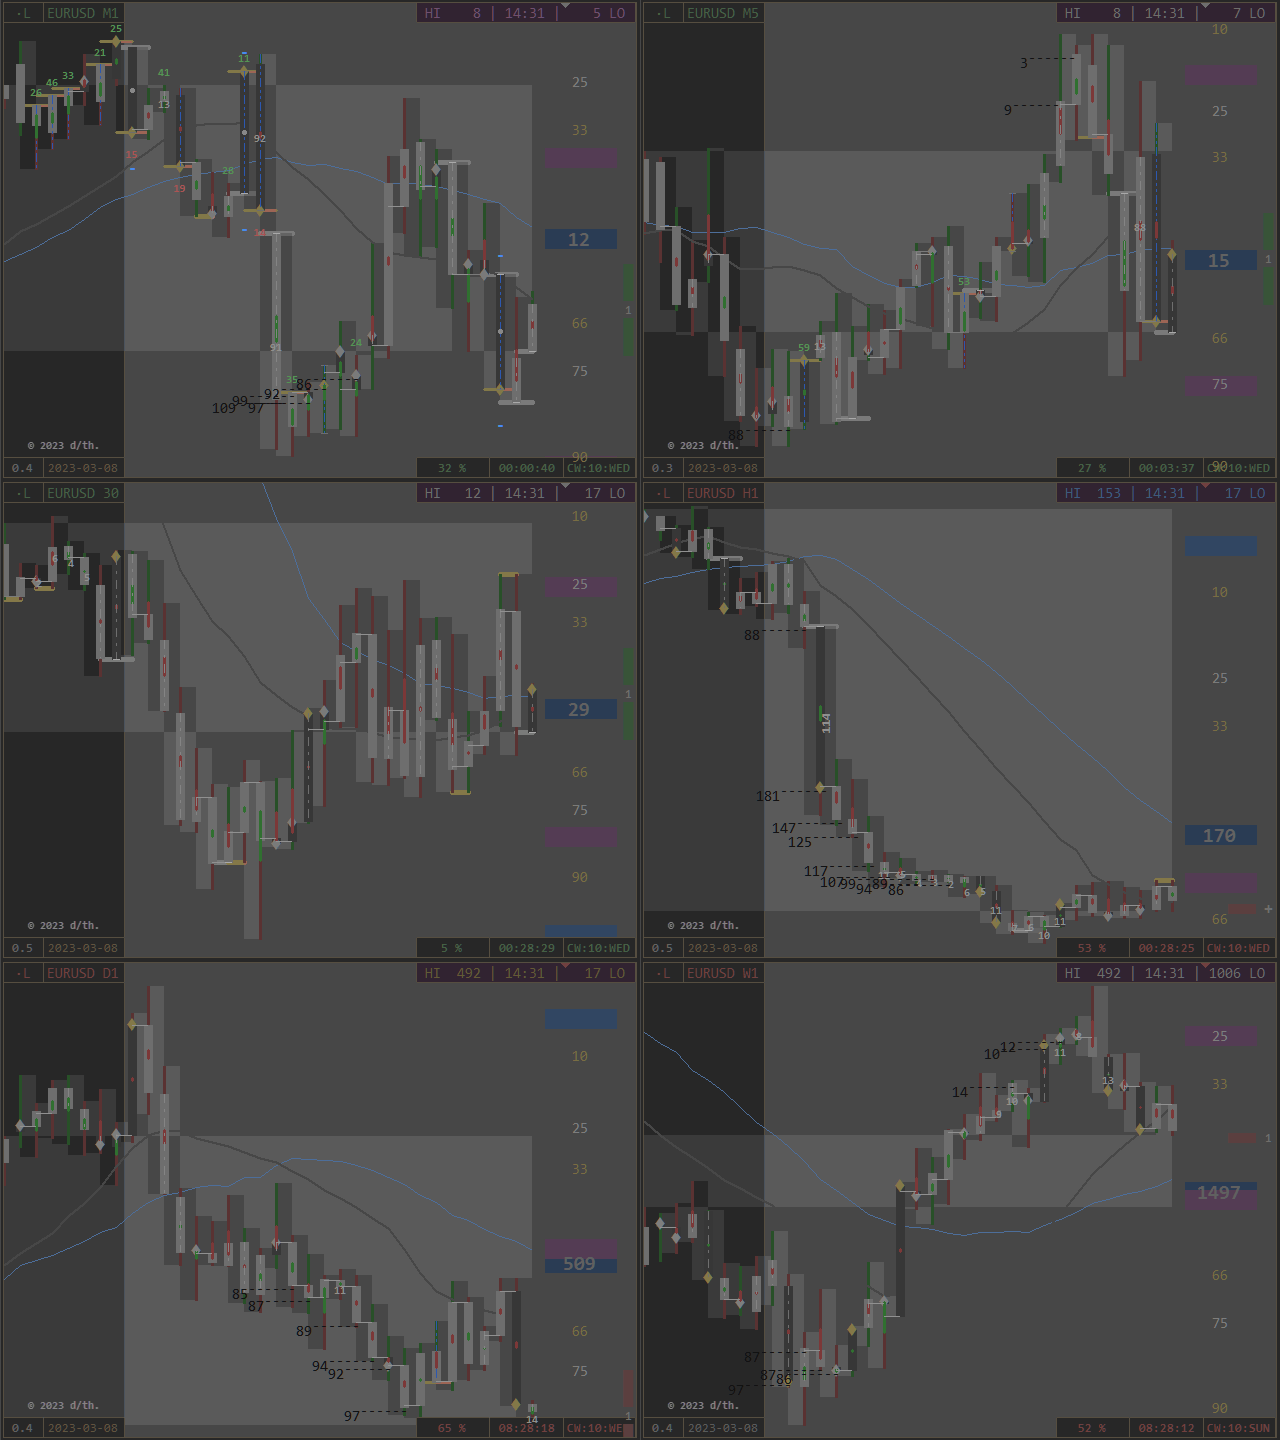
Period Event Notation [SUB]

special Contemplation of conditionally called absolute and/or relative Events:

  • Gator: 0-100 = Zero + Full Move
    • blue dashdot Centertrend on Period
    • notes new Phases (Caution)
  • Range/Move - High/Low (RH/ RL / MH / ML)
    • white move-connecting Trendline on Period
    • notes Stator/ Rotor - Function by Open Position of Period
  • Offset Move-Center against Range-Center 
    • colored Centertrend: green = North, red = South (directional)
    • notes potential/ tendencial Phase Shifts
  • periodic Centers in superordinated Range
    • white Value on Period if Close = 50% and < 15% or > 85% in D1-Range
    • notes near to Edge - Horizons in D1-Channel
  • Values beside Periods (connected with Dashes to Close)
    • if Close beyond W1 - Bands
    • note relative Barriers for overshooting Level-Phases
  • Tick Fraction Hits, as green and red Values
    • calculatoric Base is the Relation of Period Expansion and Volume
    • note expansional Edges of Time/ Price/ Tick
  • bright blue Double Points (Stars)
    • equivalent balanced/ central Position of Move in its Range
    • note Periods, which have an equal Size of their "Wicks"


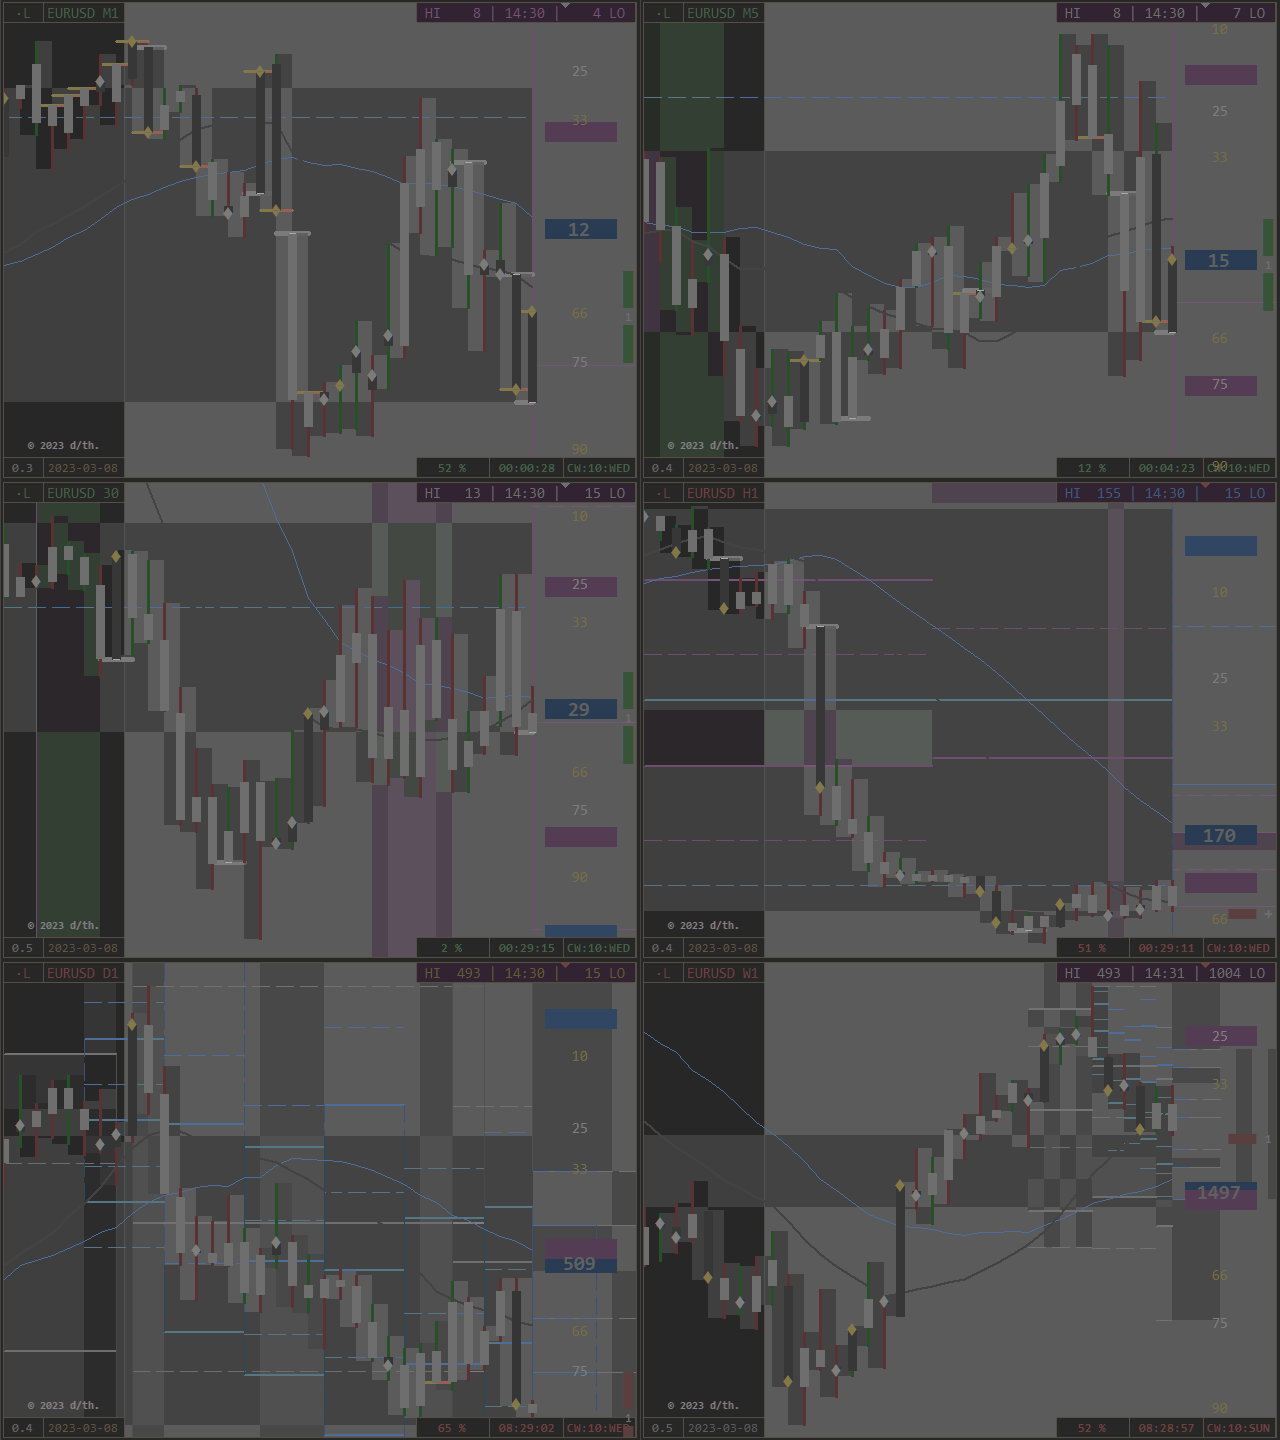
Pivot Period Ports [SUB]

Enjoy freestyle Combinatory for 3 main + 1 sub Pivot ((MN/ W1/ D1) + H4).

universal Standard:

Pivots are processed Period-Gates and describe a superordinated Sequence of Market.
Equipped with cyclic and leveling Zones (colored Background), which note

  • by Time the first, central and last 10% of the Cycle Range 
  • (Visibility timeframe-dependent, adjust accordingly if necessary)
  • by Price the 66-75% of North and South Level-Range 
  • (Visibility chartscale-dependent, use implemented Autofocus if needed)
3-lettered Abbrevations on Price-Column:
  • Timeframe: MN = M, W1 = W, D1 = D, (H4 = H)
  • + Direction (N, S)
  • + Level (1, 2, 3)
  • or Pivot (PP)
  • e.g. MN1 = Monthly Pivot (white) Level 1 in Northern Hemisphere
Due to the inequal Hours of a Real-Time Week related to respective Weekdays

(last two Hours of Friday are processed on Sunday)

  • additional and isolated Sunday-Pivot.


Functions

Being develops from Within.

Equal Interest is generic.


The next five Options are Instruments for an extended Chart-Appearance and flexible Functionality:

[PRICE] Auto Focus:

Visual Flexibility, automatic

  • toggle by Click on the Price-Column (most right)
  • calculates the Chart-Dimensions related to the actual Move-Development
    • creates Room on active Hemisphere
    • more Range if Trend/ more Move if Trace
    • Sensitivity indicates upcoming Activity (Work on Tipping-Points)
  • situative fluid Chart Impression (Scalation of developing Range = relative)


[SCALE] 2 x Period (Range + Move):

Visual Flexibility, manual

Isolate Range and Move by Click-through:

  • toggle by Click on the Scale-Column (2nd right)
  • first Click = minus Move, shows blank Period-Range
  • second Click = toggles Range and Move, shows blank Period-Moves
  • third Click = all back

Not intended for Live-Use and, to avoid Mis-Clicks not accessible of the Chart, but via Options-Menu:
switch Periods completely off with both Options false => complete free view.

All Layers stay functional.


[PROJECTOR - TOPProtocol Role:

Data Divisioning, Sentence

The Protocol of periodical Events can be set to Autostart for sufficient wide charts.

Chart-Auto-Scroll has to be active.

According to the Chart-Concept it is divided in componental Columns of TOHLCV,
inclusive full Legend via Tooltip.

From left to right:

  • Period Time/special Occurrences
  • positioning Range Open Side
  • central periodic Function (two Roles)
  • navigating Move Close Side
  • Period Volume/special Occurrences
  • switch on/ off (completely) on Chart via Projector - Button
  • leave with staying Panel as Placeholder by direct Click on the List
The Placeholder-Panel is generally accessible by direct Click on it (most left Column).
It is in flat Markets potentially supportive for the Resolution, because MT-Scale-Calculations

are situatively adjusted by Reduction of Periods (optional in Conjunction with Autofocus).


[REFLECTOR - BOTUniversal Mask:

Data Divisioning, Sequence

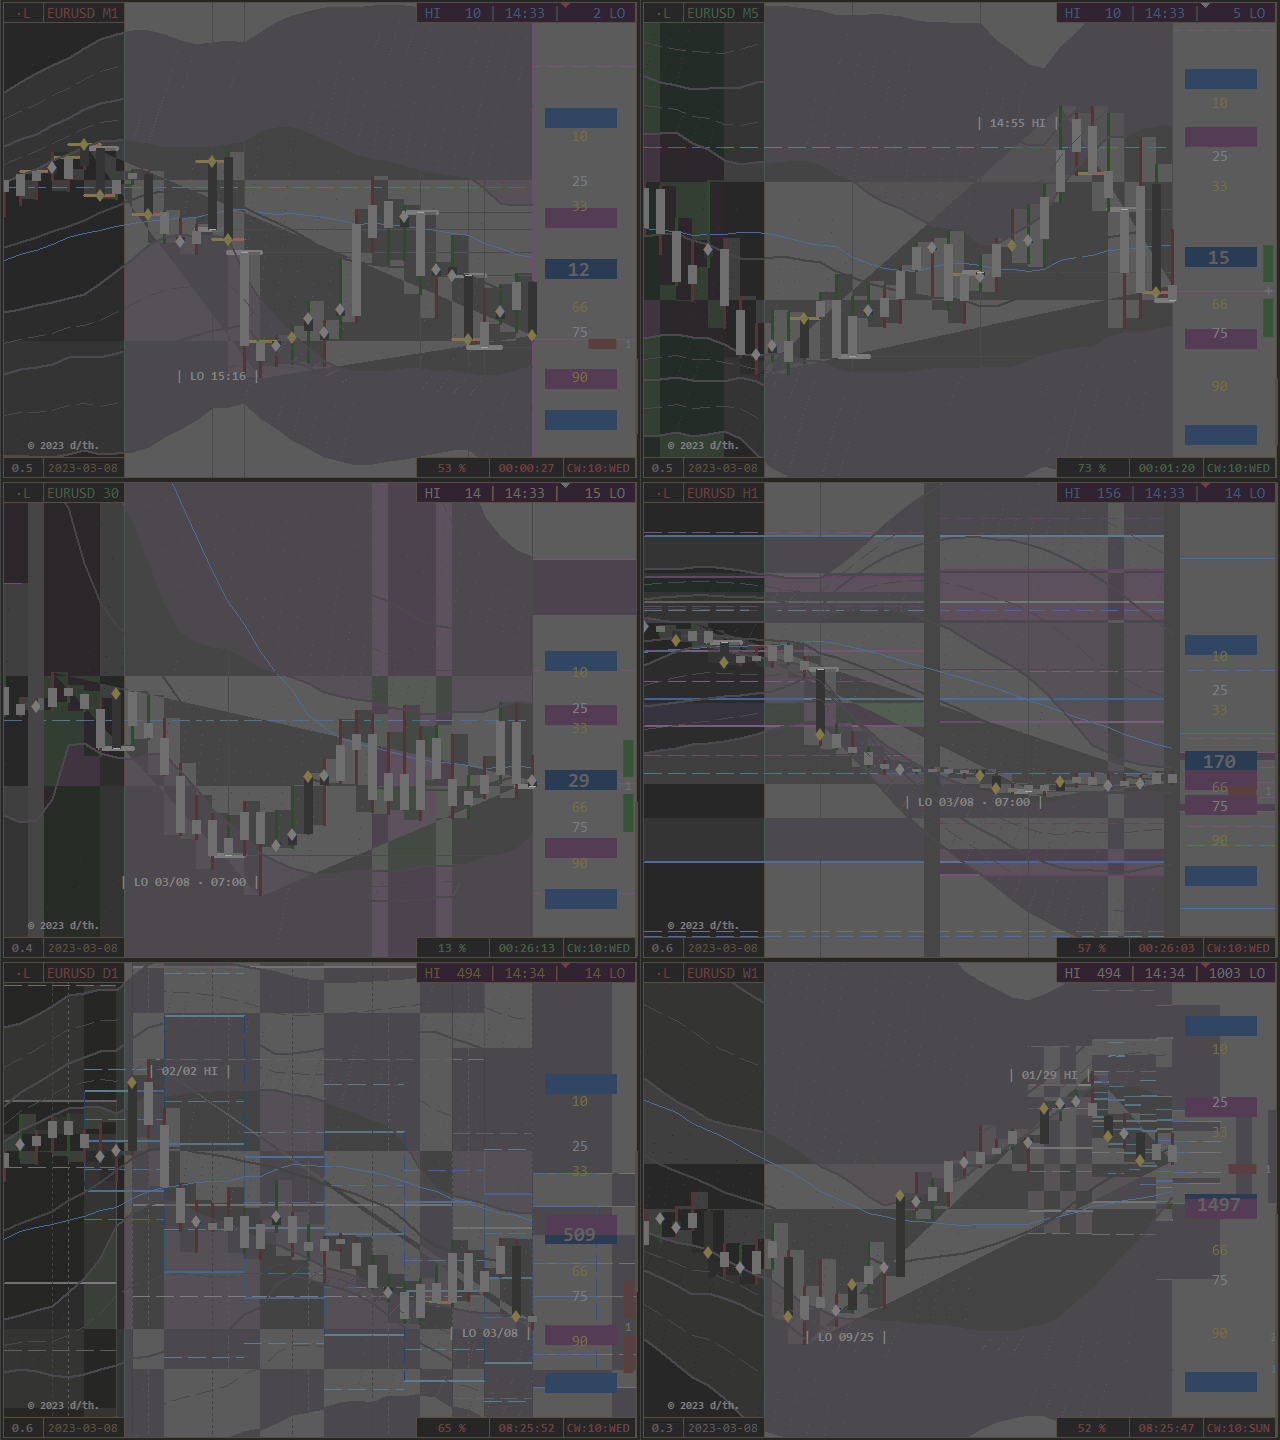
  • Open/ Close at High/ Low/ Center (Notes/ Dashes/ Crosshairs)
  • Open/ Close - Grid, PointZero Support-Resistance Graduation
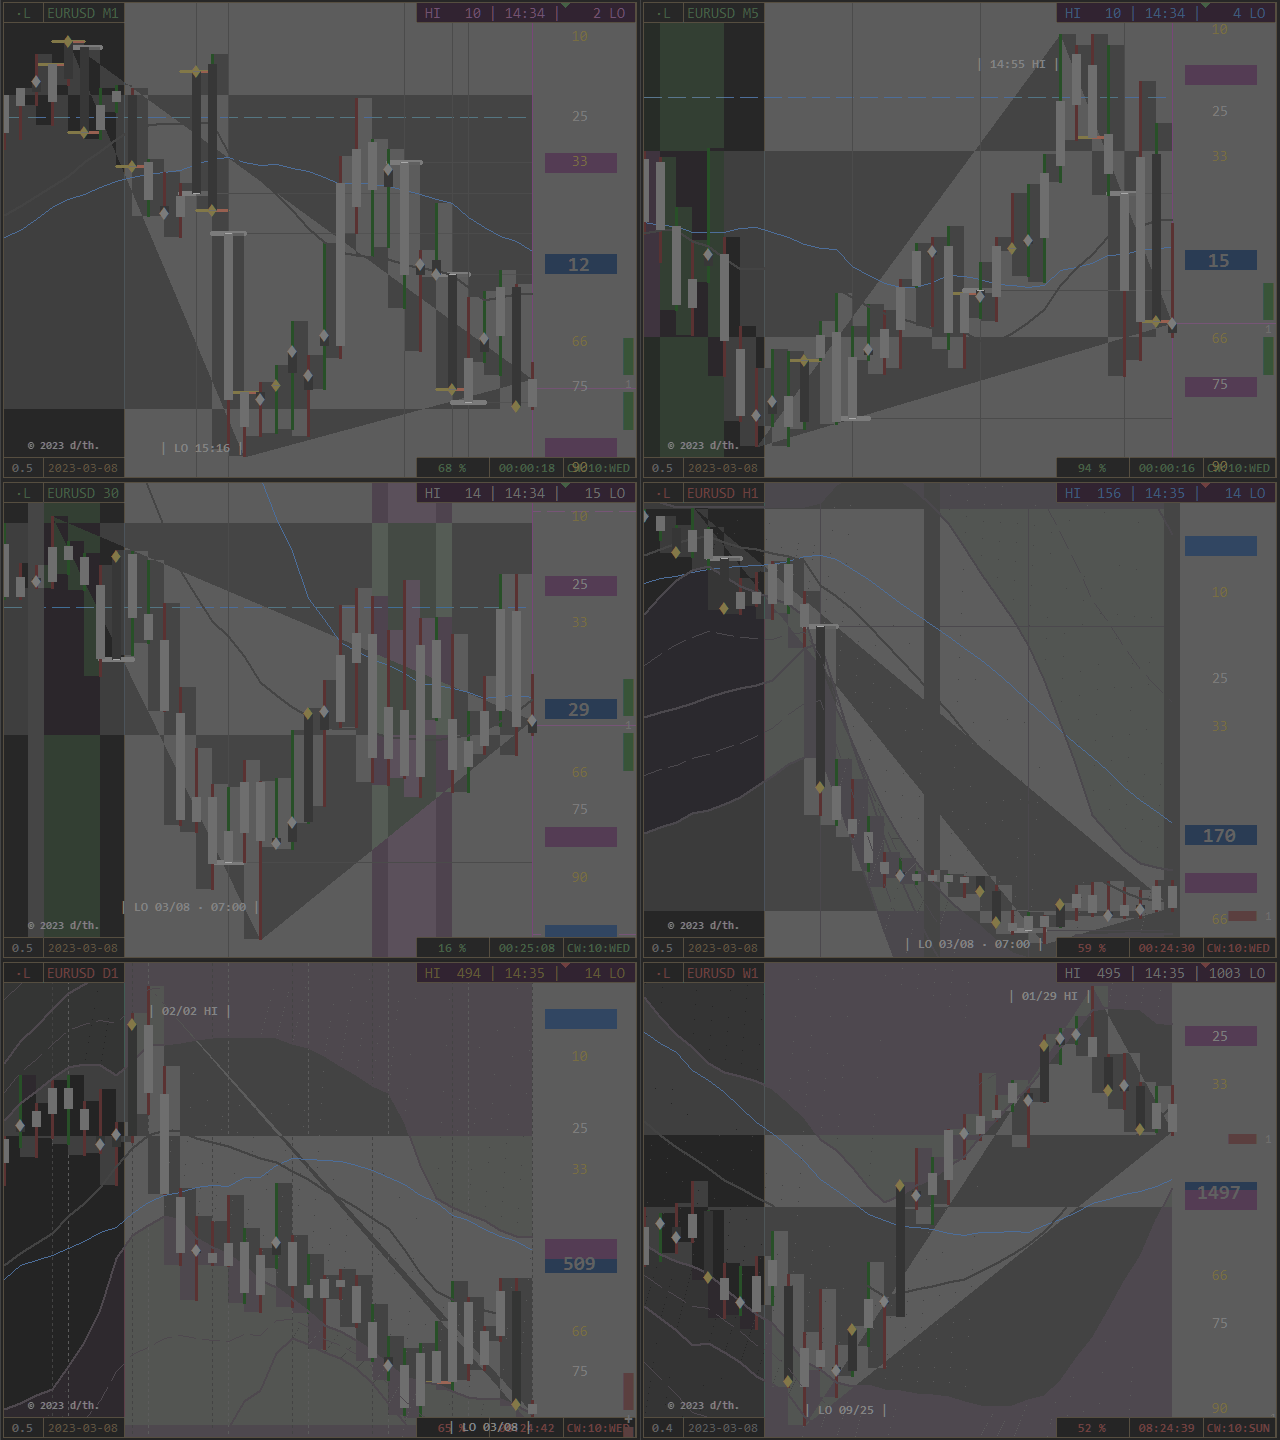
  • High/ Low/ Bid - Cone of Light (Chart Phase Scope)
  • High/ Low - Chart-Time of visible Periods (white, on Chart: timeframe-sensitive)
  • High/ Low - Chart-Price of visible Periods (white, on Price-Column: CHI = Chart High, CLO = Chart Low)

Indication of weekly Realtime-Transition Wednesday and Thursday

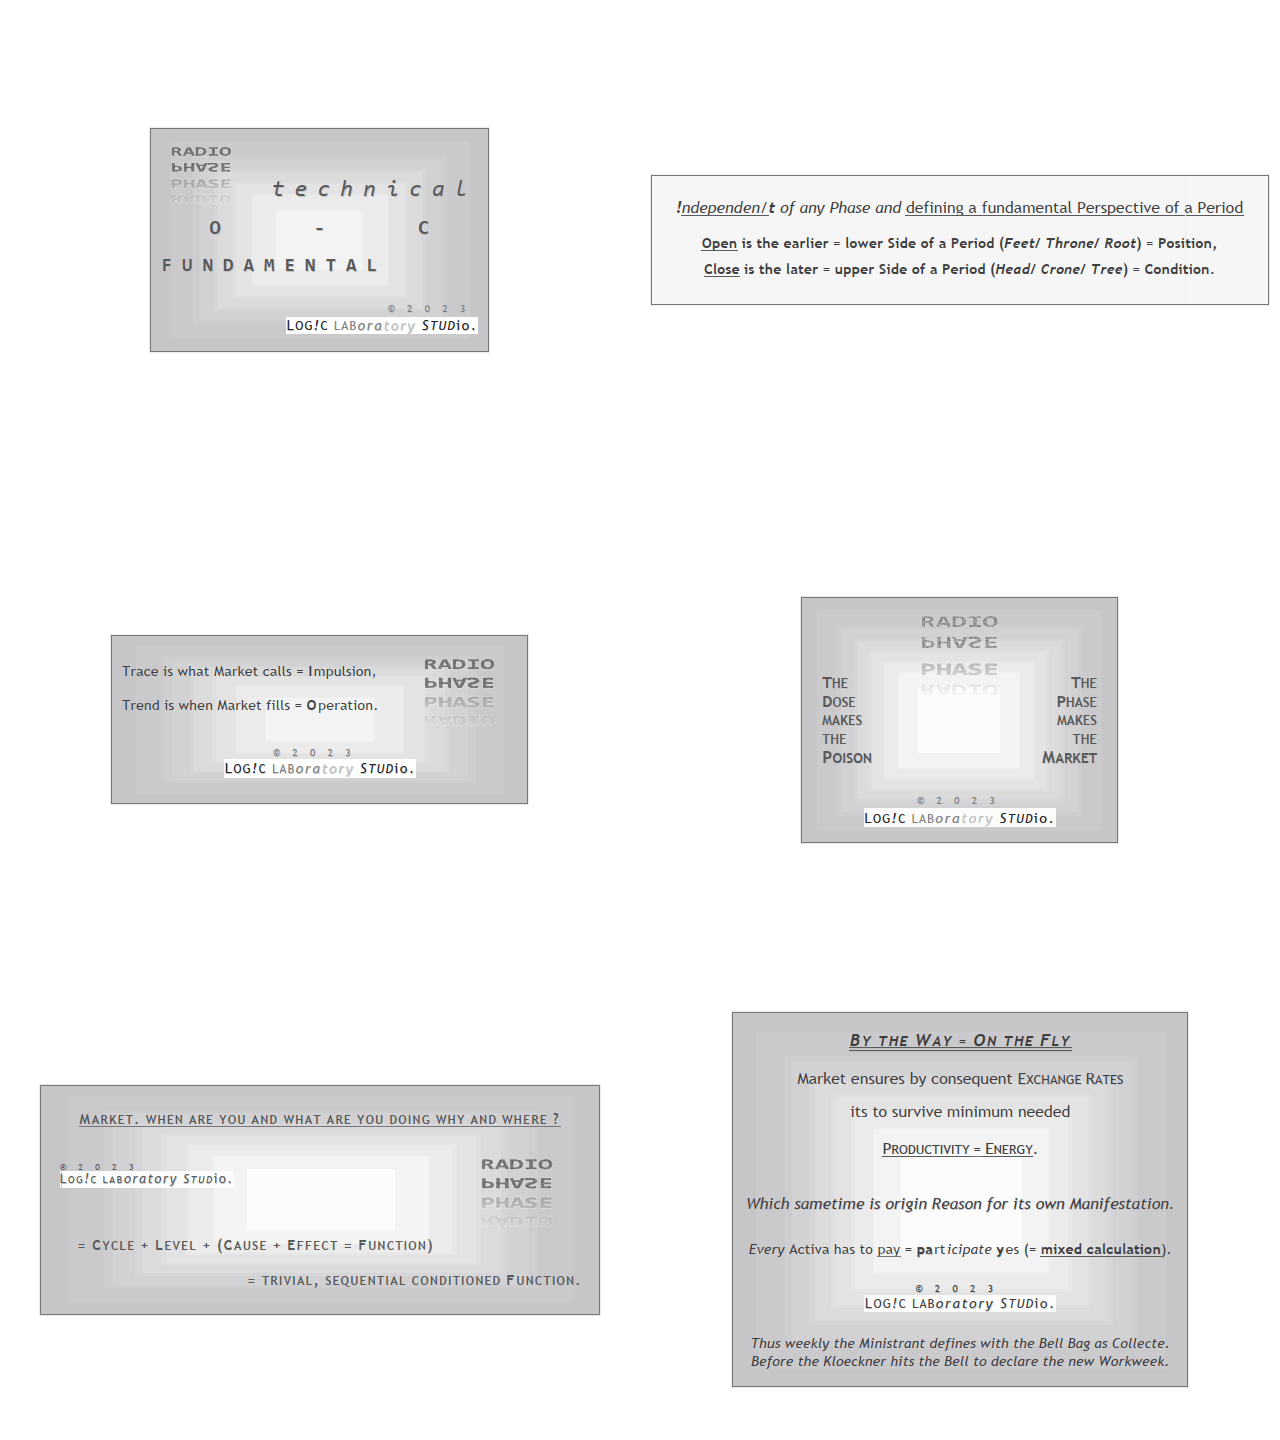
    • Odin = Ministrant/ Mantle/ collects = Close of Phase
    • Thor = Kloeckner/ Hammer/ strikes = Open of Phase

appears on Timeframes > M5 as underlying Histogram-Ray (chart-traversal)

  • if Zero = Close at Open/ High/ Low/ Center: white dash, notes Edges and Centers of Phases


Following Layers are Product of a special Contemplation

of the inner and outer Relations of Open and Close.

Move-Info

DisplayPosition + Direction + Function + Phase

[TOP] Echo Bars:

  • mirrored Bars, directional colored according to their respective Period-Direction,
  • adds an inverted Visual of Movements and forms functional Helix.

[BOT] Echo Trend:

  • mirrored Open- and Close-Trendlines, white = Open and orange = Close,
  • notes separately the leading Component of a Period as Heartbeat-Trend.


Layers

projective Reflection = reflective Projection


The Card Deck:

2 Buttons Corner 0TL

most top-left:
Order-Tool
  • first Letter = Pivot, second Letter = RealTime
  • DisplayC = Cycle/ L = Level/ Dot if not

Symbol - Button:

Clock

  • Market is clocked realtime to the real World by own Interest via cyclic and leveling Events.
  • Button Top right Corner 1 (Screenshot-Button) shows VOL (Volume/ Volatility)
  • Phases MN = M/ W1 = W/ D1 = D
The actual Time-Phase correlates with actual valid Price- and Volume-Phases 
and defines the timely Range of the pricely Movement. 
Price confirms this defining Call as designed Reflection.
Equal Colors cooperate through all Dimensions.


1 Button Corner 1TR

  • Clock Display
  • Screenshot, saved as GIF in \\DataFolder\MQL\Files\


2 Buttons Corner 2BL

Spread-Button (first, left) extends Button Row:

Activate four additional informational Buttons beside Protocol/ Interactive Mask,

which give access to the separate Chart Projectors. 

Note:

The following Layers are Product of the Projection of PointZeros to the actual processed Range and Move.

According to the Separation in Cycles and Levels, the direct

  • Projections as Light Cones are separately accessible.

Ranges and Scales are functional combined, and both are

  • by time: white/ blue and
  • by price: green/ red colored.

All have their conditional Appearance according to

  • Timeframe/ Security and Presence of Conditions 
in common.

Thus, Event-Density and -Impact

  • according to relative Distribution and Correlation of present Potentials!

Because of this, they are directly accessible by Chart-Button, or via Options automatically activated.

Choose of limitless Adjustability for Templates!

Due to their steady Interaction with the present Period they develop

and work actively (if enabled), until the PointZero leaves the Chart.


    From left to right:
    Time-Price-Button:
      DisplayServer-Time + Bid
      FunctionPointZero - Level Scaling
      • TOP Level Ranges
      • absolute and relative Plot of High/ Low - Ranges of respective PointZeros, 
        • Color navigational/ positional
      • BOT Phase Scales
      • absolute Division of respective PointZero - Range, 
        • overlying Variable notes TOHLCV - Position of next directive Call


      TPP / PPT - Button:

        Display: Productivity

        VPP = Volume per Period:
        Protocol List/ Center on TimeBand
        absolute (= Frequency)
        Impulse / Period
        Sensitivity 15%

          TPP = Ticks per Pip:

          • relative (= Alteration)
          • Impulse / Pip
          • Sensitivity 33%

            PPT = Pips per Tick:

            • total (= Oscillation)
            • Pip / Impulse
            • Sensitivity 50%

              Please further Informations to external Productivity in Section [7.0].


              FunctionPointZero - Projector (Beams)

              • on Top = Cycle
              • on Bottom = Level


                Both Projectors are setting their own Range Position in Relation to the actual Range Position,

                depending on their individual cyclic/ leveling Function.

                They work according to their Function and related to the individual Chart-Situation 
                as 
                ranging Barriers (Resistance) or 
                moving Tractors (Support).
                  Their Update-Frequency is by Tick, that means: they adjust in Cooperation with the 
                  actual Development, as long as their Period is on the Chart visible (if enabled).

                  Date-Button (second, right)
                    • Toggles the Period-Scale and 
                    • navigating Arrows RH/ MH/ ML/ RL, noting their Offset to their prior Position.
                    • Periods: Support white - Resistance orange


                      3 Buttons Corner 3 = BR

                      Colorize Channel Bands and Period Ranges to identify their Classification/ Function:

                      • Step = violet = D1 
                      • Lift = blue = W1
                      • Null = white = MN
                      • Full = orange = H4

                      left: [Period-Percentage] = colored Periods

                      note the classified State of Period-Moves

                      right: [CalendarWeek:WeekDay] = colored Channel-Bands
                      note the classified State of Period-Ranges = Channel-Shells/ Levels
                      center: [Countdown] = Close Signal

                      initially not shown, here on/off


                      Adjustments of general Nature:

                      • The Descriptive Mode is useful for Orientation or Confirmation (of not finally settled Experience).
                      • Extend the Pivot by H4 for smaller Timeframe Analysis.
                      • The MT4-Scales are a "fundamental Adjustment". I cannot resolve them..


                      Integer/ Double

                      constant variable = variable constant

                      The Icing:

                      • Protocol Role0 = Func (Function) / 1 = Bube (BullBear)
                      • Offset Price: position Price by whitchever Intent
                      • Shorten Digits: 6 Digits can be shorten to the preferred Length

                      • Screenshot 
                        • Interval: 0 = off
                        • Integer above 0 = Interval in Minutes
                        • adjust in Height and Width
                        • saved as GIF in \\DataFolder\MQL\Files\


                      Please find all necessary Informations to this Product in its Compendium in its respective RadioPhase - Blog.


                      logiclaboratory studio
                      © 2018-2023 /thiejden.


                      Отзывы 2
                      Jamie Daniel Thompson
                      163
                      Jamie Daniel Thompson 2023.06.22 14:43 
                       

                      Extremely useful and incredible tool! I don't understand how this doesn't have 5 star reviews yet! It has totally changed the accuracy of my entries! Thanks to the author!

                      Рекомендуем также
                      Индикатор отображает на графике сигналы согласно стратегии Билла Вильямса. Демо версия индикатора имеет такие же функции, как и платная, за исключением того, что может работать только на демо-счете. Сигнал "Первый мудрец" формируется, когда появляется разворотный бар с ангуляцией. Бычий разворотный бар - у которого более низкий минимум и цена закрытия в верхней его половине. Медвежий разворотный бар - более высокий максимум и цена закрытия в нижней его половине. Ангуляция образуется, когда все
                      FREE
                      SensorMap
                      Juergen Thielen
                      5 (1)
                      Concept Market arranges in Time upcoming Phases according to the present Results of its Interest. Directing Modulations are an Interaction of immanent Periods, which show in Reference to Time cyclic Activity and to Price leveling Activity. SensorMap is a reflecting Volume Mask of this Concept of Time and Price and apportioning developed Price Movements in an equalized 100 % - Range: how far moved ? indicating their Status by marking special Events: when which Action ? setting the Situation in a
                      FREE
                      Free automatic fibonacci - это индикатор, который автоматически строит коррекции Фибоначчи, основываясь на количестве баров, выбранных в параметре BarsToScan. Линии Фибоначчи автоматически обновляются в реальном времени при появлении новых максимальных и минимальных значений среди выбранных баров. В настройках индикатора можно выбрать уровни, значения которых будут отображены. Также можно выбрать цвет уровней, что позволяет трейдеру прикреплять индикатор несколько раз с разными настройками и цве

                      FREE
                      SuperMac Free
                      Agus Wahyu Pratomo
                      4 (1)
                      FREE VERSION ONLY USE LOT SIZE 0.01 TO UNLOCK IT GO HERE  https://www.mql5.com/en/market/product/61498 SuperMac EA is a trading robot  for the trading on forex and trades  Scalping  Strategy and Tren Follower. This is a Trend Following system that trades in all session.   It use Multi Complex Algorithm to determine tren behaviour.  EA optimized on EURUSD, GBPUSD and NZDUSD (Use together) but can be use on other pair  Use PAIR can use 3 pairs (recommended to maximize profit) at the same time (
                      FREE
                      Индикатор PipTick OHLC показывает текущие и исторические значения минимума, максимума, открытия, закрытия и средне цены на выбранном периоде. Он может отображать текущие значения или значения за предыдущую сессию. Диапазоном для расчета индикатора может быть дневная, недельная, месячная или любая выбранная пользователем сессия. Уровни Максимум текущей или предыдущей сессии. Минимум текущей или предыдущей сессии. Открытие текущей или предыдущей сессии. Закрытие текущей или предыдущей сессии. Сре
                      FREE
                      Этот индикатор является идеальным инструментом для сравнения брокеров на предмет минимального запаздывания. Он моментально показывает медленных и быстрых брокеров. Точка на линии означает, что этот брокер самый быстрый, а красной линией (Broker_A) отмечен самый медленный брокер. Посмотрите пример на скриншоте. Как это работает? Индикатор работает с общей ценовой информацией в общей папке из каталога данных. Он сравнивает все цены. Цена основана на среднем значении (Ask + Bid) / 2. Есть два усло
                      FREE
                      Индикатор показывает сигналы, основанные на терминальном осцилляторе RSI на графике. Есть возможность отфильтровывать повторяющиеся (залипшие) сигналы. Здесь RSI используется для поиска сигналов на разворот. Рекомендуется в качестве точки входа по свинг-стратегии и торговли от уровней. Доступен мультивалютный дэшборд. С его помощью вы можете легко переключаться между графиками. В обсуждениях продукта вы можете предложить алгоритм, в который хотите встроить дэшборд. Входные параметры. Основ
                      FREE
                      Non-Repainting Supertrend Indicator for MT4 The Non-Repainting Supertrend Indicator is a powerful tool for detecting market trends and breakout points. Specifically designed for the MetaTrader 4 (MT4) platform, this support and resistance indicator uses a dynamic trendline and signal arrows to accurately reflect the direction and potential reversal of price movements. «Indicator Installation & User Guide» MT4 Indicator Installation  | Non Repainting Supertrend Indicator for MT5   | ALL Product
                      FREE
                      PZ The Zone
                      PZ TRADING SLU
                      4.33 (3)
                      Индикатор показывает сигналы на покупку и продажу в соответствии с определением торговой зоны, данным Биллом Вильямсом. Прост в использовании и интерпретации Избегает флета Детерминистский индикатор с четкими правилами Не перерисовывается Доступны все типы алертов Согласно Биллу Вильямсу, торговля в пределах зоны позволяет максимизировать/удвоить/утроить прибыль при движении рынка в нужную сторону, а именно, когда импульс, ускорение и цена подтверждают сильный тренд или период ускорения. Распола
                      FREE
                      Follow The Line
                      Oliver Gideon Amofa Appiah
                      3.94 (16)
                      FOLLOW THE LINE GET THE FULL VERSION HERE: https://www.mql5.com/en/market/product/36024 This indicator obeys the popular maxim that: "THE TREND IS YOUR FRIEND" It paints a GREEN line for BUY and also paints a RED line for SELL.  It gives alarms and alerts of all kinds. IT DOES NOT REPAINT and can be used for all currency pairs and timeframes. Yes, as easy and simple as that. Even a newbie can use it to make great and reliable trades. NB: For best results, get my other premium indicators for more
                      FREE
                      Awesome MACD Indicator
                      Komang Putra Riswanjaya
                      5 (1)
                      AWESOME MACD INDICATOR Awesome MACD Indicator is a powerful trading tool that combines the strengths of Moving Average (MA) and Moving Average Convergence Divergence (MACD) to provide accurate and reliable trading signals. Designed for forex and stock traders, this indicator simplifies the identification of trading opportunities by detecting significant crosses in price movements. Key Features: MA and MACD Combination: Awesome MACD leverages the power of Moving Averages (MA) to identify short-te
                      FREE
                      Sideway Trend Indicator for MetaTrader 4 The Sideway Trend Indicator for MetaTrader 4 is a practical analytical tool designed to detect consolidation phases where the market lacks directional movement. During such periods of reduced volatility, the indicator visualizes the range-bound behavior. Once the price breaks out of this sideways phase, the tool issues clear entry signals, enabling traders to act with improved timing and accuracy. «Indicator Installation & User Guide» MT4 Indicator Insta
                      FREE
                      Индикатор Стрелки (Сигналы на Покупку/Продажу) – простой, но мощный инструмент! Версия продукта : 1.01 Тип индикатора : Сигналы разворота тренда Поддерживаемые таймфреймы : Все (Рекомендуется: H1, H4, D1) Ключевые особенности : Сигнал на покупку : Зелёная стрелка вверх () под свечой Сигнал на продажу : Красная стрелка вниз () над свечой Точное определение разворотов тренда – основано на проверенной стратегии SMA. ️ Чистый график – минималистичный, ненавязчивый стиль ото
                      FREE
                      FFx MACD
                      Eric Venturi-Bloxs
                      4.2 (5)
                      Целью этой новой версии стандартного MT4 индикатора, входящего в поставку платформы, является отображение в подокне нескольких таймфреймах одного и того же индикатора. См. пример, приведенный на рисунке ниже. Однако индикатор отражается не как простой индикатор MTF. Это реальное отображение индикатора на его таймфрейме. Доступные настройки в индикаторе FFx: Выбор таймфрейма для отображения (от M1 до MN) Установка ширины (количество баров) для каждого окна таймфрейма Всплывающее оповещение/звуков
                      FREE
                      Бесплатный информационный индикатор-помощник Email Alert & InfoPanel. Особенно будет полезен трейдерам, использующим большое количество валютных пар или сеточные торговые системы с усреднением или Мартингейлом. Также он просто удобен, как информатор с возможность отправки сообщения на почту или мобильное приложение. Выполняет следующие функции: Рассчитывает просадку депозита по эквити и отправляет сообщение пользователю, если она больше, чем указана в настройках. Отправляет уведомление о просадк
                      FREE
                      ACD Indicator for MetaTrader 4 The ACD indicator, developed by Mark Fisher, is a technical analysis tool in MetaTrader 4 used to detect potential market trends and assess trend strength. The ACD system is built around identifying the market’s Opening Range (OR) and using it to establish key trading levels. This range typically includes the first 30 minutes to one hour of market activity. After defining the OR, traders identify levels A and C, derived from it, to guide trading decisions. These le
                      FREE
                      Are you tired of drawing trendlines every time you're analyzing charts? Or perhaps you would like more consistency in your technical analysis. Then this is for you. This indicator will draw trend lines automatically when dropped on a chart. How it works Works similar to standard deviation channel found on mt4 and mt5. It has 2 parameters: 1. Starting Bar 2. Number of bars for calculation The   starting bar   is the bar which drawing of the trend lines will begin, while the   number of bars for c
                      FREE
                      OrderBlock TS Roman
                      Vladislav Vlastovskii
                      3.8 (5)
                      Индикатор строит блоки заказов (БЗ) по торговой системе (ТС) Романа. Поиск блоков осуществляется одновременно на двух таймфремах: текущем и старшем (определяемым в настройках). Для оптимизации и игнорирования устаревших блоков в настройках задается ограничение количества дней в пределах которых осуществляется поиск блоков. Блоки строятся по правилам ТС состоящем из трех шагов: какую свечу вынесли (что?); какой свечой вынесли (чем?); правило отрисовки (как?).
                      FREE
                      Only One Trade a Day Indicator MetaTrader 4 The Only One Trade a Day indicator is developed for the MetaTrader 4 platform to generate buy and sell signals.This trading tool analyzes market behavior using two moving averages—one fast and one slow—and displays the generated signals as blue and red arrows directly on the chart. «Indicator Installation & User Guide» MT4 Indicator Installation  |  Only One Trade a Day Indicator MT5   | ALL Products By   TradingFinderLab  | Best MT4 Indicator:   Ref
                      FREE
                      ET1 for MT4 is new and completely free!! ET1 for MT4 v4.20 Updated!! Now use on XAUUSD(Gold)!! The success rate is more than 75% !!! important update: Merge ET9 's breakout strategy Warning!! You can use ET1 completely free, but we do not guarantee ET1 stability, It is recommended that the more powerful ET9 for MT4 version includes the ET1 strategy and guarantees complete and stable returns. The Best Expert Advisor  on   XAUUSD   any timeframes  ET9  for MT4 Updated v4.70 !!  https://www.mql5
                      FREE
                      Ловец трендов: Стратегия Ловец трендов с индикатором оповещения - это универсальный инструмент технического анализа, который помогает трейдерам определять рыночные тренды и потенциальные точки входа и выхода. Он представляет собой динамичную стратегию Ловец трендов, адаптирующуюся к рыночным условиям для четкого визуального представления направления тренда. Трейдеры могут настраивать параметры в соответствии со своими предпочтениями и уровнем риска. Индикатор помогает в идентификации тренда, с
                      FREE
                      Данный сканер показывает значения тренда известного индикатора SuperTrend для множества инструментов (до 30) и 8 таймфреймов. Уведомляет о смене направления тренда в терминале MetaTrader 4, по email и push-уведомлением. Это бесплатная версия индикатора SuperTrend Scanner Бесплатная версия работает только на EURUSD и GBPUSD! Важная информация Для максимального использования потенциала сканера прочитайте полное описание (на английском языке): www.mql5.com/en/blogs/post/718074 Бесплатная версия п
                      FREE
                      Ppr PA
                      Yury Emeliyanov
                      4 (1)
                      "Ppr PA" – это уникальный технический индикатор, созданный для выявления паттернов " PPR " на валютных графиках торговой платформы МТ4. Эти паттерны могут указывать на возможные развороты или продолжения тренда, предоставляя трейдерам ценные сигналы для входа в рынок. Особенности: Автоматическое Обнаружение PPR: Индикатор автоматически идентифицирует и отмечает паттерны PPR стрелками на графике. Визуальные Сигналы: Зеленые и красные стрелки обозначают оптимальные точки для покупки и продажи соот
                      FREE
                      Данный индикатор создан для поиска предполагаемых разворотных точек цены символа. В его работе используется небольшой разворотный свечной паттерн в совокупности с фильтром экстремумов. Индикатор не перерисовывается! В случае отключения фильтра экстремумов, индикатор показывает все точки, в которых есть паттерн. В случае включения фильтра экстремумов, работает условие – если в истории на Previous bars 1 свечей назад, были более высокие свечки и они дальше чем свеча Previous bars 2 – то тогда тако
                      FREE
                      Pivot Mean Oscillator (PMO) is a unbounded zero-centered oscillator that provides a quick and normalized measure of divergence between two spreads. Detailed description of the mathematical formulation along with some comments and experiments can be found in this article .  Trading aspects This version of PMO is tuned on spreads relative to Close and Open price signals against their cumulative moving average (CMA). Positive PMO(m,n) values means that last (normalized) m Close prices are higher t
                      FREE
                      Signals and Alerts for Accelerator/Decelerator indicator based on these MQL5 posts: Accelerator Oscillator and Signals of the Indicator Accelerator Oscillator . Note : this tool is based on the code of Accelerator indicator developed by MetaQuotes Software Corp. Features The signals are triggered at   closing   of last bar/opening of a new bar; Any kind of alerts can be enabled: Dialog Box, Email message, SMS notifications for smartphones and tablets, and Sound alerts; Customizable arrows. By d
                      FREE
                      Line
                      Andrea Fontanini
                      free only until the end of the week The following indicator must be used and contextualized according to your trading methodologies. It provides excellent trading insights and identifies rejection zones on the drawn lines. Several parameters can be customized. The indicator will plot three levels above and below the opening price on D1, W1, and MN1. It will provide the daily ADR and display two additional daily sessions (EUROPE session and USA session). The colors of the various lines can be cu
                      FREE
                      ''Trendlines'' is an Indicator, that every Trader need and shows Trendline and  Support and resistance levels in all  Timeframe's. Also In 1-hour, 4-hour and daily time frames and Current timeframes, support, and resistance levels are specified and trend lines are drawn so that the trader can see all levels on a chart.   In   Properties   it is possible to turn off unnecessary Lines.  In ' Tendency indicator '' , as full package of Predictions that every Trader need, there  is also the Predict
                      FREE
                      Zerolag MACD indicator MT4 The Zerolag MACD indicator offers a refined alternative to the traditional MACD, designed for enhanced responsiveness. By minimizing latency in its signal calculations, this tool empowers traders to act swiftly, especially in volatile market conditions. While it preserves the foundational components of the original MACD—such as signal line, histogram, and moving averages—it delivers them with improved speed and precision. «Indicator Installation & User Guide» MT4 Indi
                      FREE
                      С этим продуктом покупают
                      M1 SNIPER — это простая в использовании торговая система. Это стрелочный индикатор, разработанный для тайм фрейма M1. Индикатор можно использовать как отдельную систему для скальпинга на тайм фрейме M1, а также как часть вашей существующей торговой системы. Хотя эта торговая система была разработана специально для торговли на M1, ее можно использовать и с другими тайм фреймами. Первоначально я разработал этот метод для торговли XAUUSD и BTCUSD. Но я считаю этот метод полезным и для торговли на д
                      Gann Made Easy - это профессиональная, но при этом очень простая в применении Форекс система, основанная на лучших принципах торговли по методам господина У.Д. Ганна. Индикатор дает точные BUY/SELL сигналы, включающие в себя уровни Stop Loss и Take Profit. Пожалуйста, напишите мне после покупки! Я поделюсь своими рекомендациями по использованию индикатора. Также вас ждет отличный бонусный индикатор в подарок! Вероятно вы уже не раз слышали о торговли по методам Ганна. Как правило теория Ганна от
                      Trend indicator AI
                      Ramil Minniakhmetov
                      5 (49)
                      Индикатор Trend Ai - отличный инструмент, который улучшит анализ рынка трейдером, сочетая идентификацию тренда с точками входа и предупреждениями о развороте. Этот индикатор позволяет пользователям уверенно и точно ориентироваться в сложностях рынка Форекс Помимо первичных сигналов, индикатор Trend Ai определяет вторичные точки входа, возникающие во время откатов или коррекций, позволяя трейдерам извлекать выгоду из коррекции цены в рамках установленного тренда. Важные преимущества: · Работае
                      Инновационный индикатор, использующий эксклюзивный алгоритм для быстрого и точного определения тренда. Индикатор автоматически рассчитывает время открытия и закрытия позиций, а также подробную статистику работы индикатора на заданном отрезке истории, что позволяет выбрать наилучший торговый инструмент для торговли. Вы также можете подключить свои пользовательские стрелочные индикаторы к Scalper Inside Pro для проверки и расчета их статистики и прибыльности. Инструкция и настройки: Читать... Осно
                      To celebrate the official release, $65 is the new PROMO price for the first 25 copies (5 left)! After that, the price increases to $120. SMC Easy Signal was built to remove the confusion around the smart money concept by turning structural shifts like BOS (Break of Structure) and CHoCH (Change of Character) into simple buy and sell trading signals. It simplifies market structure trading by automatically identifying breakouts and reversals as they happen, allowing traders to focus on execution
                      Currency Strength Wizard — очень мощный индикатор, предоставляющий вам комплексное решение для успешной торговли. Индикатор рассчитывает силу той или иной форекс-пары, используя данные всех валют на нескольких тайм фреймах. Эти данные представлены в виде простых в использовании индексов валют и линий силы валют, которые вы можете использовать, чтобы увидеть силу той или иной валюты. Все, что вам нужно, это прикрепить индикатор к графику, на котором вы хотите торговать, и индикатор покажет вам ре
                      Dynamic Forex28 Navigator — инструмент для торговли на рынке Форекс нового поколения. В НАСТОЯЩЕЕ ВРЕМЯ СКИДКА 49%. Dynamic Forex28 Navigator — это эволюция наших популярных индикаторов, объединяющая мощь трех в одном: Advanced Currency Strength28 Indicator (695 отзывов) + Advanced Currency IMPULSE with ALERT (520 отзывов) + CS28 Combo Signals (бонус). Подробности об индикаторе https://www.mql5.com/en/blogs/post/758844 Что предлагает индикатор Strength нового поколения?  Все, что вам нравило
                      Day Trader Master - это полноценная торговая система для трейдеров, кто ведет внутридневную торговлю. Система состоит из двух индикаторов. Один индикатор представляет собой стрелки-сигналы на покупку и продажу. Именно стрелочный индикатор вы приобретаете. Второй индикатор я предоставлю вам совершенно бесплатно. Второй индикатор является индикатором тренда, специально разработанного для использования совместно с этими стрелками. ИНДИКАТОРЫ НЕ ПЕРЕРИСОВЫВАЮТСЯ И НЕ ЗАПАЗДЫВАЮТ! Использовать данную
                      В настоящее время скидка 20%! Эта приборная панель - очень мощное программное обеспечение, работающее на нескольких символах и до 9 таймфреймов. Он основан на нашем основном индикаторе (Лучшие отзывы: Advanced Supply Demand ).   Приборная панель дает отличный обзор. Она показывает:  Отфильтрованные значения спроса и предложения, включая рейтинг силы зон, расстояния между пунктами в зонах и внутри зон, Выделяются вложенные зоны, Выдает 4 вида предупреждений для выбранных символов на всех (9) та
                      Trend Screener
                      STE S.S.COMPANY
                      4.79 (95)
                      Индикатор тренда, революционное уникальное решение для торговли и фильтрации тренда со всеми важными функциями тренда, встроенными в один инструмент! Это 100% неперерисовывающийся мультитаймфреймный и мультивалютный индикатор, который можно использовать на всех инструментах/инструментах: форекс, товары, криптовалюты, индексы, акции. ПРЕДЛОЖЕНИЕ ОГРАНИЧЕННОГО ВРЕМЕНИ: Индикатор скринера поддержки и сопротивления доступен всего за 50$ и бессрочно. (Изначальная цена 250$) (предложение продлено) Tre
                      В настоящее время скидка 20%! Лучшее решение для новичка или трейдера-эксперта! Эта приборная панель работает на 28 валютных парах. Он основан на 2 наших основных индикаторах (Advanced Currency Strength 28 и Advanced Currency Impulse). Он дает отличный обзор всего рынка Forex. Он показывает значения Advanced Currency Strength, скорость движения валюты и сигналы для 28 пар Forex на всех (9) таймфреймах. Представьте, как улучшится ваша торговля, когда вы сможете наблюдать за всем рынком с помощ
                      Trend Arrow Super Индикатор не перерисовывается и не изменяет свои данные. Профессиональная,но при этом очень простая в применение Форекс система.Индикатор даёт точные BUY\SELL сигналы. Trend Arrow Super очень прост в применение,вам нужно просто прикрепить его на график и следовать простым рекомендация по торговле. Сигнал на покупку: Стрелка + гистограмма зеленого цвета, входим сразу по рынку на покупку. Сигнал на продажу: Стрелка + Гистограмма красного цвета,входим сразу по рынку на продажу.
                      Gold Stuff
                      Vasiliy Strukov
                      4.85 (263)
                      Gold Stuff - трендовый индикатор, разработанный специально для золота, также может использоваться на любых финансовых инструментах. Индикатор не перерисовывается и не запаздывает. Рекомендуемый тайм-фрейм H1.  По данному индикатору написан советник EA Gold Stuff, Вы можете найти его в моем профиле. Свяжитесь со мной сразу после покупки для получения   персонального бонуса!  Вы можете получить бесплатную копию нашего индикатора Strong Support and Trend Scanner, пожалуйста, в личку. мне! Настройки
                      Advanced Supply Demand
                      Bernhard Schweigert
                      4.91 (296)
                      Этот индикатор является уникальным, качественным и доступным инструментом для торговли, включающим в себя наши собственные разработки и новую формулу. В обновленной версии появилась возможность отображать зоны двух таймфреймов. Это означает, что вам будут доступны зоны не только на старшем ТФ, а сразу с двух таймфреймов - таймфрейма графика и старшего: отображение вложенных зон. Обновление обязательно понравится всем трейдерам, торгующим по зонам спроса и предложения. Важная информация Для макс
                      Специальное предложение : ALL TOOLS , всего по $35 каждый! Новые инструменты   будут по   $30   в течение   первой недели   или   первых 3 покупок !  Trading Tools Channel on MQL5 : подпишитесь, чтобы получать самые свежие новости RSI Shift Zone Scanner определяет моменты возможного изменения рыночного настроения, связывая сигналы RSI с движением цены. Когда RSI выходит выше или ниже заданных уровней (по умолчанию 70 — перекупленность, 30 — перепроданность), индикатор рисует канал прямо на граф
                      Скринер поддержки и сопротивления находится в одном индикаторе уровня для MetaTrader, который предоставляет несколько инструментов внутри одного индикатора. Доступные инструменты: 1. Скринер структуры рынка. 2. Зона бычьего отката. 3. Зона медвежьего отката. 4. Ежедневные опорные точки 5. еженедельные опорные точки 6. ежемесячные опорные точки 7. Сильные поддержка и сопротивление, основанные на гармоническом паттерне и объеме. 8. Зоны уровня берега. ПРЕДЛОЖЕНИЕ ОГРАНИЧЕННОЕ ВРЕМЯ: Индикатор подд
                      Apollo Secret Trend — это профессиональный индикатор тренда, который можно использовать для поиска трендов на любой паре и тайм фрейме. Индикатор может легко стать вашим основным торговым индикатором, который вы можете использовать для определения рыночных тенденций, независимо от того, какую пару или временной интервал вы предпочитаете торговать. Используя специальный параметр в индикаторе, вы можете адаптировать сигналы к своему личному стилю торговли. Индикатор предоставляет все типы оповещен
                      FX Power: Анализируйте силу валют для более эффективной торговли Обзор FX Power — это ваш незаменимый инструмент для понимания реальной силы валют и золота в любых рыночных условиях. Определяя сильные валюты для покупки и слабые для продажи, FX Power упрощает принятие торговых решений и выявляет высоковероятные возможности. Независимо от того, хотите ли вы следовать за трендами или предсказывать развороты с использованием экстремальных значений дельты, этот инструмент идеально адаптируется под
                      СЕЙЧАС СКИДКА 31% !!! Лучшее решение для новичка или трейдера-эксперта! Этот индикатор является уникальным, высококачественным и доступным торговым инструментом, поскольку мы включили в него ряд собственных функций и секретную формулу. Всего на ОДНОМ графике он выдает алерты по всем 28 валютным парам. Представьте, как улучшится ваша торговля, ведь вы сможете точно определить точку запуска нового тренда или возможность скальпирования! Построенный на новых базовых алгоритмах, он позволяет еще
                      Сколько раз вы покупали торговый индикатор с отличными бэк-тестами, доказательством производительности на реальном счете с фантастическими числами и статистикой повсюду , но после использования вы в конечном итоге сливали свой счет? Вам не следует доверять сигналу самому по себе, вам нужно знать, почему он появился в первую очередь, и это то, что RelicusRoad Pro делает лучше всего! Руководство пользователя + Стратегии + Обучающие видео + Приватная группа с VIP-доступом + Доступна мобильная верс
                      M1 Easy Scalper
                      Martin Alejandro Bamonte
                      5 (2)
                      M1 EASY SCALPER — это индикатор для скальпинга, специально разработанный для таймфрейма 1 минута (M1), совместимый с любой валютной парой или инструментом на вашем терминале MT4. Конечно, его можно использовать и на других таймфреймах, но он особенно эффективен на M1 (что довольно сложно!) для скальпинга. Примечание: если вы собираетесь заниматься скальпингом, убедитесь, что у вас есть подходящий для этого счёт. Не используйте центовые или стандартные счета, так как у них слишком высокие спреды!
                      Special offer! https://www.mql5.com/ru/users/bossik2810 Quantum Entry — это мощная система торговли по ценовому действию, построенная на одной из самых популярных и широко известных стратегий среди трейдеров: стратегия прорыва! Этот индикатор выдает кристально чистые сигналы покупки и продажи, основанные на прорывах ключевых зон поддержки и сопротивления. В отличие от типичных индикаторов прорыва, он использует расширенные вычисления для точного подтверждения прорыва! Когда происходит прорыв, в
                      Daily Candle Predictor - это индикатор, который предсказывает цену закрытия свечи. Прежде всего индикатор предназначен для использования на графиках D1. Данный индикатор подходит как для традиционной форекс торговли, так и для торговли бинарными опционами. Индикатор может использоваться как самостоятельная торговая система, так может выступать в качестве дополнения к вашей уже имеющейся торговой системе. Данный индикатор производит анализ текущей свечи, рассчитывая определенные факторы силы внут
                      PRO Renko System - это высокоточная система торговли на графиках RENKO. Система универсальна. Данная торговая система может применяться к различным торговым инструментам. Система эффективно нейтрализует так называемый рыночный шум, открывая доступ к точным разворотным сигналам. Индикатор прост в использовании и имеет лишь один параметр, отвечающий за генерацию сигналов. Вы легко можете адаптировать алгоритм к интересующему вас торговому инструменту и размеру ренко бара. Всем покупателям с удовол
                      Volatility Trend System - торговая система дающая сигналы для входов.  Система волатильности дает линейные и точечные сигналы в направлении тренда, а также сигналы выхода из него, без перерисовки и запаздываний. Трендовый индикатор следит за направлением среднесрочной тенденции, показывает направление и ее изменение. Сигнальный индикатор основан на изменении волатильности, показывает входы в рынок. Индикатор снабжен несколькими типами оповещений. Может применяться к различным торговым инструмен
                      TPSproTREND PrO
                      Roman Podpora
                      4.68 (25)
                      Точки входа по закрытию бара,   без перерисовки .  Сканер трендов   по всем активам,   режим MTF  и многое другое в одном инструменте. Рекомендуем использовать вместе с   RFI LEVELS. ИНСТРУКЦИЯ RUS   /   INSTRUCTIONS  ENG         /      VERSION MT5     Основные функции: Точные сигналы на вход БЕЗ ПЕРЕРИСОВКИ! Если сигнал появился, он остается актуальным! Это важное отличие от индикаторов с перерисовкой, которые могут предоставить сигнал, а затем изменить его, что может привести к потере средств
                      GOLD Impulse with Alert
                      Bernhard Schweigert
                      4.64 (11)
                      Этот индикатор является супер комбинацией двух наших продуктов Advanced Currency IMPULSE with ALERT  +   Currency Strength Exotics . Он работает на всех временных рамках и графически показывает импульс силы или слабости для 8 основных валют плюс один символ! Этот индикатор специализирован для отображения ускорения силы валюты для любых символов, таких как золото, экзотические пары, товары, индексы или фьючерсы. Первый в своем роде, любой символ может быть добавлен в 9-ю строку, чтобы показат
                      Hello Guys, Please check my MQL5 profile page for educational videos/strategies especially if you are going to BackTest the indicator. WinningSpell Indicator (No Repaint) shows Buyers and Sellers activity on any given chart and timeframe of any quote that is available in MT4 platform. It calculates those values by a sophisticated formulae that I have discovered a long time ago and improved over the years. It uses OHLCV values of every M1 bar to make the calculation for any timeframe by a formul
                      Представляю Вам отличный технический индикатор GRABBER, который работает, как готовая торговая стратегия "Все включено"! В одном программном коде интегрированы мощные инструменты для технического анализа рынка, торговые сигналы (стрелки), функции алертов и Push уведомлений.  Каждый покупатель этого индикатора получает дополнительно БЕСПЛАТНО:  Grabber Утилиту для автоматического управления открытыми ордерами, Пошаговый видео-мануал : как установить, настроить и торговать, Авторские сет-файлы для
                      UR TrendИсчерпание   UR TrendExhaustion - лучшее решение для трейдеров, которые не хотят иметь дело ни со значениями параметров, ни с другими настройками - оно простое и визуально понятное для всех. Преимущества использования UR TrendExhaustion: Нет параметров У вас есть 3 линии, которые лучше всего описывают то, что происходит на графике: линия истощения тренда, линия китовых денег и линия розничных денег. Интерфейс демонстрирует исчерпание любой линии на обоих крайних значениях (красные об
                      Другие продукты этого автора
                      SensorMap
                      Juergen Thielen
                      5 (1)
                      Concept Market arranges in Time upcoming Phases according to the present Results of its Interest. Directing Modulations are an Interaction of immanent Periods, which show in Reference to Time cyclic Activity and to Price leveling Activity. SensorMap is a reflecting Volume Mask of this Concept of Time and Price and apportioning developed Price Movements in an equalized 100 % - Range: how far moved ? indicating their Status by marking special Events: when which Action ? setting the Situation in a
                      FREE
                      Фильтр:
                      Daniel
                      929
                      Daniel 2023.07.26 17:01 
                       

                      Пользователь не оставил комментарий к оценке

                      Jamie Daniel Thompson
                      163
                      Jamie Daniel Thompson 2023.06.22 14:43 
                       

                      Extremely useful and incredible tool! I don't understand how this doesn't have 5 star reviews yet! It has totally changed the accuracy of my entries! Thanks to the author!

                      Ответ на отзыв