• Panoramica
  • Recensioni (2)
  • Commenti
  • Novità

PointZero

5

Concept

Market arranges in Time upcoming Phases according to the present Results of its Interest.

Directing Modulations are an Interaction of immanent Periods, which show in Reference

  • to Time cyclic Activity and
  • to Price leveling Activity.

PointZero is a projecting Price Mask of this Concept of Time and Price and

  • categorizing developed Price Movements related to their own Range: how far moved ?
  • indicating their Status by marking special Events: when which Action ?
  • setting the Situation in a functional Relation to the presented Support/ Resistance - Motive: miss/ hit/ pass ?


synthesize and project

Arrange with its underlying, grounding Components

  • Time Price Channel
  • Triple Pivot

and its conditional indicating Period Event Notation a situational Coordinate System.


Content

Time Price Channel

The D1/ W1/ MN - Channel consists of Shells around the ranging Center, which reflect the

periodic Alterations by its Separation in High-/Low-Bands and central Moving Averages.


Period Event Notation

Positions, Expansions and Distances are measured against the own Range,

as also against the Channelrange, of which a Period the Body and (Part of) the Move is.

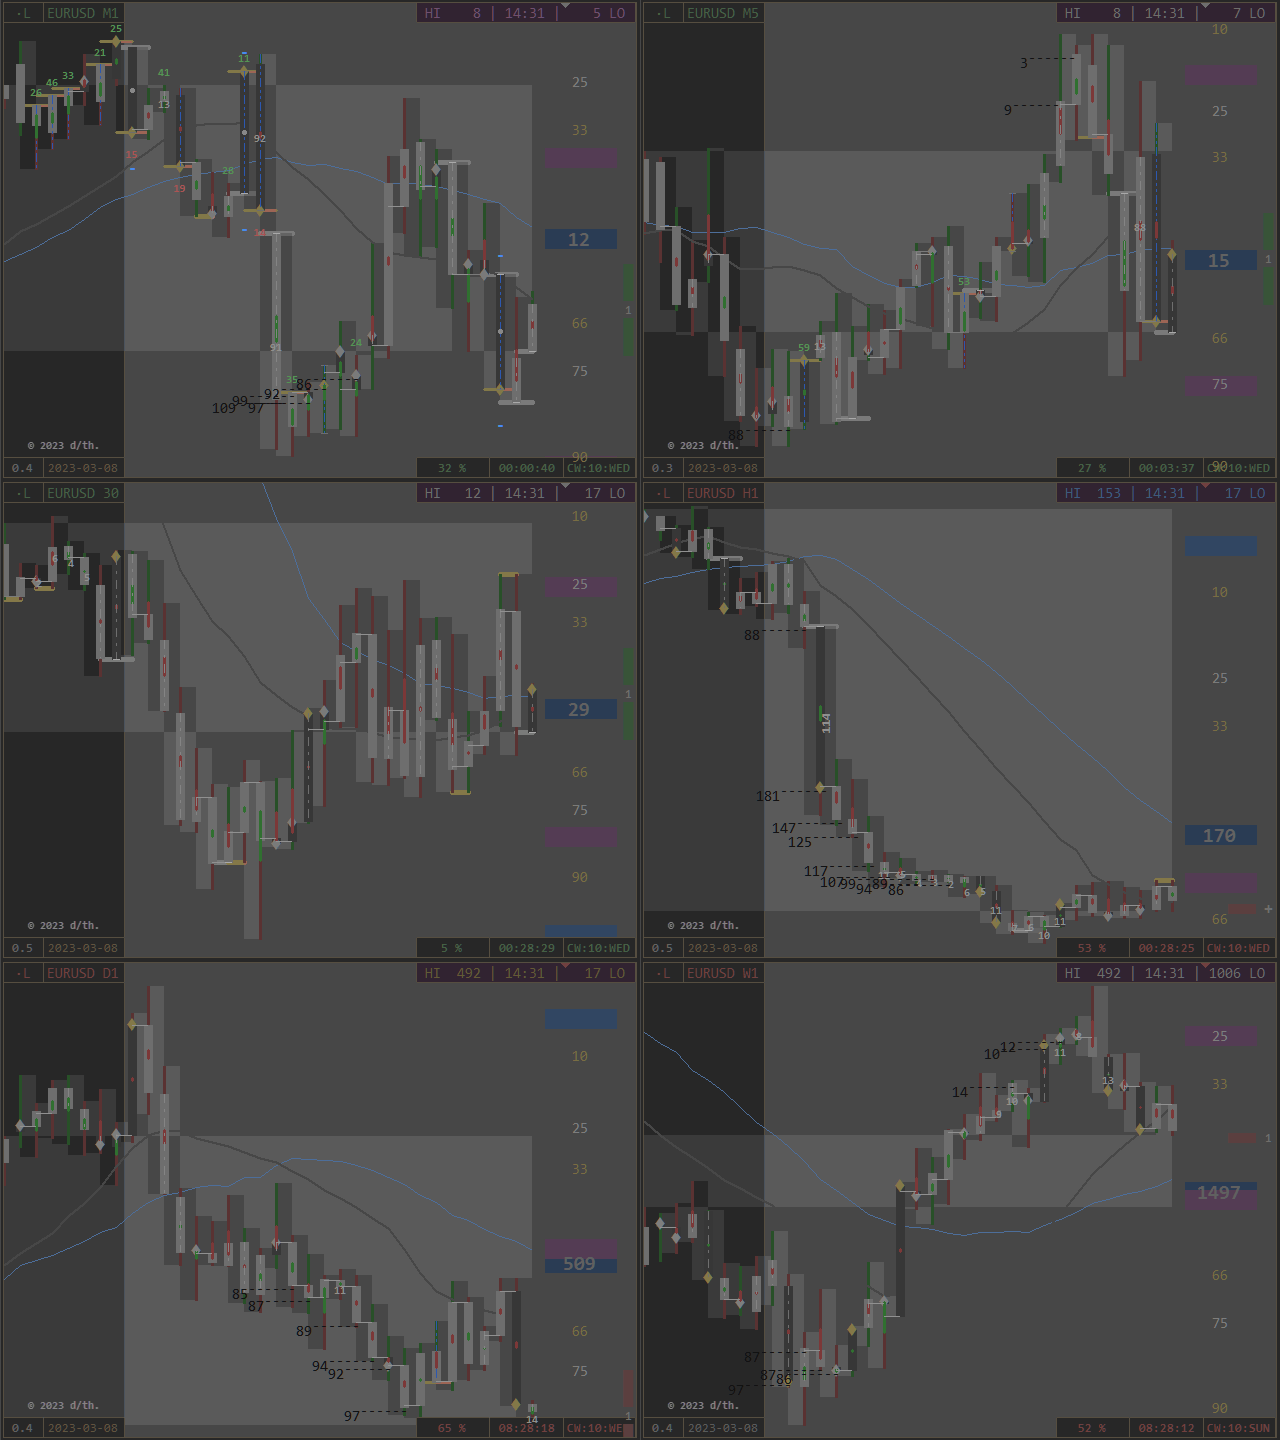
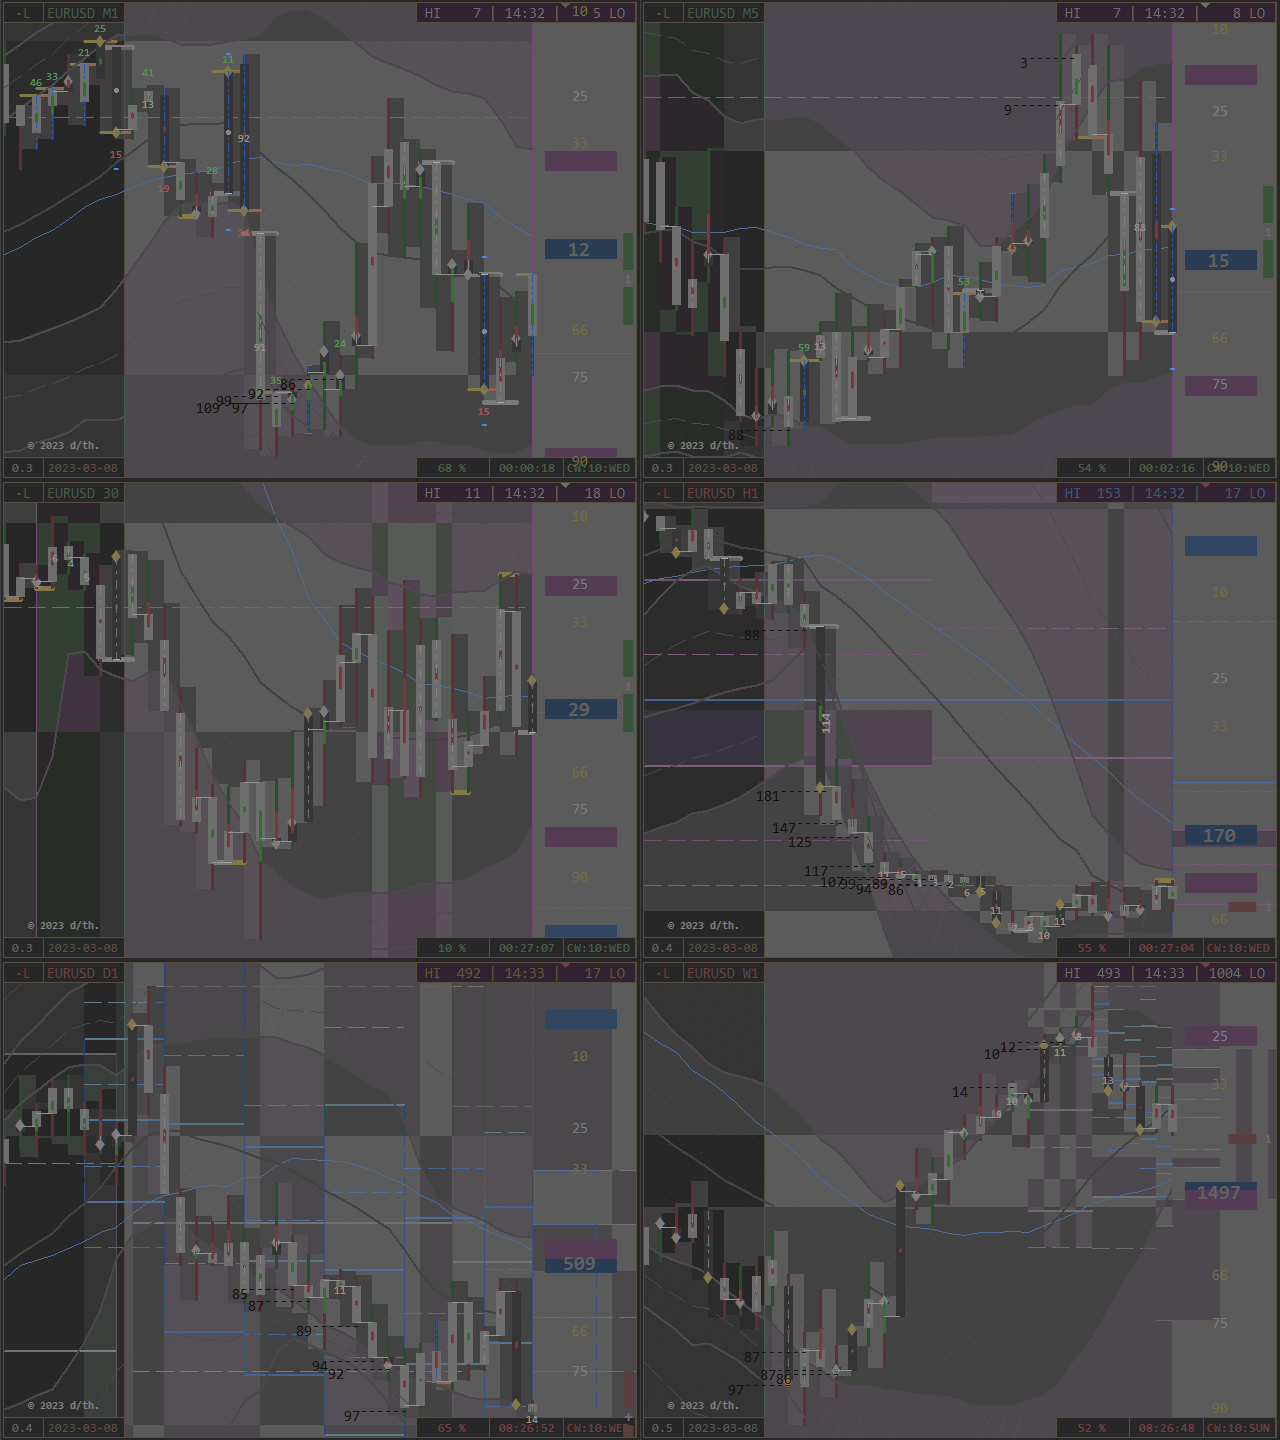
Special Events are displayed:

  • Close/ Open at High/ Low/ Center (colored Notes)
  • Break of weekly Channelbands (as Range Percentage)
  • Move 0 - 100 % of Range: Open to Close = High to Low (blue dotted Trend)
  • Move Proportions (white Values)
  • Offset of Move - Center against Range - Center (central Colortrend)
  • Parity of actual OHLC and previous OHLC (white Trend on Period and Offset Arrows on Scale)
  • Parity of up and down - Wick (blue Stars)
  • limiting Tick Values (Fraction Hits, green/ red)


Pivot Period Ports

D1/ W1/ MN - Pivots create besides their Portlevels a colored Background, indicating cyclic and leveling Phases.


Layers:

  • Projectors, Ranges and Scales (set PointZeros in Relation to their own and to the actual Channelrange)
  • Mirroring of Movements as Bars and Trendlines
  • Coloring of Bands/ Periods
  • Periods on/ off
  • geometrical Chartstructure with Universal Mask


Additional Benefits:

  • a positioning Autofocus
  • a Logbook as directional Protocol
  • a systemic Clock informs about periodic Phases (Pivot and Realtime)
  • a Screenshot Function (Button on Chart and as automatic Interval)
  • a detailed Definition of Objects and Functions by the Descriptive Mode (as Tool Tips)
  • an adjustable Price Column and automatic Chartfitting


Contemplate its Concentrate

The Signal Density is related to Markets actual Phase, chosen Timeframe/ Security and Components.

PointZero generates as resulting Composition a defined Setting of Support and Resistance:

No Matter which Hemisphere: [ Open = Support | Resistance = Close ]


Both look like the Other.

The MindMask resolves the active Status.


A Picture is worth a thousand Words.

Indicative : Colorized : Universal


Please find all necessary Informations to this Product in its Compendium.

Below as Orientation the Extract of the individual Indicator-Adjustments.


Indicator PointZero

Think global - Act local


[VALUE] =

  • Boolean: Button Position on Chart
  • Cn: Corner n0 to 3 (left upper to right lower)
  • Variabledefault Value


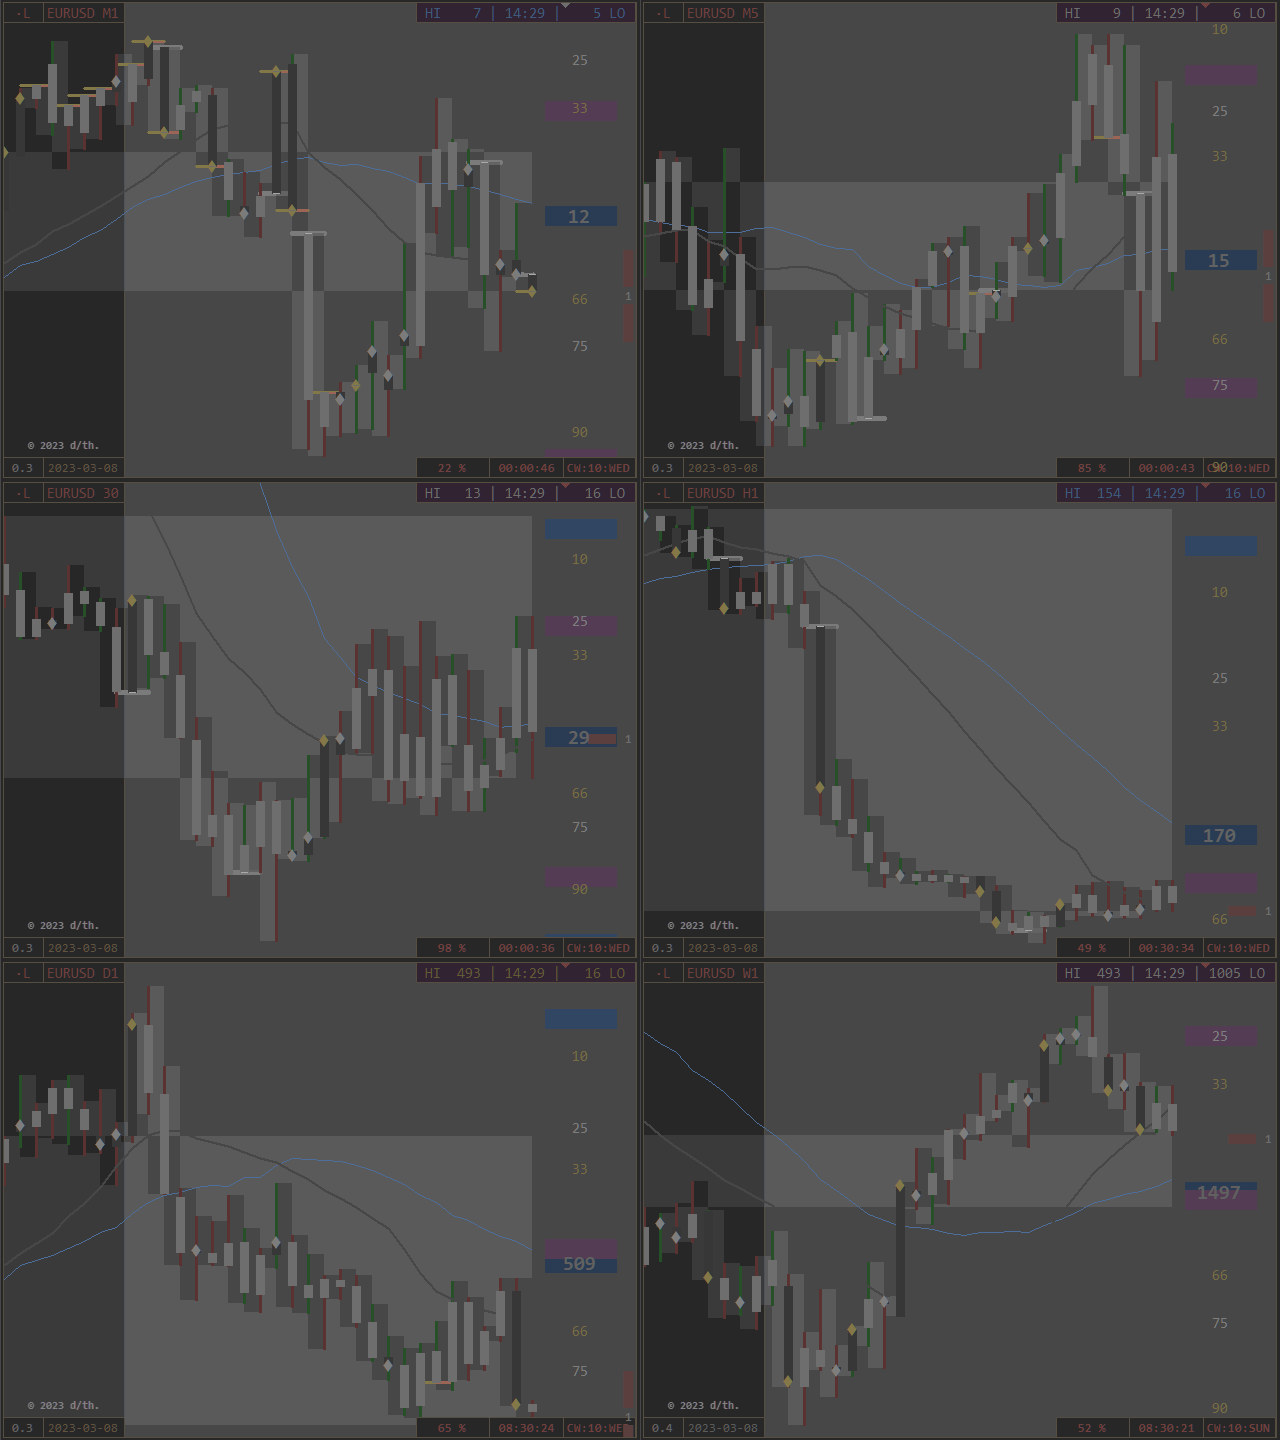
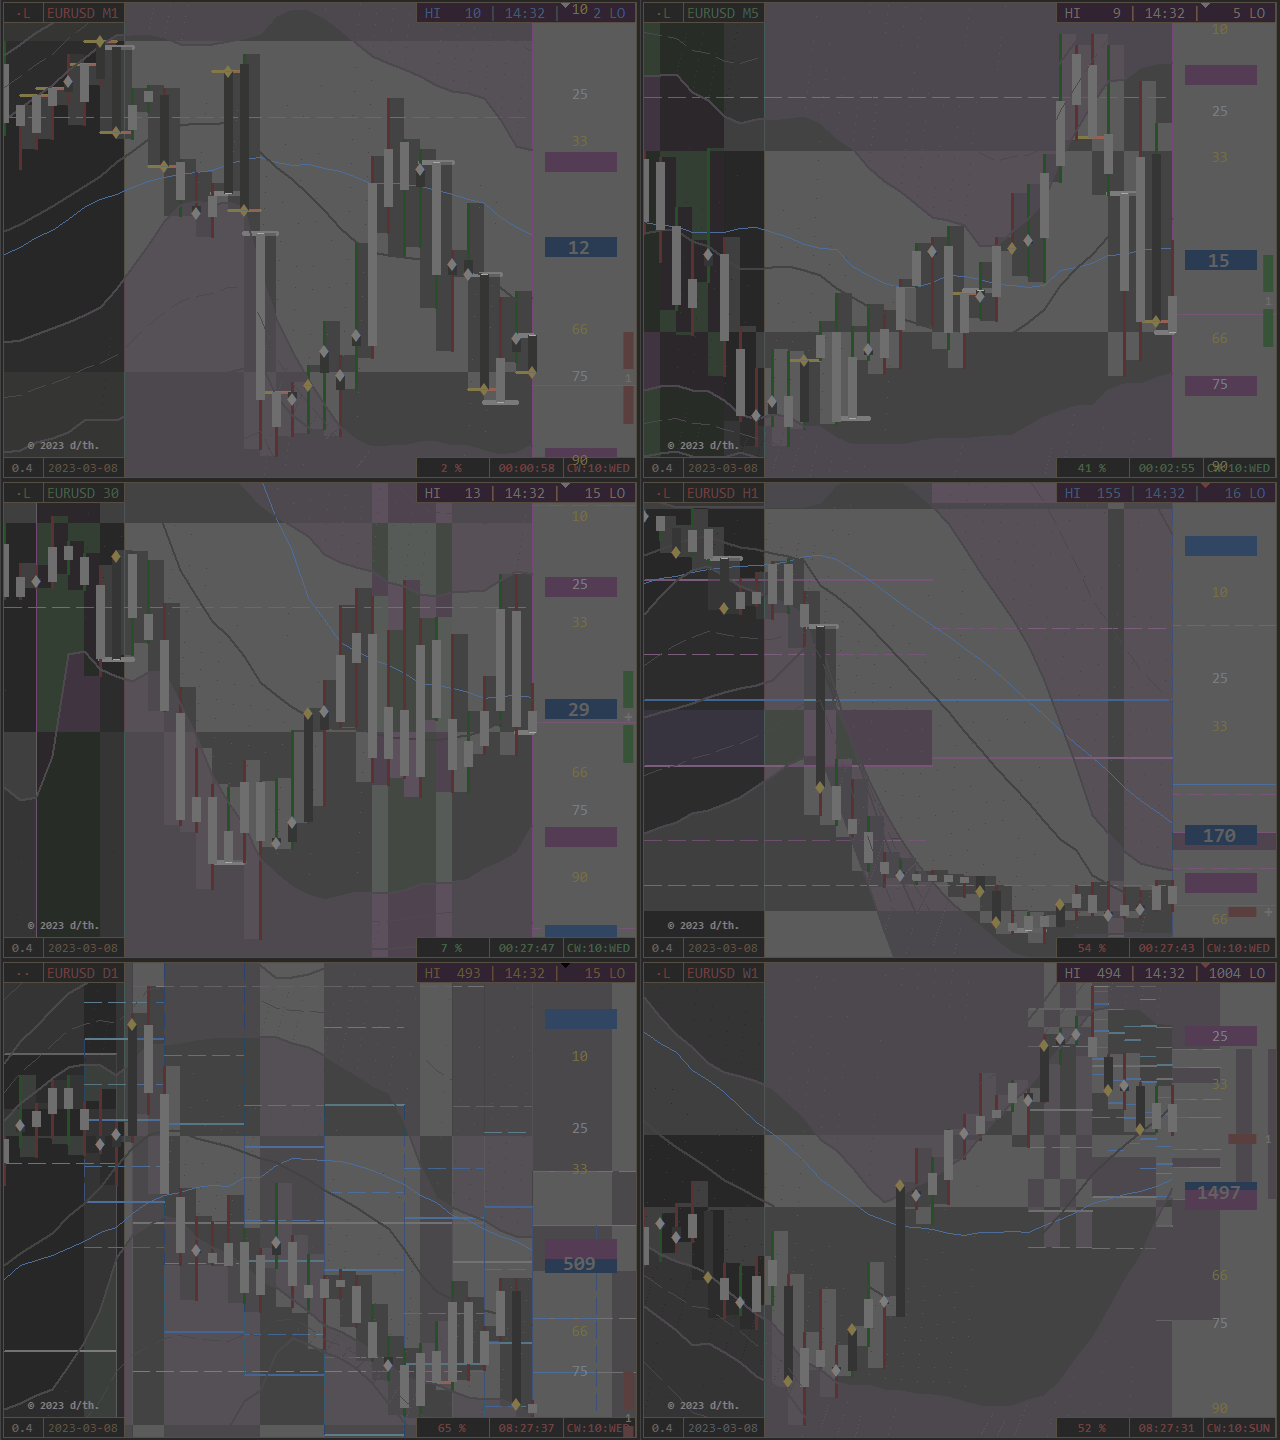
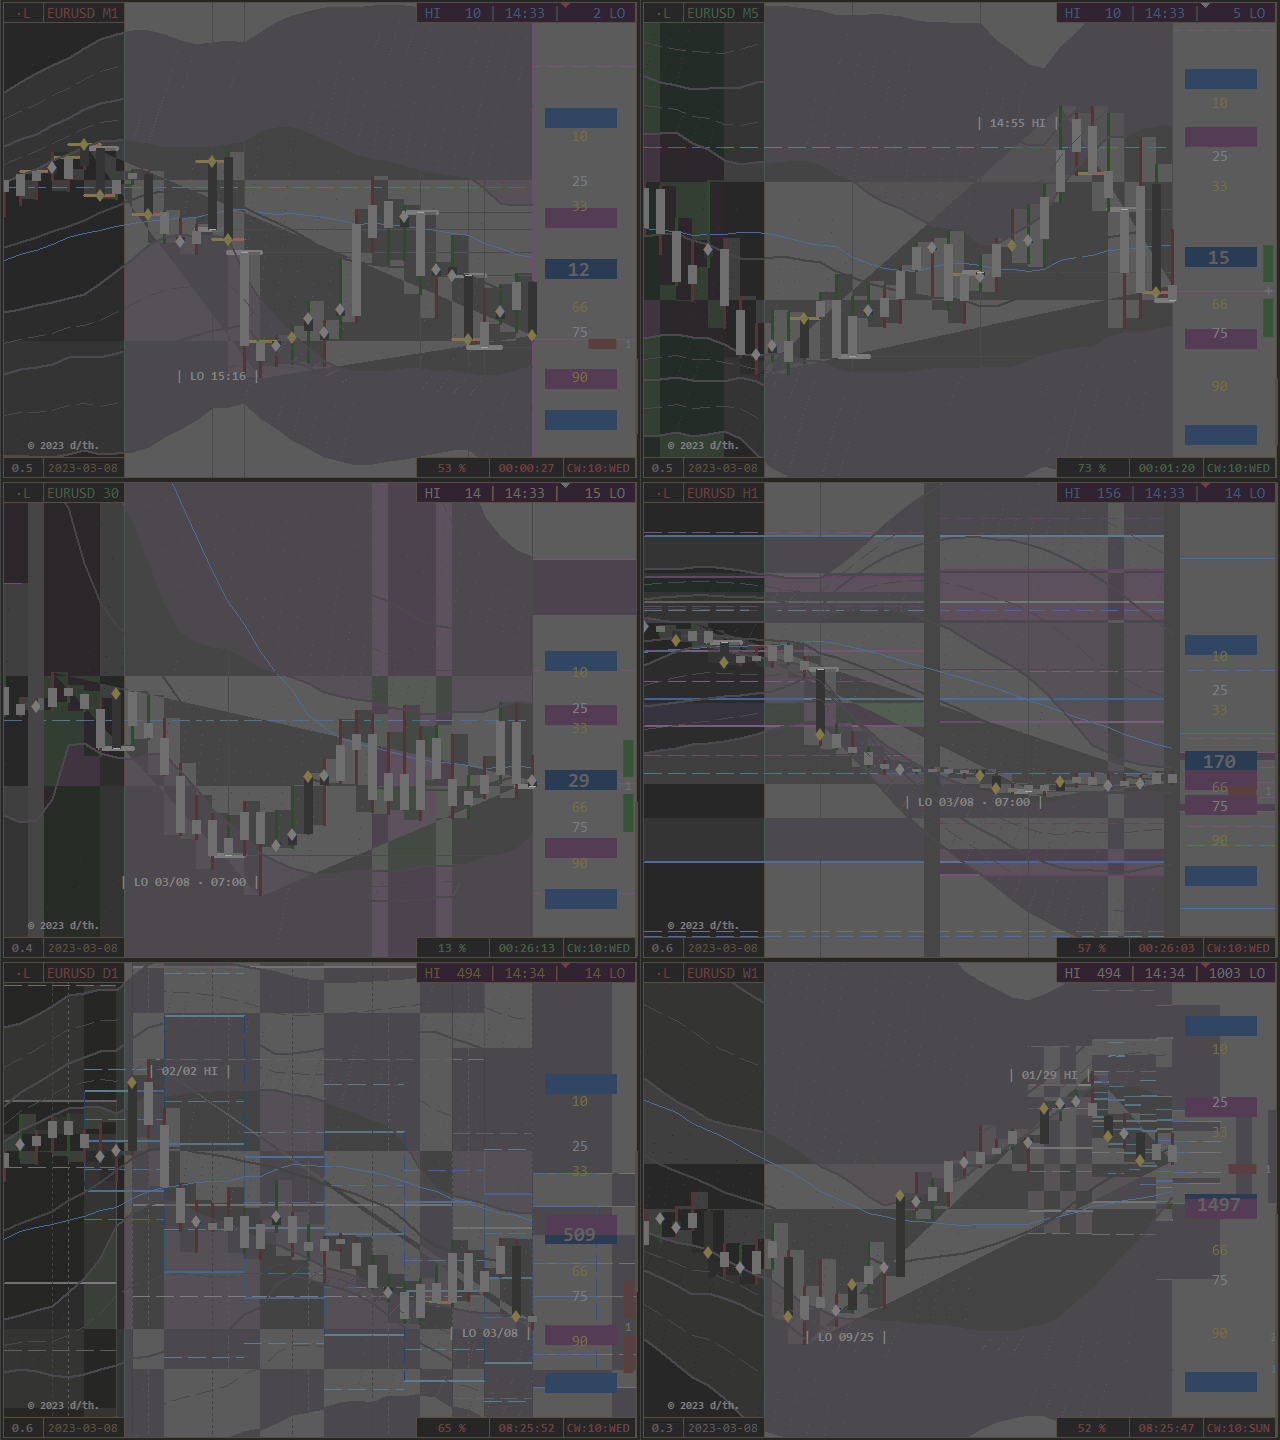
The default View of the Chart consists of following Components and is read like follows:

Move: Trace dark-gray/ Trend bright-gray

works as moving Range and ranging Move.

central MA: daily gray, weekly blue

Range Color by Open: Offset to prior Close/ Open/ Center (conditional)*

Note*: no separate Center-Color, the Open is passed by/of both Directions.

Close Color by Move: Offset to prior Open (= actual)

  • directional on: Null = white/ Full = orange
  • navigational off: up = green/ down = red
  • PointZeros off: noted by a white Haircross,

Toggle Close Signal via Countdown-Button.

Every Period works by its own Range-Shadow with the variable Chart-Coloring.

Identify their Phase by Coloring the Ranges with Button in Corner 3 most right (CW:WD)

Visual of centered Range-Creation and -Filling:
The Chart generates a (mostly central) gray Zone as Spread between

the highest Low and the lowest High of the visible Chart-Periods.


[5.1] Bools (on/ off) 

Code = Logic = Notation of Ordination


[5.1A] Fundament

Body of Chart


The first Options are the framing calculatoric Fundament of any Indicator Processing.

The visual Conjunction of both Mask-Complements delivers accidentially extra Room

for additional Buttons in the Sub-Chart, to have direct Access to these three Core-Options.

Bands and Pivots define the periodic Arrangement,

on which the Pen notes its designing Movements.

The Colors of Channel and Pivots cooperate = they are softened or amplified

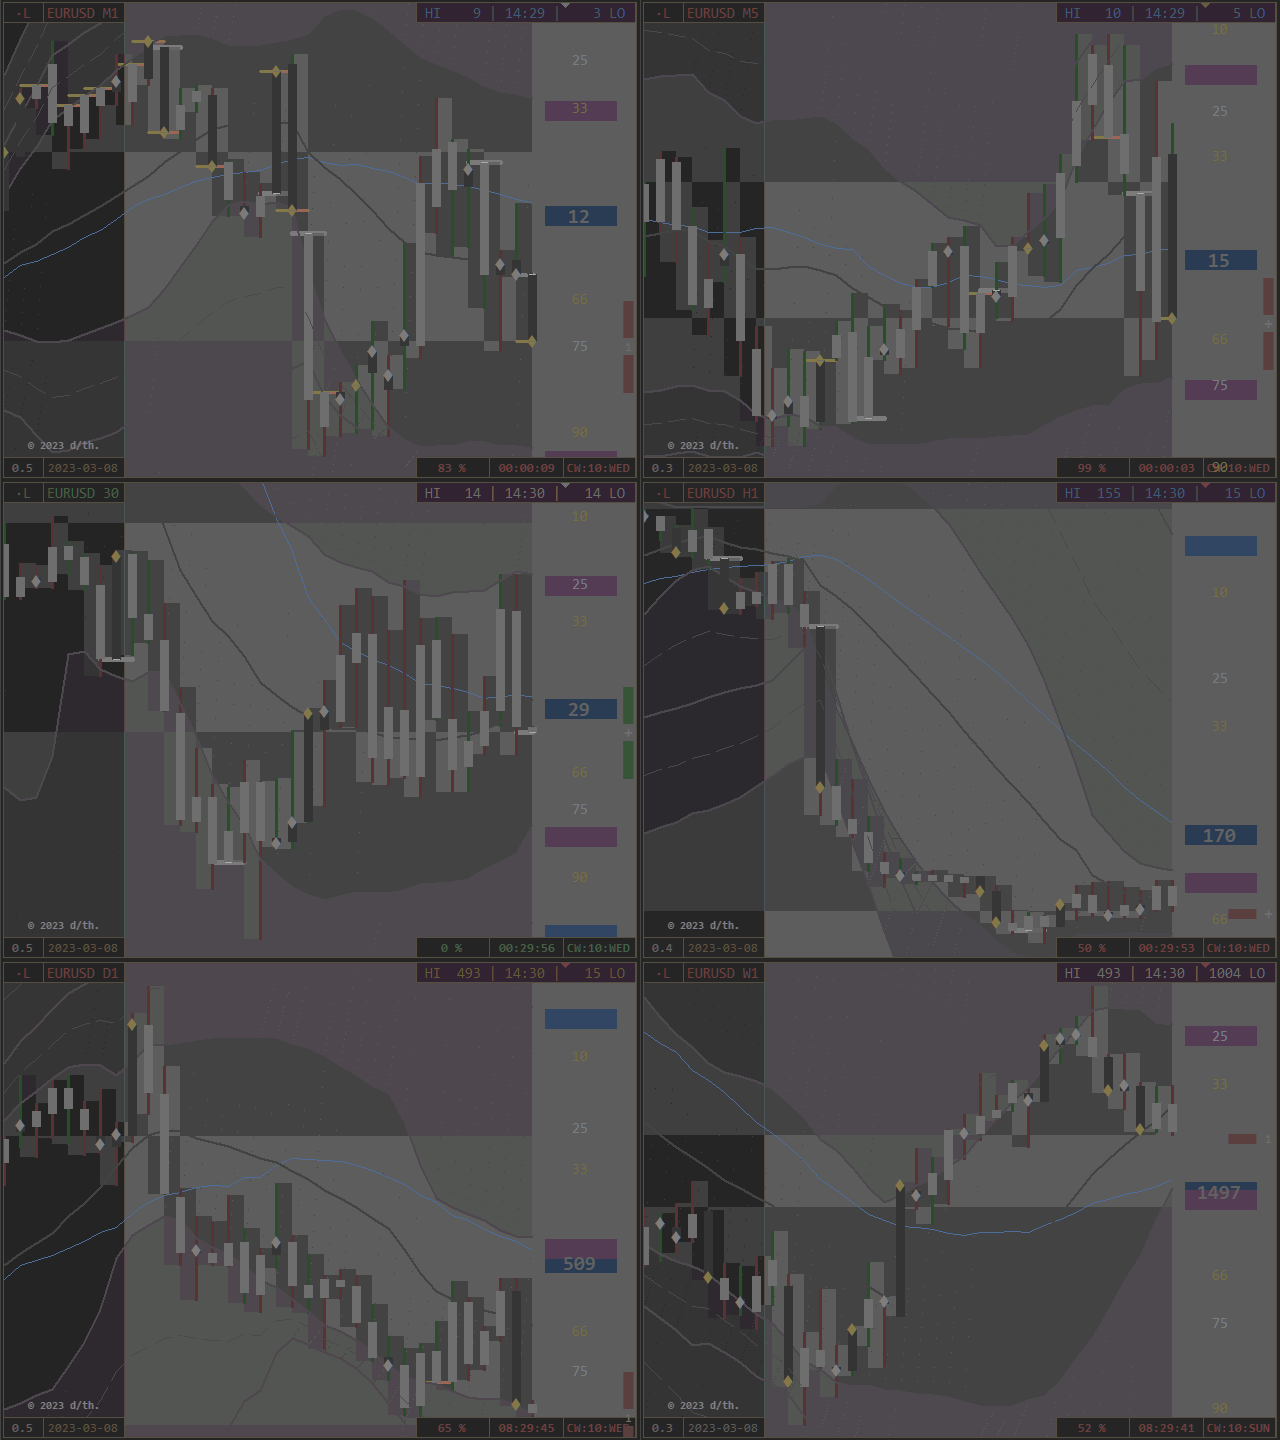
and process accordingly to the Color Theory an indicating Background Tone.

The overlaying Period Event Notation is called by variable Conditions and

visualizes the Tracing/ Trending of Bull and Bear in their Habitates/ Hemispheres.


Time Price Channel [SUB]

To identify its Construction fully, colorize its dimmed Trendlines by Countdown-Button [C3]

(or preadjust via Colored Bands in Options).

  • hemispheric = 2 x 50% Coloring Ranges, depicted as colored Shells
  • gray D1, blue W1 Center = 0
  • Shells divided by Center-Trend
  • asymmetric Appearance due to separate Calculations 
  • of High and Low - Bands and central Moving Averages
    • Definition of Moving Average
    • variable Price Line 
    • Price of Time = external Argument
    • Definition of Channel-Band
    • constant Time Line 
    • (ime of Price = internal Argument

3-lettered Abbrevations on Price-Column:

  • Timeframe: MN = M, W1 = W, D1 = D
  • + Position HILO
  • e.g. WLO = Low of W1 - Channel (blue)


Period Event Notation [SUB]

special Contemplation of conditionally called absolute and/or relative Events:

  • Gator: 0-100 = Zero + Full Move
    • blue dashdot Centertrend on Period
    • notes new Phases (Caution)
  • Range/Move - High/Low (RH/ RL / MH / ML)
    • white move-connecting Trendline on Period
    • notes Stator/ Rotor - Function by Open Position of Period
  • Offset Move-Center against Range-Center 
    • colored Centertrend: green = North, red = South (directional)
    • notes potential/ tendencial Phase Shifts
  • periodic Centers in superordinated Range
    • white Value on Period if Close = 50% and < 15% or > 85% in D1-Range
    • notes near to Edge - Horizons in D1-Channel
  • Values beside Periods (connected with Dashes to Close)
    • if Close beyond W1 - Bands
    • note relative Barriers for overshooting Level-Phases
  • Tick Fraction Hits, as green and red Values
    • calculatoric Base is the Relation of Period Expansion and Volume
    • note expansional Edges of Time/ Price/ Tick
  • bright blue Double Points (Stars)
    • equivalent balanced/ central Position of Move in its Range
    • note Periods, which have an equal Size of their "Wicks"


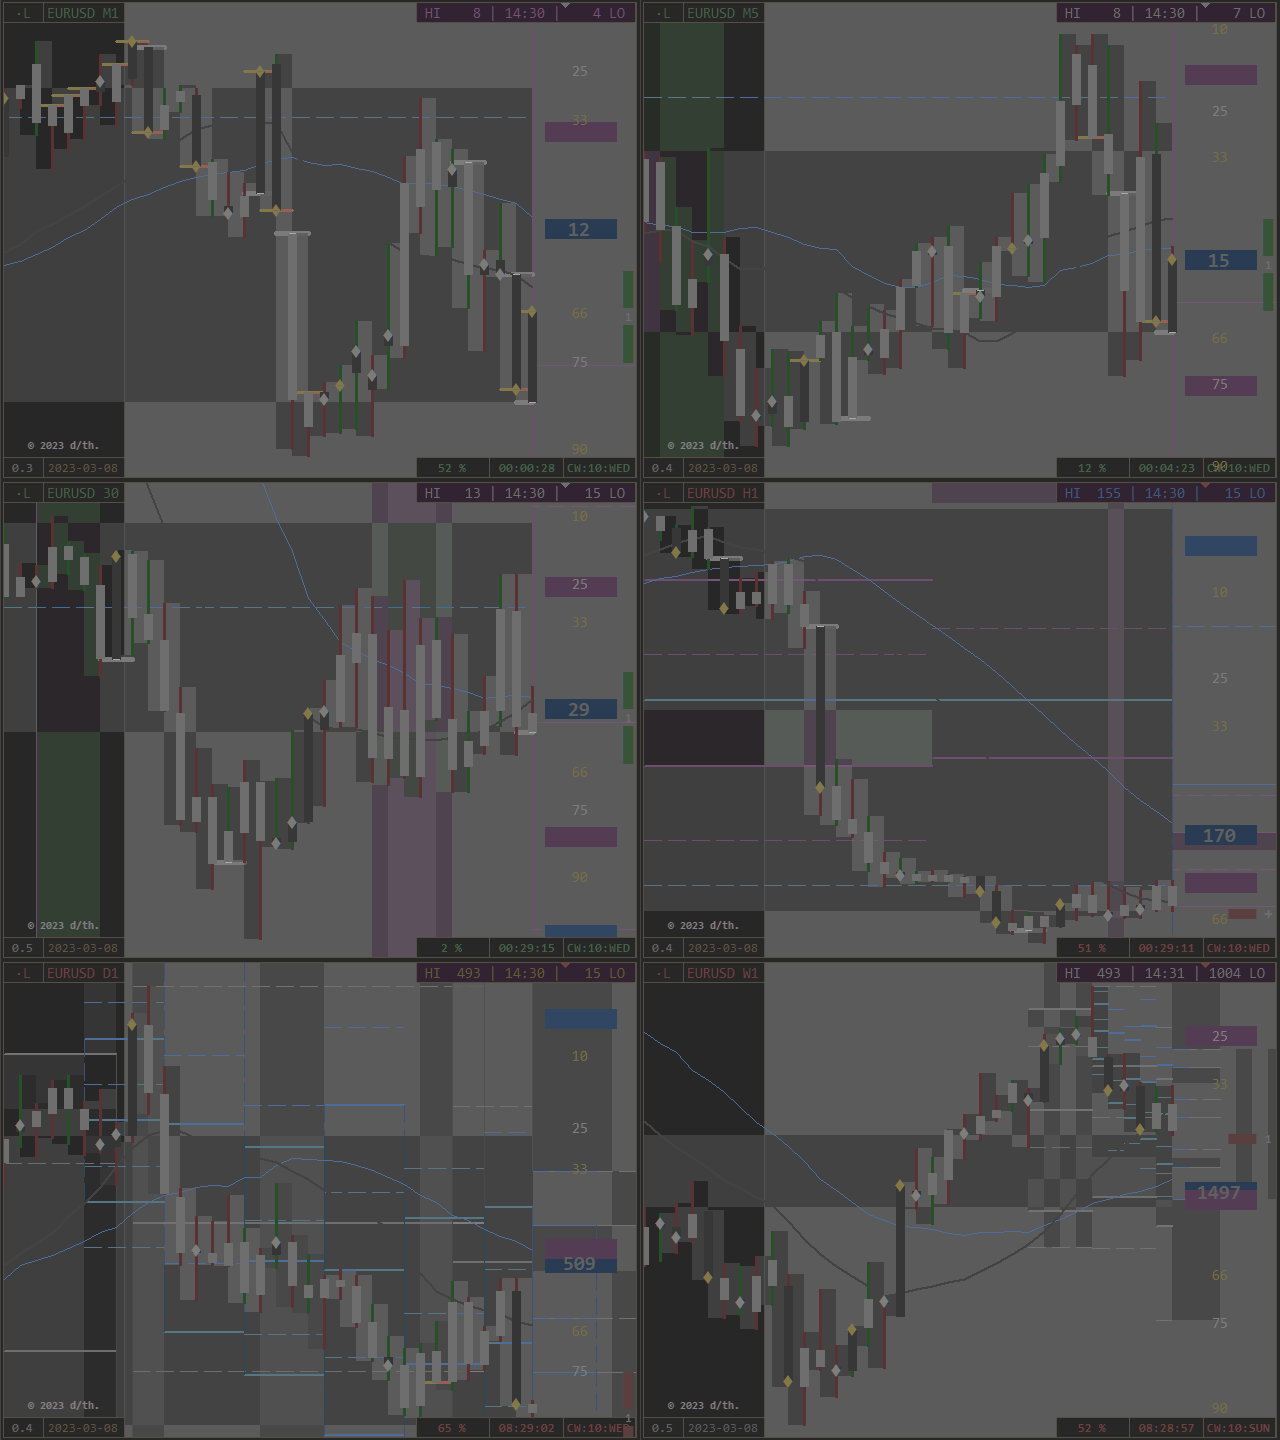
Pivot Period Ports [SUB]

Enjoy freestyle Combinatory for 3 main + 1 sub Pivot ((MN/ W1/ D1) + H4).

universal Standard:

Pivots are processed Period-Gates and describe a superordinated Sequence of Market.
Equipped with cyclic and leveling Zones (colored Background), which note

  • by Time the first, central and last 10% of the Cycle Range 
  • (Visibility timeframe-dependent, adjust accordingly if necessary)
  • by Price the 66-75% of North and South Level-Range 
  • (Visibility chartscale-dependent, use implemented Autofocus if needed)
3-lettered Abbrevations on Price-Column:
  • Timeframe: MN = M, W1 = W, D1 = D, (H4 = H)
  • + Direction (N, S)
  • + Level (1, 2, 3)
  • or Pivot (PP)
  • e.g. MN1 = Monthly Pivot (white) Level 1 in Northern Hemisphere
Due to the inequal Hours of a Real-Time Week related to respective Weekdays

(last two Hours of Friday are processed on Sunday)

  • additional and isolated Sunday-Pivot.


Functions

Being develops from Within.

Equal Interest is generic.


The next five Options are Instruments for an extended Chart-Appearance and flexible Functionality:

[PRICE] Auto Focus:

Visual Flexibility, automatic

  • toggle by Click on the Price-Column (most right)
  • calculates the Chart-Dimensions related to the actual Move-Development
    • creates Room on active Hemisphere
    • more Range if Trend/ more Move if Trace
    • Sensitivity indicates upcoming Activity (Work on Tipping-Points)
  • situative fluid Chart Impression (Scalation of developing Range = relative)


[SCALE] 2 x Period (Range + Move):

Visual Flexibility, manual

Isolate Range and Move by Click-through:

  • toggle by Click on the Scale-Column (2nd right)
  • first Click = minus Move, shows blank Period-Range
  • second Click = toggles Range and Move, shows blank Period-Moves
  • third Click = all back

Not intended for Live-Use and, to avoid Mis-Clicks not accessible of the Chart, but via Options-Menu:
switch Periods completely off with both Options false => complete free view.

All Layers stay functional.


[PROJECTOR - TOPProtocol Role:

Data Divisioning, Sentence

The Protocol of periodical Events can be set to Autostart for sufficient wide charts.

Chart-Auto-Scroll has to be active.

According to the Chart-Concept it is divided in componental Columns of TOHLCV,
inclusive full Legend via Tooltip.

From left to right:

  • Period Time/special Occurrences
  • positioning Range Open Side
  • central periodic Function (two Roles)
  • navigating Move Close Side
  • Period Volume/special Occurrences
  • switch on/ off (completely) on Chart via Projector - Button
  • leave with staying Panel as Placeholder by direct Click on the List
The Placeholder-Panel is generally accessible by direct Click on it (most left Column).
It is in flat Markets potentially supportive for the Resolution, because MT-Scale-Calculations

are situatively adjusted by Reduction of Periods (optional in Conjunction with Autofocus).


[REFLECTOR - BOTUniversal Mask:

Data Divisioning, Sequence

  • Open/ Close at High/ Low/ Center (Notes/ Dashes/ Crosshairs)
  • Open/ Close - Grid, PointZero Support-Resistance Graduation
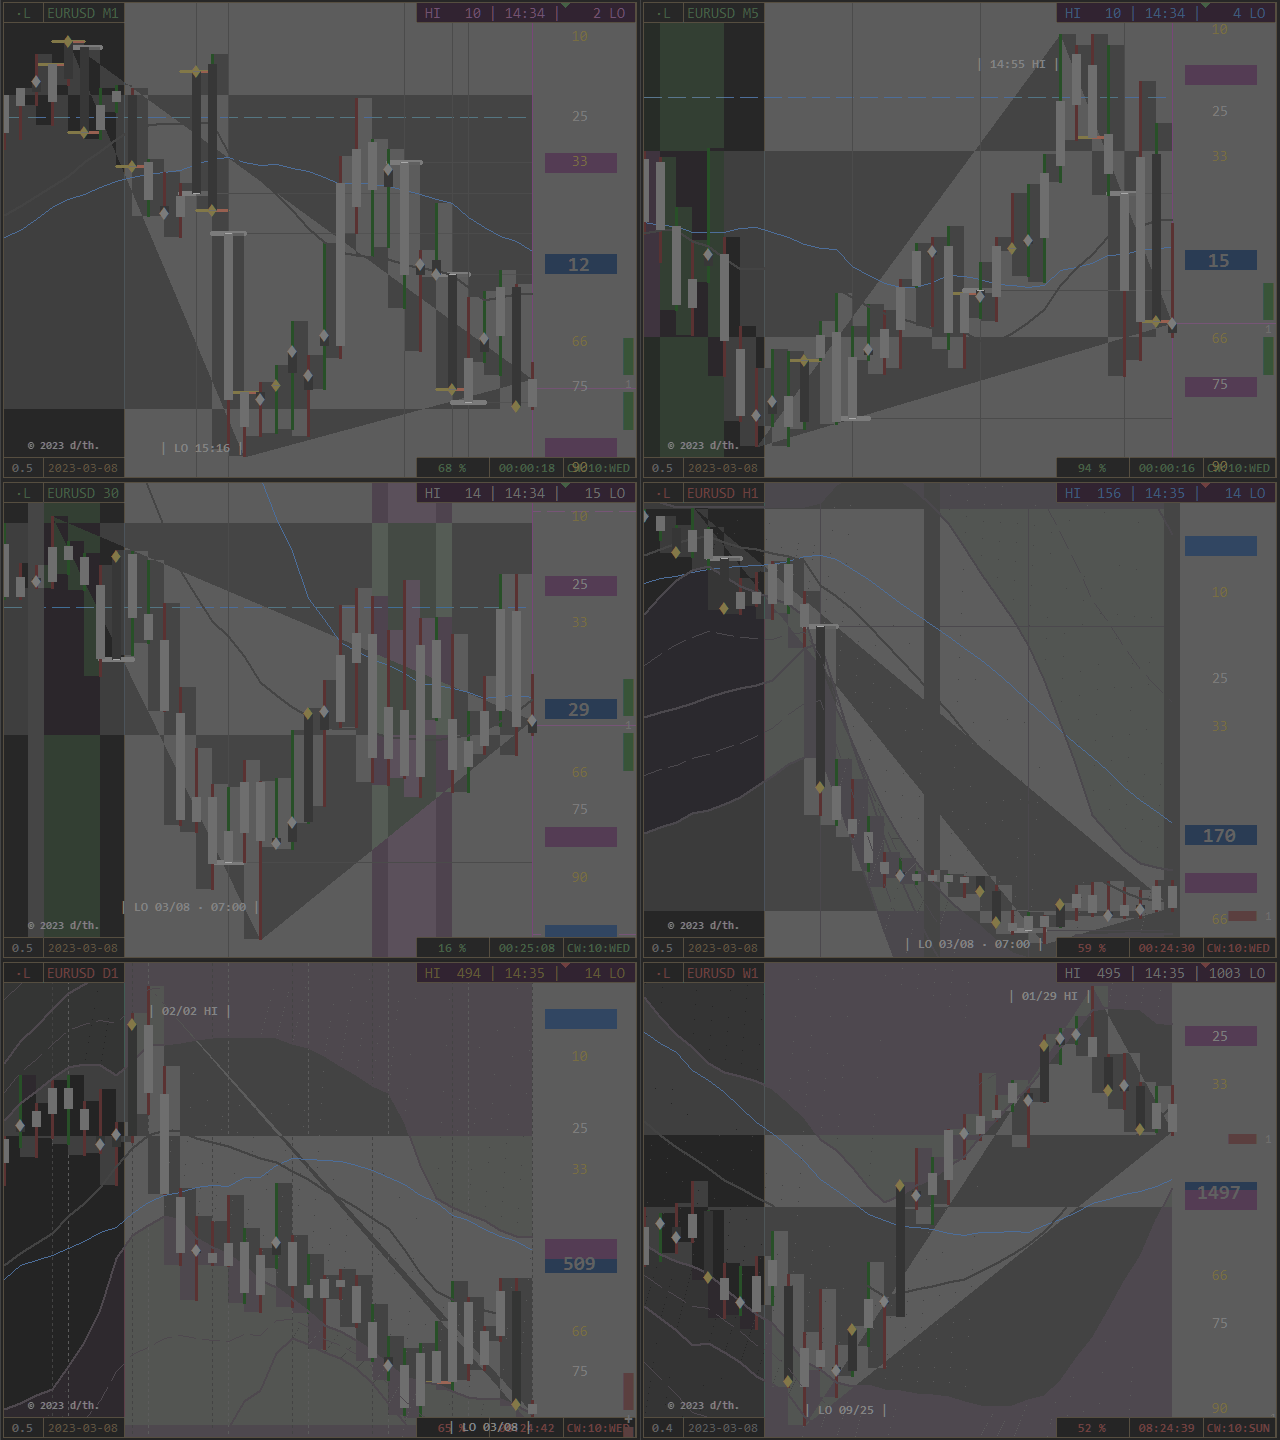
  • High/ Low/ Bid - Cone of Light (Chart Phase Scope)
  • High/ Low - Chart-Time of visible Periods (white, on Chart: timeframe-sensitive)
  • High/ Low - Chart-Price of visible Periods (white, on Price-Column: CHI = Chart High, CLO = Chart Low)

Indication of weekly Realtime-Transition Wednesday and Thursday

    • Odin = Ministrant/ Mantle/ collects = Close of Phase
    • Thor = Kloeckner/ Hammer/ strikes = Open of Phase

appears on Timeframes > M5 as underlying Histogram-Ray (chart-traversal)

  • if Zero = Close at Open/ High/ Low/ Center: white dash, notes Edges and Centers of Phases


Following Layers are Product of a special Contemplation

of the inner and outer Relations of Open and Close.

Move-Info

DisplayPosition + Direction + Function + Phase

[TOP] Echo Bars:

  • mirrored Bars, directional colored according to their respective Period-Direction,
  • adds an inverted Visual of Movements and forms functional Helix.

[BOT] Echo Trend:

  • mirrored Open- and Close-Trendlines, white = Open and orange = Close,
  • notes separately the leading Component of a Period as Heartbeat-Trend.


Layers

projective Reflection = reflective Projection


The Card Deck:

2 Buttons Corner 0TL

most top-left:
Order-Tool
  • first Letter = Pivot, second Letter = RealTime
  • DisplayC = Cycle/ L = Level/ Dot if not

Symbol - Button:

Clock

  • Market is clocked realtime to the real World by own Interest via cyclic and leveling Events.
  • Button Top right Corner 1 (Screenshot-Button) shows VOL (Volume/ Volatility)
  • Phases MN = M/ W1 = W/ D1 = D
The actual Time-Phase correlates with actual valid Price- and Volume-Phases 
and defines the timely Range of the pricely Movement. 
Price confirms this defining Call as designed Reflection.
Equal Colors cooperate through all Dimensions.


1 Button Corner 1TR

  • Clock Display
  • Screenshot, saved as GIF in \\DataFolder\MQL\Files\


2 Buttons Corner 2BL

Spread-Button (first, left) extends Button Row:

Activate four additional informational Buttons beside Protocol/ Interactive Mask,

which give access to the separate Chart Projectors. 

Note:

The following Layers are Product of the Projection of PointZeros to the actual processed Range and Move.

According to the Separation in Cycles and Levels, the direct

  • Projections as Light Cones are separately accessible.

Ranges and Scales are functional combined, and both are

  • by time: white/ blue and
  • by price: green/ red colored.

All have their conditional Appearance according to

  • Timeframe/ Security and Presence of Conditions 
in common.

Thus, Event-Density and -Impact

  • according to relative Distribution and Correlation of present Potentials!

Because of this, they are directly accessible by Chart-Button, or via Options automatically activated.

Choose of limitless Adjustability for Templates!

Due to their steady Interaction with the present Period they develop

and work actively (if enabled), until the PointZero leaves the Chart.


    From left to right:
    Time-Price-Button:
      DisplayServer-Time + Bid
      FunctionPointZero - Level Scaling
      • TOP Level Ranges
      • absolute and relative Plot of High/ Low - Ranges of respective PointZeros, 
        • Color navigational/ positional
      • BOT Phase Scales
      • absolute Division of respective PointZero - Range, 
        • overlying Variable notes TOHLCV - Position of next directive Call


      TPP / PPT - Button:

        Display: Productivity

        VPP = Volume per Period:
        Protocol List/ Center on TimeBand
        absolute (= Frequency)
        Impulse / Period
        Sensitivity 15%

          TPP = Ticks per Pip:

          • relative (= Alteration)
          • Impulse / Pip
          • Sensitivity 33%

            PPT = Pips per Tick:

            • total (= Oscillation)
            • Pip / Impulse
            • Sensitivity 50%

              Please further Informations to external Productivity in Section [7.0].


              FunctionPointZero - Projector (Beams)

              • on Top = Cycle
              • on Bottom = Level


                Both Projectors are setting their own Range Position in Relation to the actual Range Position,

                depending on their individual cyclic/ leveling Function.

                They work according to their Function and related to the individual Chart-Situation 
                as 
                ranging Barriers (Resistance) or 
                moving Tractors (Support).
                  Their Update-Frequency is by Tick, that means: they adjust in Cooperation with the 
                  actual Development, as long as their Period is on the Chart visible (if enabled).

                  Date-Button (second, right)
                    • Toggles the Period-Scale and 
                    • navigating Arrows RH/ MH/ ML/ RL, noting their Offset to their prior Position.
                    • Periods: Support white - Resistance orange


                      3 Buttons Corner 3 = BR

                      Colorize Channel Bands and Period Ranges to identify their Classification/ Function:

                      • Step = violet = D1 
                      • Lift = blue = W1
                      • Null = white = MN
                      • Full = orange = H4

                      left: [Period-Percentage] = colored Periods

                      note the classified State of Period-Moves

                      right: [CalendarWeek:WeekDay] = colored Channel-Bands
                      note the classified State of Period-Ranges = Channel-Shells/ Levels
                      center: [Countdown] = Close Signal

                      initially not shown, here on/off


                      Adjustments of general Nature:

                      • The Descriptive Mode is useful for Orientation or Confirmation (of not finally settled Experience).
                      • Extend the Pivot by H4 for smaller Timeframe Analysis.
                      • The MT4-Scales are a "fundamental Adjustment". I cannot resolve them..


                      Integer/ Double

                      constant variable = variable constant

                      The Icing:

                      • Protocol Role0 = Func (Function) / 1 = Bube (BullBear)
                      • Offset Price: position Price by whitchever Intent
                      • Shorten Digits: 6 Digits can be shorten to the preferred Length

                      • Screenshot 
                        • Interval: 0 = off
                        • Integer above 0 = Interval in Minutes
                        • adjust in Height and Width
                        • saved as GIF in \\DataFolder\MQL\Files\


                      Please find all necessary Informations to this Product in its Compendium in its respective RadioPhase - Blog.


                      logiclaboratory studio
                      © 2018-2023 /thiejden.


                      Recensioni 2
                      Jamie Daniel Thompson
                      163
                      Jamie Daniel Thompson 2023.06.22 14:43 
                       

                      Extremely useful and incredible tool! I don't understand how this doesn't have 5 star reviews yet! It has totally changed the accuracy of my entries! Thanks to the author!

                      Prodotti consigliati
                      Wise Men Indicator demo
                      Bohdan Kasyanenko
                      3 (2)
                      The indicator displays signals according to the strategy of Bill Williams on the chart. Demo version of the indicator has the same features as the paid, except that it can work only on a demo account . Signal "First Wise Man" is formed when there is a divergent bar with angulation.  Bullish divergent bar - with lower minimum and closing price in the upper half. Bearish divergent bar - higher maximum and the closing price at the bottom half. Angulation is formed when all three lines of Alligat
                      FREE
                      Introducing the Consecutive Green/Red Candle Alert Indicator for MT4 - Your Trend Spotting Companion! Are you ready to take your trading to the next level? We present the Consecutive Green/Red Candle Alert Indicator, a powerful tool designed to help you spot trends and potential reversals with ease. Whether you're a new trader looking for clarity in the market or an experienced pro seeking additional confirmation, this indicator is your trusted companion. Key Features of the Consecutive Green/Re
                      FREE
                      SensorMap
                      Juergen Thielen
                      5 (1)
                      Concept Market arranges in Time upcoming Phases according to the present Results of its Interest. Directing Modulations are an Interaction of immanent Periods, which show in Reference to Time cyclic Activity and to Price leveling Activity. SensorMap is a reflecting Volume Mask of this Concept of Time and Price and apportioning developed Price Movements in an equalized 100 % - Range: how far moved ? indicating their Status by marking special Events: when which Action ? setting the Situation in
                      FREE
                      Free automatic Fibonacci is an indicator that automatically plots a Fibonacci retracement based on the number of bars you select on the BarsToScan setting in the indicator. The Fibonacci is automatically updated in real time as new highest and lowest values appears amongst the selected bars. You can select which level values to be displayed in the indicator settings. You can also select the color of the levels thus enabling the trader to be able to attach the indicator several times with differe
                      FREE
                      Cet indicateur innovant de mesure de la force des devises de INFINITY est une aide indispensable pour les scalpers et les commerçants qui négocient à long terme. Le système d'analyse De la force/faiblesse des devises est connu depuis longtemps et utilisé sur le marché par les principaux traders du monde. Tout commerce d'arbitrage n'est pas complet sans cette analyse. Notre indicateur détermine facilement la force des devises sous-jacentes les unes par rapport aux autres. Il affiche des graphiqu
                      FREE
                      TrendPlus
                      Sivakumar Subbaiya
                      4.15 (13)
                      Trend Plus   Trendplus  Indicator   Time Frame: Suitable for any time frame.  Purpose: Trend Prediction. Blue and red candle indicate the buy and sell call respectively. Buy: When the blue candle is formed buy call is initiated. close the buy trades when the next red candle will formed.   Sell: When the Red candle is formed Sell call is initiated. close the Sell trades when the next blue candle will formed.   Happy trade!!
                      FREE
                      SuperMac Free
                      Agus Wahyu Pratomo
                      4 (1)
                      FREE VERSION ONLY USE LOT SIZE 0.01 TO UNLOCK IT GO HERE  https://www.mql5.com/en/market/product/61498 SuperMac EA is a trading robot  for the trading on forex and trades  Scalping  Strategy and Tren Follower. This is a Trend Following system that trades in all session.   It use Multi Complex Algorithm to determine tren behaviour.  EA optimized on EURUSD, GBPUSD and NZDUSD (Use together) but can be use on other pair  Use PAIR can use 3 pairs (recommended to maximize profit) at the same tim
                      FREE
                      The   OHLC indicator   shows the current and historical values of High, Low, Open, Close and Mid for a specific time period. It can plot the current values or the values from the previous session. The indicator's range can be calculated from a daily, weekly, monthly, or user-specified session. Levels High  of the current or previous session. Low  of the current or previous session. Open  of current or previous session. Close  of the current or previous session. Midpoint  of the current or pre
                      FREE
                      This indicator is a perfect tool able to compare which brokers have the lower latency. It shows us immediately which brokers are slower or faster. When you see the dot icon on the line, it means this broker is the faster one and the red line (Broker_A) is the slower one. See the example on the screenshot. How It Works? This indicator shares the prices information to and from the "shared" common data folder. It compares all the prices. The price is based on average by (Ask + Bid) / 2. There are
                      FREE
                      UPD1 Rsi Dots Dashboard
                      Vitaliy Kuznetsov
                      5 (1)
                      L'indicatore mostra segnali basati sull'oscillatore RSI terminale sul grafico. È possibile filtrare i segnali ripetuti. Qui l'oscillatore viene utilizzato per cercare un segnale inverso. È raccomandato come punto di ingresso nelle strategie swing e nel trading dai livelli. È disponibile una dashboard multi-valuta. Con esso, puoi facilmente passare da un grafico all'altro. Nelle discussioni sui prodotti, è possibile suggerire un algoritmo in cui è possibile incorporare un dashboard. Parame
                      FREE
                      Follow The Line
                      Oliver Gideon Amofa Appiah
                      4.07 (14)
                      FOLLOW THE LINE GET THE FULL VERSION HERE: https://www.mql5.com/en/market/product/36024 This indicator obeys the popular maxim that: "THE TREND IS YOUR FRIEND" It paints a GREEN line for BUY and also paints a RED line for SELL.  It gives alarms and alerts of all kinds. IT DOES NOT REPAINT and can be used for all currency pairs and timeframes. Yes, as easy and simple as that. Even a newbie can use it to make great and reliable trades. NB: For best results, get my other premium indicators for more
                      FREE
                      Awesome MACD Indicator
                      Komang Putra Riswanjaya
                      AWESOME MACD INDICATOR Awesome MACD Indicator is a powerful trading tool that combines the strengths of Moving Average (MA) and Moving Average Convergence Divergence (MACD) to provide accurate and reliable trading signals. Designed for forex and stock traders, this indicator simplifies the identification of trading opportunities by detecting significant crosses in price movements. Key Features: MA and MACD Combination: Awesome MACD leverages the power of Moving Averages (MA) to identify short-
                      FREE
                      FFx MACD
                      Eric Venturi-Bloxs
                      4.2 (5)
                      The purpose of this new version of the MT4 standard indicator provided in your platform is to display in a sub-window multiple timeframes of the same indicator. See the example shown in the picture below. But the display isn’t like a simple MTF indicator. This is the real display of the indicator on its timeframe. Here's the options available in the FFx indicator: Select the timeframes to be displayed (M1 to Monthly) Define the width (number of bars) for each timeframe box Alert pop up/sound/ema
                      FREE
                      Email Drawdown Alert
                      Roman Starostin
                      5 (12)
                      Free informative Indicator-helper. It'll be usefull for traders who trade many symbols or using grid systems (Averaging or Martingale). Indicator counts drawdown as percent and currency separate. It has a number of settings: Count deposite drawdown according equity value and send e-mail or notifications to user if DD more than set; Sending e-mail when max open orders reached; Shows price and remaining pips amount before MarginCall on current chart and Account generally; Display summary trade lot
                      FREE
                      Are you tired of drawing trendlines every time you're analyzing charts? Or perhaps you would like more consistency in your technical analysis. Then this is for you. This indicator will draw trend lines automatically when dropped on a chart. How it works Works similar to standard deviation channel found on mt4 and mt5. It has 2 parameters: 1. Starting Bar 2. Number of bars for calculation The   starting bar   is the bar which drawing of the trend lines will begin, while the   number of bars for c
                      FREE
                      OrderBlock TS Roman
                      Vladislav Vlastovskii
                      3.8 (5)
                      Индикатор строит блоки заказов (БЗ) по торговой системе (ТС) Романа. Поиск блоков осуществляется одновременно на двух таймфремах: текущем и старшем (определяемым в настройках). Для оптимизации и игнорирования устаревших блоков в настройках задается ограничение количества дней в пределах которых осуществляется поиск блоков. Блоки строятся по правилам ТС состоящем из трех шагов: какую свечу вынесли (что?); какой свечой вынесли (чем?); правило отрисовки (как?).
                      FREE
                      Download the free version   here. Divergence Divergence refers to when the price of a currency pair moves in one direction while the trend indicator is moving in the opposite direction. With divergence, there can be positive and negative signals. Divergences in Forex trading are quite common signals of technical analysis. These are basic early Forex signals indicating the trend reversal and filter false signals. Application of this indicator It is usually not easy to detect divergences by the t
                      FREE
                      ET1 for MT4
                      Hui Qiu
                      3.86 (7)
                      ET1 for MT4 is new and completely free!! ET1 for MT4 v4.20 Updated!! Now use on XAUUSD(Gold)!! The success rate is more than 75% !!! important update: Merge ET9 's breakout strategy Warning!! You can use ET1 completely free, but we do not guarantee ET1 stability, It is recommended that the more powerful ET9 for MT4 version includes the ET1 strategy and guarantees complete and stable returns. The Best Expert Advisor  on   XAUUSD   any timeframes  ET9  for MT4 Updated v4.70 !!  https://www.m
                      FREE
                      Trend Catcher with Alert
                      Issam Kassas
                      4.72 (54)
                      Il Catturatore di Tendenza: La Strategia del Catturatore di Tendenza con Indicatore di Allarme è uno strumento versatile di analisi tecnica che aiuta i trader a identificare le tendenze di mercato e i potenziali punti di ingresso e uscita. Presenta una Strategia dinamica del Catturatore di Tendenza, adattandosi alle condizioni di mercato per una chiara rappresentazione visiva della direzione della tendenza. I trader possono personalizzare i parametri in base alle loro preferenze e tolleranza
                      FREE
                      This scanner shows the trend values of the well known indicator SuperTrend for up to 30 instruments and 8 time frames. You can get alerts via MT4, Email and Push-Notification as soon as the direction of the trend changes. This is the FREE version of the indicator: SuperTrend Scanner The free version works only on EURUSD and GBPUSD! Important Information How you can maximize the potential of the scanner, please read here: www.mql5.com/en/blogs/post/718074 With the following FREE indicator you
                      FREE
                      Ppr PA
                      Yury Emeliyanov
                      4.5 (2)
                      "Ppr PA" is a unique technical indicator created to identify "PPR" patterns on the currency charts of the MT4 trading platform. These patterns can indicate possible reversals or continuation of the trend, providing traders with valuable signals to enter the market. Features: Automatic PPR Detection:   The indicator automatically identifies and marks PPR patterns with arrows on the chart. Visual Signals:   Green and red arrows indicate the optimal points for buying and selling, respectively. A
                      FREE
                      Trend arrow Indicator
                      NGUYEN NGHIEM DUY
                      3.33 (9)
                      Trend arrow Indicator is an arrow Indicator used as an assistant tool for your trading strategy. The indicator analyzes the standard deviation of bar close for a given period and generates a buy or sell signals if the deviation increases. It good to combo with Martingale EA to follow Trend and Sellect Buy Only/Sell Only for EA work Semi-Automatic. You can use this  Indicator with any EAs in my Products.
                      FREE
                      Extremum Reverse Bar
                      Yurij Izyumov
                      2.8 (5)
                      This indicator has been created for finding the probable reversal points of the symbol price. A small candlestick reversal pattern is used it its operation in conjunction with a filter of extremums. The indicator is not redrawn! If the extremum filter is disabled, the indicator shows all points that have a pattern. If the extremum filter is enabled, the condition works – if the history Previous bars 1 candles back contains higher candles and they are farther than the Previous bars 2 candle, such
                      FREE
                      Pivot Mean Oscillator
                      Marco Calabrese
                      4 (1)
                      Pivot Mean Oscillator (PMO) is a unbounded zero-centered oscillator that provides a quick and normalized measure of divergence between two spreads. Detailed description of the mathematical formulation along with some comments and experiments can be found in this article .  Trading aspects This version of PMO is tuned on spreads relative to Close and Open price signals against their cumulative moving average (CMA). Positive PMO(m,n) values means that last (normalized) m Close prices are higher
                      FREE
                      Signals and Alerts for Accelerator/Decelerator indicator based on these MQL5 posts: Accelerator Oscillator and Signals of the Indicator Accelerator Oscillator . Note : this tool is based on the code of Accelerator indicator developed by MetaQuotes Software Corp. Features The signals are triggered at   closing   of last bar/opening of a new bar; Any kind of alerts can be enabled: Dialog Box, Email message, SMS notifications for smartphones and tablets, and Sound alerts; Customizable arrows. By
                      FREE
                      Magic Macd Cross
                      Christophe Godart
                      This classic "old school" MAGIC MACD indicator gives you the cross of the parameters you set. Standart setting is (12,26,9) . The arrows give you a possible change of trend. Be careful and do not use this indicator as a single signal source. FREE version  Please feel free to check out our other REX indicator series. We do have other free indicators.     "OLD BUT GOLD"
                      FREE
                      Sm Ichimoku Scanner
                      Steeve Christian Martol
                      5 (4)
                      Multi Time Frame Indicator acts as a Scanner based on the Ichimoku Trading System. The outcome is displayed on a board. This helps you to make "at a glance" a mental picture of the System without having to open the chart. Up to 10 Currencies can be watched. Scanned elements And Legend "KUMO Futur" - Green : The Kumo Futur is Bullish. "KUMO Futur" - Red : The Kumo Futur is Bearish. "PRICE Cross KJ" - Green : The Price is Above the Kijun Sen.  "PRICE Cross KJ" - Red : The Price is Below the Kijun
                      FREE
                      EUR INDEX The Currency Index Project is ONE part of a thorough Forex study. Many people do not know the theoretical basis that drives currency exchange rates to move on the market. With this set of tools you will be able to have a more complete view of the entire market by analyzing not only the single currency of an exchange, but all the exchange rates that make up that currency by looking at a single window! The indicator faithfully represents the real index of a single currency present in
                      FREE
                      Gli utenti di questo prodotto hanno anche acquistato
                      Bull versus Bear
                      Mohamed Hassan
                      4.56 (9)
                      Official Release price of $65 for the first 56 /60   copies ( 4  copies left). Next price is $120 !  Send us a message after your purchase to receive more information on how to get your  BONUS  for FREE  that works in great combination with Bull vs Bear ! Bull versus Bear is an easy-to-use Forex indicator that gives traders clear and accurate signals based on clear trend retests . Forget about lagging indicators or staring at charts for hours because  Bull vs Bear provides real-time entries
                      - Real price is 80$ - 40% Discount ( It is 49$ now ) Contact me for instruction, add group and any questions! Related Products:  Bitcoin Expert , Gold Expert Introduction The breakout and retest strategy is traded support and resistance levels. it involves price breaking through a previous level.  The break and retest strategy is designed to help traders do two main things, the first is to avoid false breakouts. Many false breakouts start with a candlestick that breaks out of a level but ends w
                      Gann Made Easy
                      Oleg Rodin
                      4.83 (93)
                      Gann Made Easy è un sistema di trading Forex professionale e facile da usare che si basa sui migliori principi del trading utilizzando la teoria di mr. WD Gann. L'indicatore fornisce segnali ACQUISTA e VENDI accurati, inclusi i livelli di Stop Loss e Take Profit. Puoi fare trading anche in movimento utilizzando le notifiche PUSH. Vi prego di contattarmi dopo l'acquisto! Condividerò i miei consigli di trading con te e fantastici indicatori bonus gratuitamente! Probabilmente hai già sentito parlar

                      TrendMaestro
                      Stefano Frisetti
                      5 (3)
                      nota: questo indicatore e' per METATRADER4, se vuoi la versione per  METATRADER5 questo e' il link:  https://www.mql5.com/it/market/product/108123 TRENDMAESTRO ver 2.4 TRENDMAESTRO riconosce un nuovo TREND sul nascere, non sbaglia mai. La sicurezza di identificare un nuovo TREND non ha prezzo. DESCRIZIONE TRENDMAESTRO identifica un nuovo TREND sul nascere, questo indicatore prende in esame la volatilita' i volumi ed il momentum per identificare il momento in cui c'e' un'esplosione di uno 
                      FX Volume
                      Daniel Stein
                      4.58 (33)
                      FX Volume è il primo e unico indicatore di volume che offre una visione autentica del sentimento del mercato dal punto di vista del broker. Fornisce notevoli informazioni sul posizionamento degli operatori istituzionali, come i broker, nel mercato Forex, molto più rapidamente dei rapporti COT. La visualizzazione di queste informazioni direttamente sul vostro grafico è una soluzione innovativa e rivoluzionaria per il vostro successo nel trading. Approfittate di dati di mercato unici come: I ra
                      TPSpro RFI Levels
                      Roman Podpora
                      4.82 (22)
                      ISTRUZIONI       RUS   -   INGLESE       Si   consiglia di utilizzare con un indicatore       -       TPSpro   TENDENZA PRO -   Versione MT4         Un elemento chiave nel trading sono le zone o i livelli da cui vengono prese le decisioni di acquisto o vendita di uno strumento di trading. Nonostante i tentativi dei principali attori di nascondere la loro presenza sul mercato, lasciano inevitabilmente delle tracce. Il nostro compito era imparare a identificare queste tracce e interpretarle corre
                      SI PREGA DI LEGGERE LE INFORMAZIONI QUI SOTTO PRIMA DI ACQUISTARE IL PRODOTTO! Apollo Pips PLUS SP è un prodotto unico! È PER CHI VUOLE OTTENERE IL MIO NUOVO INDICATORE "APOLLO PIPS" PIÙ IL BONUS "SUPER PACK" CON ACCESSO A TUTTI I MIEI INDICATORI DI TRADING! Acquistando il prodotto Apollo Pips PLUS SP stai effettivamente acquistando una versione assolutamente nuova del mio indicatore Apollo Pips. Questa versione dell'indicatore ha un algoritmo migliorato e un parametro facile da usare che ti dà
                      Scalper Inside PRO
                      Alexey Minkov
                      4.73 (56)
                      !!! 11.11 - SALE 25% - LIMITED TIME OFFER!!! An exclusive indicator that utilizes an innovative algorithm to swiftly and accurately determine the market trend. The indicator automatically calculates opening, closing, and profit levels, providing detailed trading statistics. With these features, you can choose the most appropriate trading instrument for the current market conditions. Additionally, you can easily integrate your own arrow indicators into Scalper Inside Pro to quickly evaluate the
                      TPSproTREND PrO
                      Roman Podpora
                      4.79 (19)
                      TPSpro TREND PRO   è un indicatore di tendenza che analizza automaticamente il mercato, fornisce informazioni sulla tendenza e sui rispettivi cambiamenti e fornisce segnali per entrare nelle operazioni senza ridisegnare. L'indicatore utilizza ciascuna candela e la analizza separatamente. Si riferisce a vari shock al rialzo o al ribasso. Punto di ingresso preciso per il trading di valute, criptovalute, metalli, azioni e indici! Versione MT5                   Descrizione completa dell'indicatore
                      Gold Stuff
                      Vasiliy Strukov
                      4.89 (242)
                      Gold Stuff è un indicatore di tendenza progettato specificamente per l'oro e può essere utilizzato anche su qualsiasi strumento finanziario. L'indicatore non ridisegna e non è in ritardo. Periodo consigliato H1. Su di esso l'indicatore funziona in modo completamente automatico Expert Advisor EA Gold Stuff. Lo trovi nel mio profilo. I risultati in tempo reale possono essere visualizzati qui.  Puoi ottenere una copia gratuita del nostro indicatore Strong Support e Trend Scanner, per favore scri
                      Trend Screener
                      STE S.S.COMPANY
                      4.81 (88)
                      Indicatore di tendenza, soluzione unica rivoluzionaria per il trading di tendenze e il filtraggio con tutte le importanti funzionalità di tendenza integrate in un unico strumento! È un indicatore multi-timeframe e multi-valuta al 100% non ridipingibile che può essere utilizzato su tutti i simboli/strumenti: forex, materie prime, criptovalute, indici e azioni. OFFERTA A TEMPO LIMITATO: l'indicatore di screening di supporto e resistenza è disponibile a soli 50$ e a vita. (Prezzo originale 250$) (o
                      Lascia un commento dopo l'acquisto per ricevere 4 indicatori di alta qualità come bonus. L'indicatore Chart Patterns All-in-One aiuta i trader a visualizzare vari modelli di grafici comunemente utilizzati nell'analisi tecnica. Questo indicatore supporta l'identificazione dei possibili comportamenti del mercato, ma non garantisce la redditività. Si consiglia di testare l'indicatore in modalità demo prima dell'acquisto. Offerta attuale : 50% di sconto sull'indicatore "Chart Patterns All in One". M
                      Black dragon indicator
                      Ramil Minniakhmetov
                      4.86 (114)
                      L'indicatore di rilevamento delle tendenze integrerà qualsiasi strategia e può anche essere utilizzato come strumento indipendente. IMPORTANTE! Contattami subito dopo l'acquisto per ricevere istruzioni e un bonus! Raccomandazioni per lavorare con l'indicatore, puoi scaricare nel commento n Vantaggi Facile da usare, non sovraccarica il grafico con informazioni non necessarie; Possibilità di utilizzo come filtro per qualsiasi strategia; Ha livelli integrati di supporto e resistenza dinami
                      Trend Punch
                      Mohamed Hassan
                      4.95 (21)
                      This indicator is unstoppable when combined with our other indicator called  Support & Resistance . After purchase, send us a message and you will get it   for  FREE as a BONUS! Introducing Trend Punch , the revolutionary forex trend indicator that will transform the way you trade! Trend Punch is uniquely designed to provide precise buy and sell arrows during strong market trends, making your trading decisions clearer and more confident. Whether you're trading major currency pairs or exotic sym
                      FX Power MT4 NG
                      Daniel Stein
                      5 (14)
                      FX Power MT4 NG rappresenta la versione avanzata del popolare misuratore di forza delle valute, FX Power, che ha avuto successo nel mercato mql5 per oltre otto anni. Questo misuratore di forza di nuova generazione conserva tutte le caratteristiche apprezzate nell'FX Power originale e aggiunge: Analisi della forza di ORO/XAU Risultati di calcolo più precisi Periodi di analisi configurabili Un limite di calcolo personalizzabile per migliorare le prestazioni Impostazioni speciali per istanze mul
                      Atomic Analyst
                      Issam Kassas
                      5 (2)
                      Innanzitutto, vale la pena sottolineare che questo indicatore di trading non è repaint, non è ridisegno e non presenta ritardi, il che lo rende ideale sia per il trading manuale che per quello automatico. Manuale utente: impostazioni, input e strategia. L'Analista Atomico è un indicatore di azione del prezzo PA che utilizza la forza e il momentum del prezzo per trovare un miglior vantaggio sul mercato. Dotato di filtri avanzati che aiutano a rimuovere rumori e segnali falsi, e aumentare il pote
                      Questo cruscotto mostra gli ultimi pattern armonici disponibili per i simboli selezionati, in modo da risparmiare tempo ed essere più efficienti / versione MT5 . Indicatore gratuito: Basic Harmonic Pattern Colonne dell'indicatore Symbol : vengono visualizzati i simboli selezionati Trend: rialzista o ribassista Pattern: tipo di pattern (gartley, butterfly, bat, crab, shark, cypher o ABCD) Entry: prezzo di ingresso SL: prezzo di stop loss TP1: 1 prezzo di take profit TP2: 2 prezzo di take
                      Market Reversal Alerts
                      LEE SAMSON
                      4.19 (113)
                      Il profitto dalla struttura del mercato cambia quando il prezzo si inverte e si ritira. L'indicatore di avviso di inversione della struttura del mercato identifica quando una tendenza o un movimento di prezzo si sta avvicinando all'esaurimento e pronto a invertire. Ti avvisa dei cambiamenti nella struttura del mercato che in genere si verificano quando stanno per verificarsi un'inversione o un forte pullback. L'indicatore identifica inizialmente i breakout e lo slancio del prezzo, ogni volta
                      Enigmera
                      Ivan Stefanov
                      5 (3)
                      ENIGMERA: Il cuore del mercato https://www.enigmera.com Introduzione Questo indicatore e sistema di trading rappresenta un approccio straordinario ai mercati finanziari. ENIGMERA utilizza i cicli frattali per calcolare con precisione i livelli di supporto e resistenza. Mostra l'autentica fase di accumulazione e fornisce direzione e obiettivi.  Un sistema che funziona sia in un trend che in una correzione.  Come funziona? ENIGMERA è composto da tre linee: la linea di supporto/resistenza, la
                      Trend Pulse
                      Mohamed Hassan
                      5 (4)
                      Halloween Promotion   for   24 hours only   with a   40%   discount on the original price!  $̶6̶5̶  $39 ONLY!  Please contact me after purchase to immediately get your PDF strategy + documentation for Trend Pulse !  Introducing Trend Pulse , a unique and robust indicator capable of detecting bullish, bearish, and even ranging trends! Trend Pulse uses a special algorithm to filter out market noise with real precision. If the current symbol is moving sideways, Trend Pulse will send you a
                      Questa dashboard è uno strumento di avviso da utilizzare con l'indicatore di inversione della struttura del mercato. Il suo scopo principale è avvisarti di opportunità di inversione su intervalli di tempo specifici e anche di ripetere i test degli avvisi (conferma) come fa l'indicatore. Il dashboard è progettato per essere posizionato su un grafico da solo e funzionare in background per inviarti avvisi sulle coppie e sui tempi scelti. È stato sviluppato dopo che molte persone hanno richiesto un
                      Currency Strength Exotics
                      Bernhard Schweigert
                      4.87 (31)
                      ATTUALMENTE SCONTATO DEL 20%! La soluzione migliore per qualsiasi principiante o trader esperto! Questo indicatore è specializzato nel mostrare la forza della valuta per qualsiasi simbolo come coppie esotiche, materie prime, indici o futures. È il primo nel suo genere, qualsiasi simbolo può essere aggiunto alla nona riga per mostrare la vera forza della valuta di Oro, Argento, Petrolio, DAX, US30, MXN, TRY, CNH ecc. Si tratta di uno strumento di trading unico, di alta qualità e conveniente
                      Dynamic Forex28 Navigator
                      Bernhard Schweigert
                      5 (2)
                      Dynamic Forex28 Navigator - Lo strumento di trading Forex di nuova generazione. ATTUALMENTE SCONTATO DEL 49%. Dynamic Forex28 Navigator è l'evoluzione dei nostri indicatori popolari di lunga data, che combinano la potenza di tre in uno: Advanced Currency Strength28 Indicator (695 recensioni) + Advanced Currency IMPULSE con ALERT (520 recensioni) + CS28 Combo Signals (Bonus). Dettagli sull'indicatore https://www.mql5.com/en/blogs/post/758844 Cosa offre l'indicatore di forza di nuova generazion
                      Questo indicatore è un indicatore per l'analisi automatica delle onde perfetto per il trading pratico! Caso... Nota:   non sono abituato a usare nomi occidentali per la classificazione delle onde a causa dell'influenza della convenzione di denominazione di Tang Lun (Tang Zhong Shuo Zen), ho chiamato l'onda base come   penna   e la banda dell'onda secondaria come   segmento   At allo stesso tempo, il segmento ha la direzione del trend. La denominazione   è principalmente segmento di trend   (qu
                      All in One Trade
                      Alexey Minkov
                      4.48 (27)
                      !!! 11.11 - SALE 25% - LIMITED TIME OFFER!!! The All-in-One Trade Indicator (AOTI) determines daily targets for EURUSD, EURJPY, GBPUSD, USDCHF, EURGBP, EURCAD, EURAUD, AUDJPY, GBPAUD, GBPCAD, GBPCHF, GBPJPY, AUDUSD, and USDJPY. All other modules work with any trading instruments. The indicator includes various features, such as Double Channel trend direction, Price channel, MA Bands, Fibo levels, Climax Bar detection, and others. The AOTI indicator is based on several trading strategies, and c
                      How to use Pair Trading Station Pair Trading Station is recommended for H1 time frame and you can use it for any currency pairs. To generate buy and sell signal, follow few steps below to apply Pair Trading Station to your MetaTrader terminal. When you load Pair Trading Station on your chart, Pair Trading station will assess available historical data in your MetaTrader platforms for each currency pair. On your chart, the amount of historical data available will be displayed for each currency pai
                      Questo indicatore è progettato per i grafici live, non per il tester. L’indicatore PRO Trend Divergence è uno strumento avanzato di analisi tecnica progettato per rilevare le divergenze di continuazione del trend – un segnale che indica la probabile prosecuzione della tendenza attuale. A differenza degli indicatori tradizionali, che si concentrano sui cambiamenti di tendenza, questo strumento consente ai trader di individuare le situazioni in cui la tendenza rimane forte, anche durante lievi rit
                      TakePropips Donchian Trend Pro
                      Eric John Pajarillaga Aldana
                      4.44 (16)
                      TakePropips Donchian Trend Pro   (MT4) è uno strumento potente ed efficace che rileva automaticamente la direzione del trend utilizzando il canale Donchian e ti fornisce segnali di trading di entrata e uscita! Questo indicatore multifunzione include uno scanner di tendenza, segnali di trading, pannello statistico, screener, sessioni di trading e dashboard della cronologia degli avvisi. È progettato per fornirti segnali di trading e farti risparmiare ore analizzando i grafici! È possibile scarica
                      Golden Trend Indicator
                      Noha Mohamed Fathy Younes Badr
                      Golden Trend indicator  is The best indicator for predicting trend movement this indicator never lags and never repaints and never back paints    and give  arrow buy and sell    before the candle appear  and it will help you and  will make your trading decisions clearer its work on all currencies and  gold and crypto and all time frame This unique  indicator uses very secret algorithms to catch the  trends, so you can trade using this indicator and see the trend clear on charts  manual guide and
                      Stratos Pali
                      Michela Russo
                      5 (1)
                      Stratos Pali Indicator   is a revolutionary tool designed to enhance your trading strategy by accurately identifying market trends. This sophisticated indicator uses a unique algorithm to generate a complete histogram, which records when the trend is Long or Short. When a trend reversal occurs, an arrow appears, indicating the new direction of the trend. Important Information Revealed Leave a review and contact me via mql5 message to receive My Top 5 set files for Stratos Pali at no cost! D
                      Altri dall’autore
                      SensorMap
                      Juergen Thielen
                      5 (1)
                      Concept Market arranges in Time upcoming Phases according to the present Results of its Interest. Directing Modulations are an Interaction of immanent Periods, which show in Reference to Time cyclic Activity and to Price leveling Activity. SensorMap is a reflecting Volume Mask of this Concept of Time and Price and apportioning developed Price Movements in an equalized 100 % - Range: how far moved ? indicating their Status by marking special Events: when which Action ? setting the Situation in
                      FREE
                      Filtro:
                      Daniel
                      929
                      Daniel 2023.07.26 17:01 
                       

                      L'utente non ha lasciato alcun commento sulla valutazione.

                      Jamie Daniel Thompson
                      163
                      Jamie Daniel Thompson 2023.06.22 14:43 
                       

                      Extremely useful and incredible tool! I don't understand how this doesn't have 5 star reviews yet! It has totally changed the accuracy of my entries! Thanks to the author!

                      Rispondi alla recensione
                      Versione 3.7 2023.04.16
                      Integration of the TickEvent News-Addon, no further Changes
                      Versione 3.6 2023.04.10
                      final Pixelwork on the Phase-Propeller, no further Changes.
                      Versione 3.5 2023.03.14
                      extended by Single-Pivot Option
                      Versione 3.4 2023.03.12
                      Taken out redundant Pivot-Adjustment (H4) and extended by Time-Adjustment Server-Terminal
                      Versione 3.3 2023.03.09
                      aligned/ defined/ extended/ finalized/ homologized/ completed
                      Versione 3.2 2022.12.20
                      The Bull-Bear-Propeller received an indicational update and prints now the Propeller-Status instead of the actual period-direction..
                      Versione 3.1 2022.12.19
                      PØINTZERØ SENSØRMAP is now splitted in two separate partial indicators, independent of each other working, standalone functional, fully enfolding their power by combination.

                      PØINTZERØ >+< PRØJECTØR: oscillating absolute Pricechart relating the functional categories (main)
                      SENSØRMAP <+> REFLECTØR: equalized relative Timechart alternating the categorized functions (sub)

                      If you want to have a Visual of the complete PØINTZERØ SENSØRMAP, please save a SENSØRMAP-Template as Tester-Template (tester.tpl) in templates-folder.
                      Of course you should load the indicator in advance ;-)

                      Merry christmas world!
                      Versione 3.0 2022.11.26
                      major update v 3.0
                      Versione 2.9 2022.11.21
                      faster and better than planned.. observation is the only functioning technique!
                      Versione 2.8 2022.11.17
                      if I wouldn't love what I do, I wouldn't do what I do.. PIV-color-setup now functional.. H4 reimplemented - no daytrading without it.. now with a clear conscience..
                      Versione 2.7 2022.11.17
                      functionality of Navi-News-Panel adjusted and sudden period-counting-typo corrected.. patience always gets rewarded..
                      Versione 2.6 2022.11.17
                      with this last update for this year everything is brought into the right light. compose and develop markets image as variable as market is driven. HAIRCROSS and enabled TOOL answer most of initial/ orientational questions. I wish nice holidays!
                      Versione 2.5 2022.11.17
                      PEN-rotor_stator now Trendline instead of txt-object //dismissed PIV<D1 // optimized PEN-Trace-Trend-Logic: Trace= dark/ Trend= bright : this way realistic price-action-mirroring // dismissed obsolete variables , some household and freshing cosmetics - imaging sharper every update..//
                      Versione 2.4 2022.11.16
                      the spread-level-warn-display had to be corrected..
                      Versione 2.3 2022.11.16
                      final touches and cosmetics..
                      Versione 2.2 2022.11.14
                      simplified visual, any effort is dedicated to optimized functionality..
                      Versione 2.1 2022.11.13
                      poets on coding serials..interst stands in front of discovery.
                      Versione 2.0 2022.11.09
                      adjusted the speed-display to directional colors, now makes sense ;-)
                      Versione 1.9 2022.11.09
                      some further internal optimizations..
                      Versione 1.8 2022.11.07
                      update to new MT4 Terminal-version 4.00 build 1363 03 Nov 2022, it comes with several internal optimizations..
                      Versione 1.7 2022.11.03
                      color correction corner 3, apart from that conflict-free presentation today..
                      Versione 1.6 2022.11.03
                      minor graphical definitions - mismatches cleared - no further irregularities discovered.. stable and vivid.. here go
                      Versione 1.5 2022.11.01
                      the value of a calibration one can measure in signals, which accomplish to pass revision tests by being such rare that any revision would take days..
                      Versione 1.4 2022.11.01
                      there is always potential to optimize.. redundants cleared..
                      Versione 1.3 2022.10.30
                      with one last minor graphical correction this now awaits to become discovered by you
                      Versione 1.2 2022.10.30
                      the winter-time-change cheated the last update - corrected + goddie for wintertime :-)
                      Versione 1.1 2022.10.30
                      Functional Implematation of the Rotor-Stator-Function via Bull and Bear, obsolete code cleaned and graphics and visuals defined