SwingZZ MT5 with not redraw
- Индикаторы
- Minh Truong Pham
- Версия: 1.0
- Активации: 6
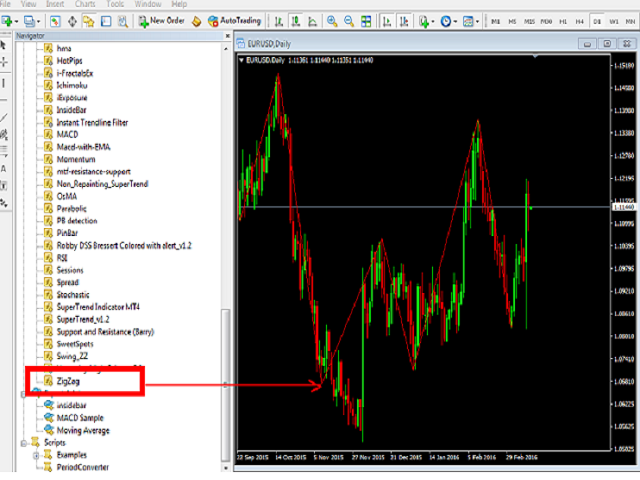
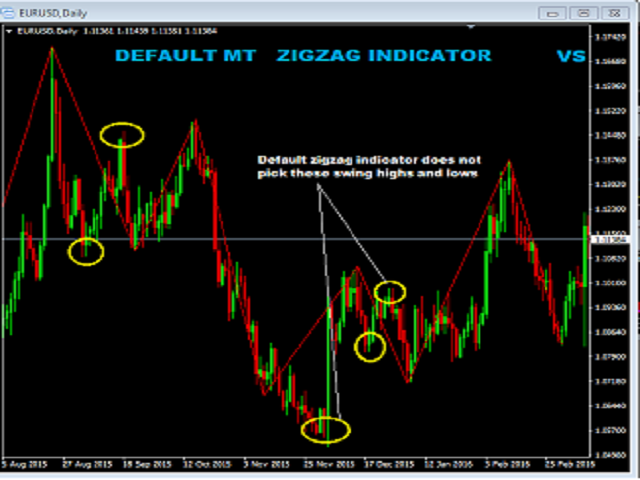
Here’s the problem: the default zigzag indicator given in MT5 trading platform does not really capture the most of the highs and lows on chart do draw zigzags. On chart below, notice that some of ther high, low of price have been missed to draw zigzags by this default zigzag indicator (picture 1).
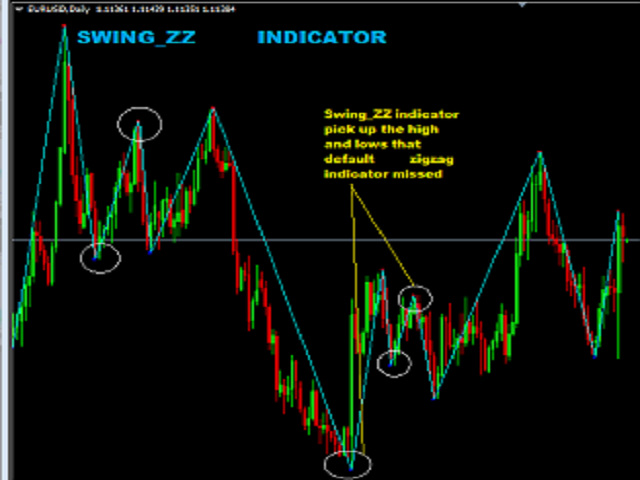
It is not so apparent until you compare default zigzag indicator to this SwingZZ indicator. Have a look on picture 2 and 3.
The swing zigzag indicator is best because it captures most of the swing highs and swing lows of price action to draw zigzags. When build this indicator, I have refer to Onix SwingZZ on MT4 indicator but this redraw on every tick. So, I change all to just redraw third extremum from the last uncompleted bar (just like MetaQuotes Zigzag indicator did)
And with these zigzags, you can:
+ use to draw trendlines, draw channels
+ identify support and resistance levels
+ even identify chart patterns like head and shoulders pattern
+ use to place stoploss, takeprofit…
As you can see, there’s a handful of things you can do with this zigzag forex indicator.
HOW TO ADJUST THE SWING ZIGZAG MT4 INDICATOR SETTINGS TO GET MORE ACCURACY
The thing I like about the swing zigzag indicator is that you can adjust the setting to get more accuracy.
Here’s how to adjust the settings:
1. right click on your chart where the swing zigzag indicator has been upload and click “indicators list” and this will bring up a window with a list of all the indicators you have on that chart.
2. Find Swing_ZZ and double click it and this will open up the second window
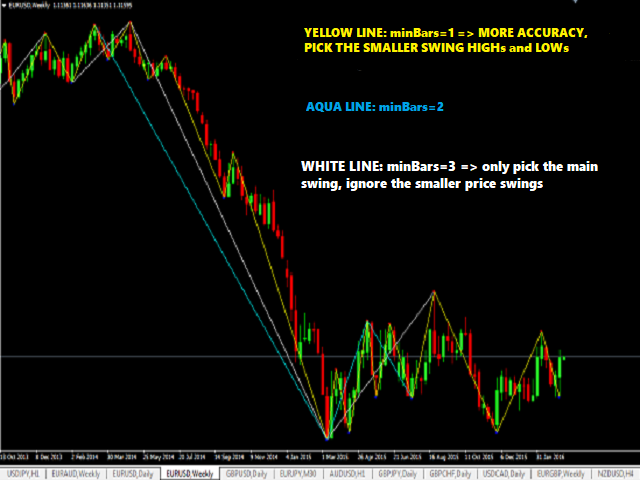
3. In the second winder, By default, in the “inputs” tab, the “minBars” is set to 2. By changing this number to 1, you get more accuracy. By increasing this number to 3 or 4, the accuracy decreases because it will only pick those significant swing highs and lows to draw zigzags.
4. Then click “Ok” and this will close the 2nd window then you are only left with the first winder and you click”close”
Lets compare a few charts to see how the accuracy changes when you change the “minBars” (picture 4)


