Danko DTC Panel
- Утилиты
- Ricardo Almeida Branco
- Версия: 1.0
- Активации: 5
Do not buy before seeing the Danko Trend Color product, as this panel is a way to view a summary of this indicator on various timeframes.
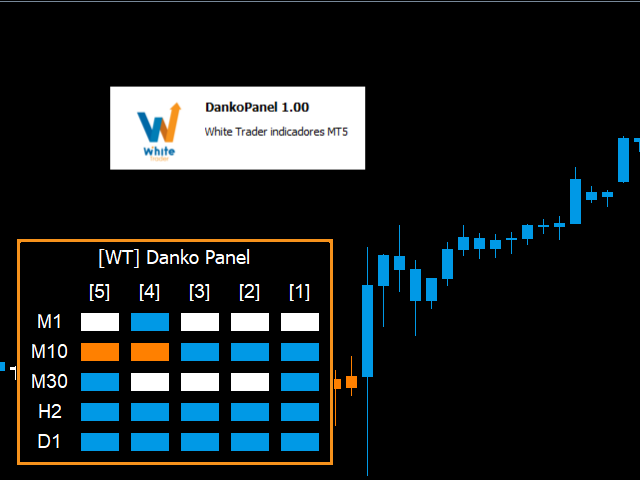
The Danko DTC Panel utilityallows you to look at the trend in up to 5 timeframes.
When clicking on the timeframe texts, a new window will open with the indicator plotted on the screen so you can see the complete chart.
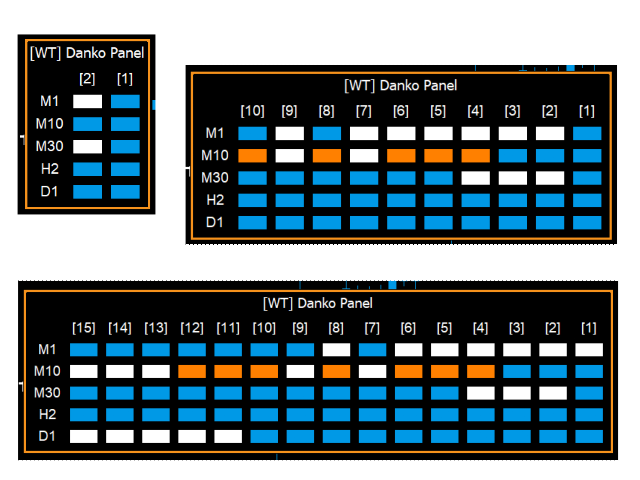
The width of the panel, with the amount of candles you want to see, is customizable, see the images below.
Ao clicar nos textos dos timeframes, uma nova janela se abrirá já com o indicador plotado na tela para você ver o gráfico
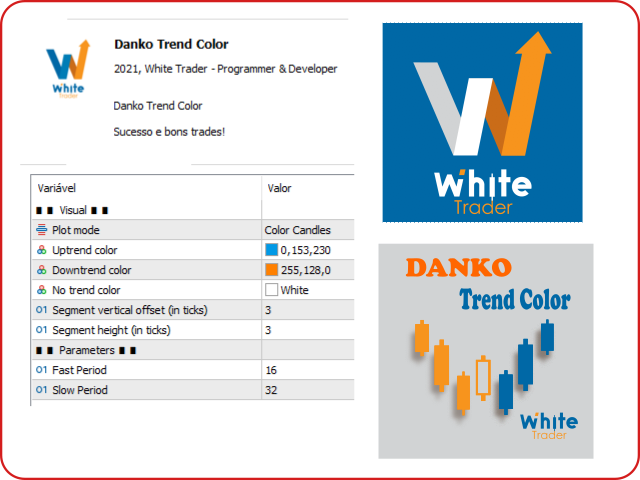
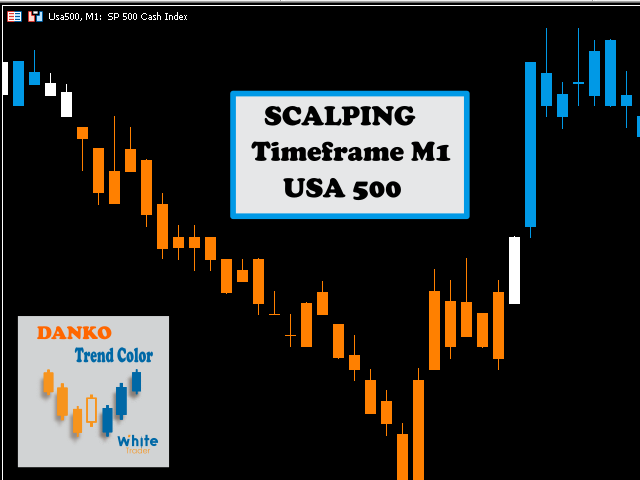
Danko Trend Color combines PRICE AND VOLUME indicators to define the prevailing trend, so the colors are:
Blue (indicates an uptrend)
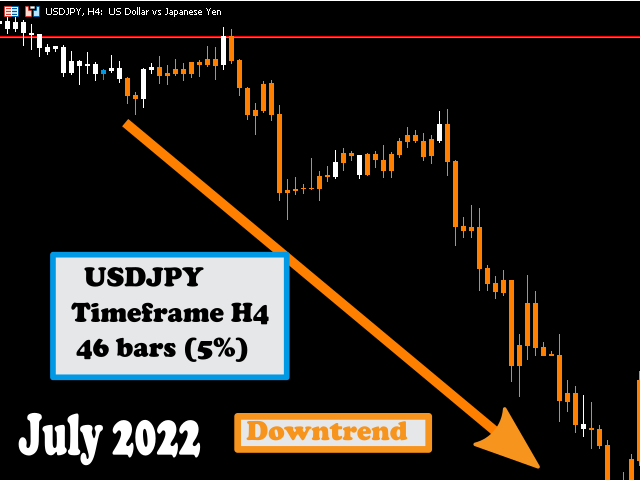
Orange (indicates a downtrend)
White (indicates undefined trend)
I don't like to promise anything with my indicators, I ask you to download, test it for free (for use in backtesting) and see if the indicator can, in some way, help your operational.
For more information about the main indicator (Danko Trend Color), click here!
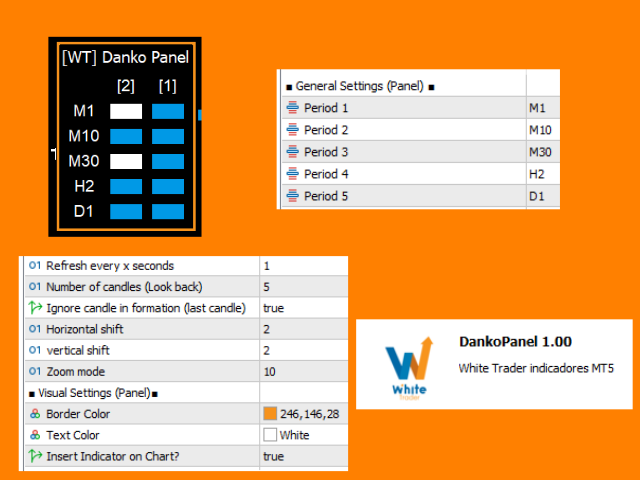
Input parameters (dashboard only):
- period1
- period2
- Period3
- Period4
- Period5
- Refresh every x seconds Refresh every x seconds
- Number of candles (Look back) Number of candles from the past that should be displayed
- Ignore candle in formation (last candle) Ignore candle in formation (last candle)
- Horizontal shift Horizontal shift
- Vertical shift Vertical shift
- Zoom mode Zoom size
- Border Color Border Color
- Text Color text color
- Insert Indicator on Chart? Insert indicator on chart?
To see about the indicator's input parameters, please go to the link above.
If you found the indicator idea interesting and want to discuss it, let's use the discussion tab to comment, thanks in advance for the exchange of ideas.
That's it!
To learn about other White Trader indicators, visit https://www.mql5.com/pt/users/rycke.br/seller
Success and good trading!

