WAPV Weis Wave Chart MT5
- Индикаторы
- Eduardo Da Costa Custodio Santos
- Версия: 1.1
- Обновлено: 27 мая 2024
- Активации: 5
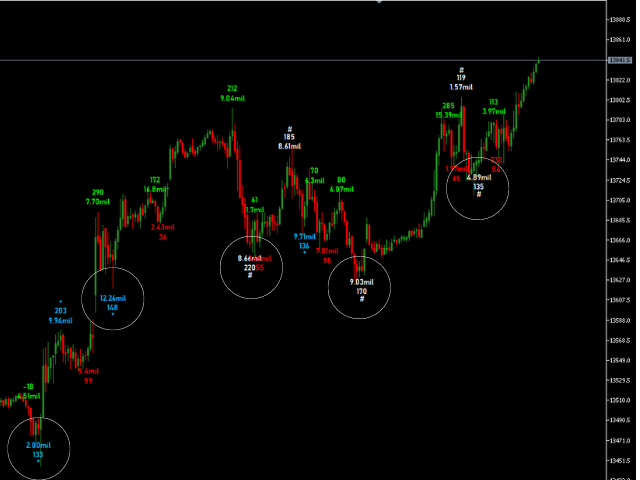
The Weis Wave Chart for MT5 is a Price and Volume indicator. The Price and Volume reading was widely disseminated through Richard Demille Wyckoff based on the three laws created by him: Supply and Demand, Cause and Effect and Effort vs. Result. In 1900 R.Wyckoff already used the wave chart in his analyses. Many years later, around 1990, David Weis Automated R. Wyckoff's wave chart and today we bring you the evolution of David Weis' wave chart. It shows the amount of Volume and the amount of pips in relation to the wave generated in the asset. Today we at Wyckoff Academy were able to map significant within the wave chart and this is what you will see in the images below.


