Long Term Stats
- Индикаторы
- Michele Bini
- Версия: 1.0
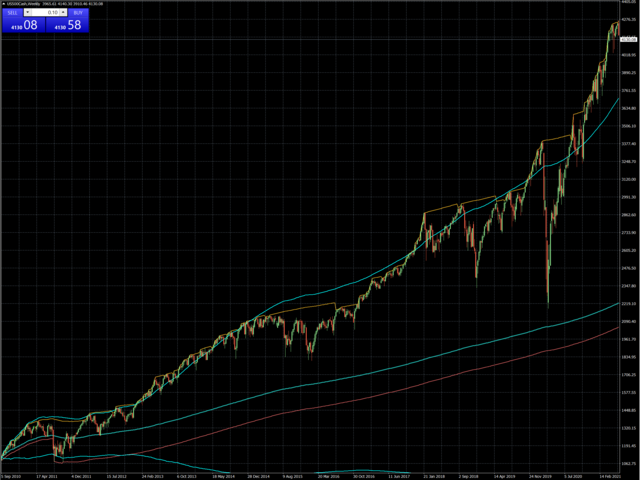
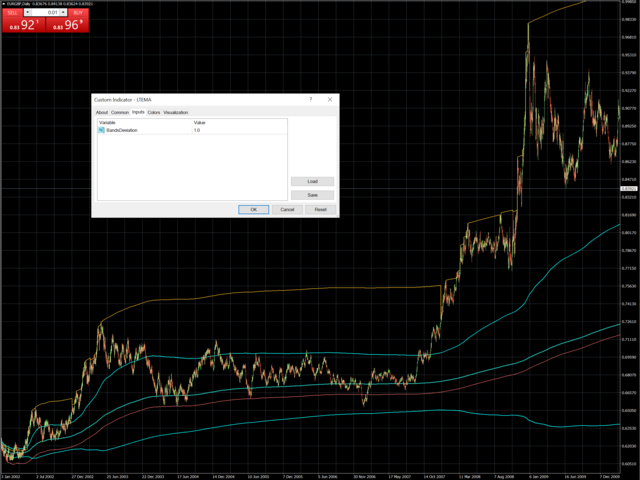
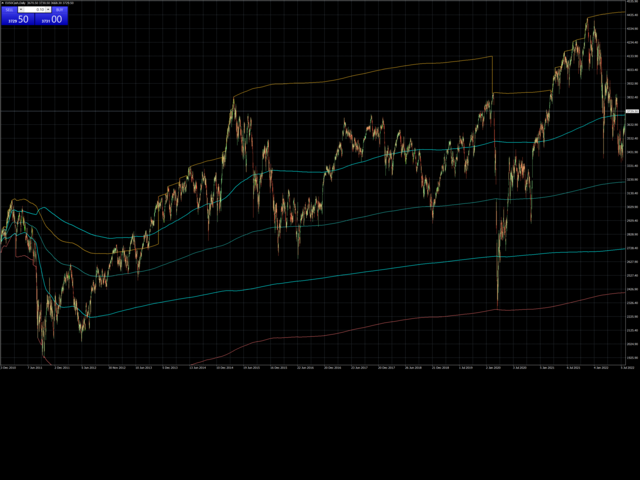
Long term stats is a trend indicator.
As the name suggests, it computes long term running average, standard deviation and min/max values
Average and standard deviation are plotted on the graph and deviation value is taken as input parameter (similarly to bollinger bands).
Historical minimum and maximum are plotted on the graph and updated for each bar, considering historical time series slope. (this is to somehow account for inflation/deflation)
Can be used as filter for signals, as trigger to get into the market or as parameter for position sizing.

