OverlayChart PRO
- Индикаторы
- Obaida Kusibi
- Версия: 1.0
- Активации: 5
What is the Overlay Chart Indicator?
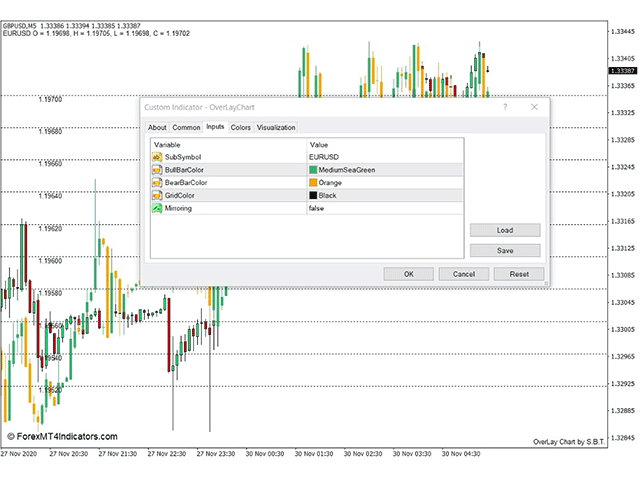
The Overlay Chart indicator is exactly as its name suggests. It is a custom technical indicator which overlays another price chart over the current price chart window. It allows traders to overlay another currency pair over one pair which allows them to compare price movements and the characteristics of price action. It then plots a grid to indicate the price of the overlaid currency pair for better reference.
It also plots the open, high, low, and close price of the overlaid currency pair on the upper left corner of the price chart, just below the open, high, low, and close price of the main currency pair.
How the Overlay Chart Indicator Works?
The Overlay Chart indicator simply retrieves the price chart data of the chosen currency pair to be overlaid on the price chart from the broker’s server. It then plots the price chart of the chosen currency pair over the main currency pair. Based on the range of the price displayed by the overlaid currency pair, the indicator would then plot a grid that indicates the price levels.
It also uses the price data from the broker’s server as a basis for the open, high, low, and close price to be displayed on the upper left corner of the chart.
How to use the Overlay Chart Indicator for MT4
The Overlay Chart indicator has several options within its indicator settings that are very important for its use.
The “SubSymbol” field allows traders to modify what currency pair would be displayed on the price chart. It is done simply by typing in the currency pair that we would want overlaid.
The “BullBarColor” and “BearBarColor” fields allow traders to modify the color of the bars being overlaid.
The “GridColor” allows traders to change the color of the price grid.
“Mirroring” plots the price chart inversely. This is useful for inversely correlated currency pairs.
The Overlay Chart can be used to identify correlated pairs. For example, the EURUSD and GBPUSD pairs are correlated because of the US Dollar currency. These pairs would have similar price action characteristics.
Traders can also confirm currency strength using this indicator. If the driving force of price action is due to a certain currency pair, the currency pairs with a common currency would usually have a strong correlation.
Conclusion
The Overlay Chart indicator may not be an indicator that provides technical indications pertaining to trends, momentum, and reversals. However, the information it provides is vital since it allows traders to identify which currency is driving the market. This is a competitive trading edge which traders can use to their advantage.
