• Обзор
  • Отзывы (1)
  • Обсуждение
  • Что нового

FabFlowInPrice

Tape Reading, flow monitoring.

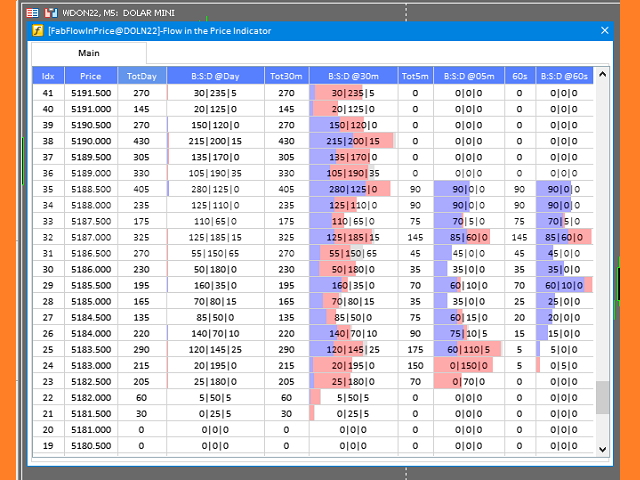
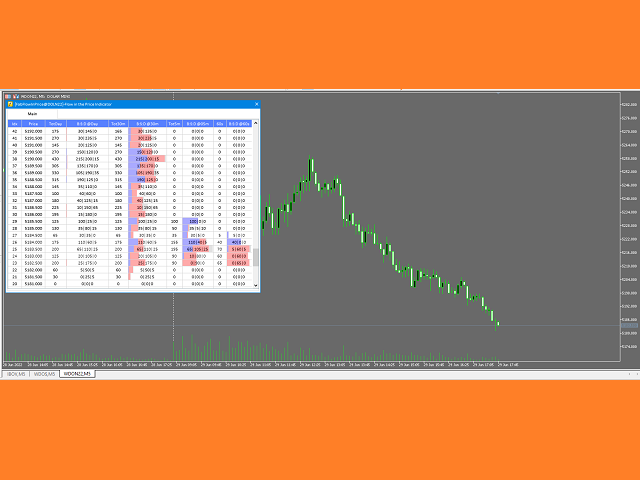
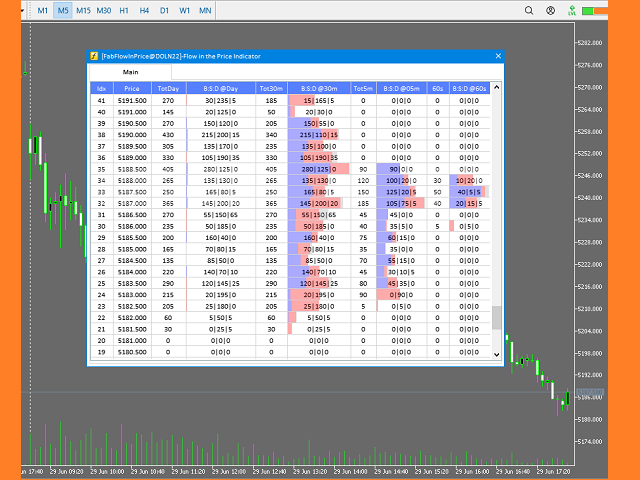
FabFlowInPrice is a powerful indicator for those who like Tape Reading (Times & Trades).

It presents the volumes traded at each price level, considering the purchase, sale and direct aggressions for each level.

Excellent tool for market flow analysis. Thought of flow so monitor who is attacking the most, buyers, sellers or direct exchanges, thought FabFlowInPrice.

The indicator displays information in 4 distinct and fixed periods, on any timeframe:

  • @Day - All trades performed on the day
  • @30m - The deals made in the last 30 minutes
  • @05m - Trades made in the last 05 minutes
  • @60s - Trades made in the last 60 seconds (*)


HIGHLIGHTS:

1) The Indicator can work with cross-reference. As an example on the BM&F you can 'trade' on the 'mini-dollar' and have the indicator showing the full 'dollar' flow.

2) The indicator is suitable for ANY timeframe.

3) If you want to test a Demo version you can use the 'Strategy Tester' in the "Every Tick" mode. Even if your broker does not provide real history data for testing, Metatrader uses a synthetic algorithm that emulates each candlestick. As a test suggestion, define a day when there was a trade with the desired symbol and use the 5-minute timeframe. Remembering that the algorithm was designed for Tape Reading, so test it on different days and at different timeframes to understand how it works before purchasing it.


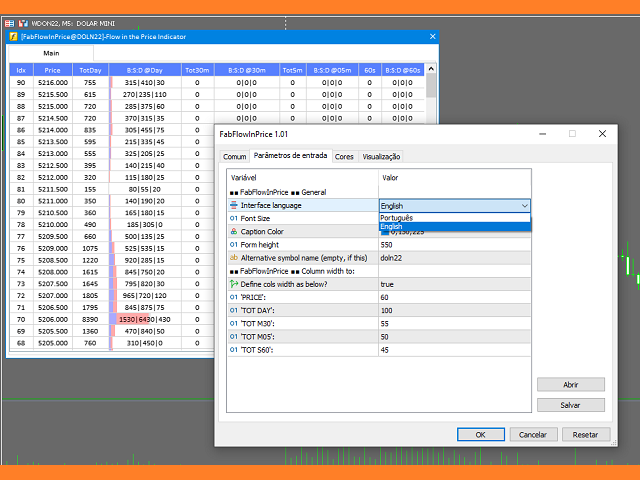
Input Parameters

General
    • Interface Language: Language (English / Portuguese).
    • Font Size: Font size, allows you to optimize according to your monitor and your video card.
    • Caption Color: Title bar color
    • Form height: Height of the graphic window to be created
    • Alternative symbol name: Name of the alternative symbol you want to monitor. Only in case of cross-reference.
Column width to:
    • Define cols width as below: Enables changing column widths to improve the visual aspect of the display in order to match the attributes of the respective symbol.
    • PRICE / TOTDAY / TOT M30 / TOT M05 / TOT S60: column width, if the above enable is 'true'.


IMPORTANT 

  • The indicator uses the CopyTicks and CopyTicksRange functions to access Times & Trades, check with your broker for the availability of this data.
  • Metatrader will synchronize the information within 45 seconds of starting, so keep in mind the need to wait for this time the first time you start the indicator.

Рекомендуем также
Simple ATR Modern Упрощенный инструмент для отслеживания волатильности рынка с большей ясностью, идеален как для дневной торговли, так и для свинг-трейдинга. Это лучший индикатор для начала торговли или для новичков. Цвет визуального индикатора: ATR Daily - синий Усильте анализ, комбинируя его с индикатором Volatility Vision . Точно измеряет колебания рыночных условий, что необходимо для принятия решений как в дневной торговле, так и в свинг-трейдинге. Использует базовое простое скользящее сре
Description The indicator uses market profile theory to show the most relevant trading zones, on a daily basis. The zones to be shown are LVN (low volume nodes) and POC (point of control). An LVN zone is one which represents price areas with the least time or volume throughout the day. Typically, these areas indicate a supply or demand initiative, and in the future, they can turn into important breakout or retracement zones. A POC zone is one which represents price areas with the most time or vo
Профиль Рынка (Market Profile) определяет ряд типов дней, которые помогают трейдеру распознать поведение рынка. Ключевая особенность - это область значений (Value Area), представляющая диапазон ценового действия, в котором произошло 70% торговли. Понимание области значений может помочь трейдерам вникнуть в направление рынка и установить торговлю с более высокими шансами на успех. Это отличное дополнение к любой системе, которую вы возможно используете. Blahtech Limited представляет сообществу Me
Waves PRO
Flavio Javier Jarabeck
For those who appreciate Richard Wyckoff approach for reading the markets, we at Minions Labs designed a tool derived - yes, derived, we put our own vision and sauce into this indicator - which we called Waves PRO . This indicator provides a ZigZag controlled by the market volatility (ATR) to build its legs, AND on each ZigZag leg, we present the vital data statistics about it. Simple and objective. This indicator is also derived from the great book called " The Secret Science of Price and Volum
WAPV Weis Wave Chart Forex
Eduardo Da Costa Custodio Santos
График Weis Wave Forex для MT5 — это индикатор цены и объема. Чтение цены и объема было широко распространено через Ричарда Демиля Вайкоффа на основе трех созданных им законов: спроса и предложения, причины и следствия и усилия против результата. В 1900 году Р. Вайкофф уже использовал волновую диаграмму в своих анализах. Много лет спустя, примерно в 1990 году, Дэвид Вайс автоматизировал волновой график Р. Вайкоффа, и сегодня мы представляем вам эволюцию волнового графика Дэвида Вайса. Он показыв
Этот продукт позволит Вам выгодно приобреcти и использовать два самых популярных продукта для анализа объемов заявок и сделок на биржевых рынках: Actual Depth of Market Chart Actual Tick Footprint Volume Chart Данный продукт вобрал в себя всю мощь каждого отдельного индикатора и оформлен в виде одного файла. Функционал продукта Actual COMBO Depth of Market AND Tick Volume Chart полностью идентичен оригинальным индикаторам. Вы оцените удобство объединения этих двух продуктов в один супер-индикато
Индикатор находит уровни максимального и минимального ценового объема (профиль рынка) на рабочей гистограмме для указанного количества баров.  Композитный профиль. Высота гистограммы полностью автоматическая и адаптируется к любому инструменту и таймфрейму. Используется авторский алгоритм и не повторяет известные аналоги. Высота двух гистограмм примерно равна средней высоте свечи. Умное оповещение (smart alert) поможет вам сообщить о цене, касающейся уровня объема. Концепция Smart Money. Low V
Features 3 types of waves: bullish, bearish and unknown. The unknown tower comes when prices move in opposite the direction of the current tower. Label that shows the percentage remaining for the next tower. Allows you set the type of volume that will be accumulated in the towers, either real or tick volumes. Thus, the indicator works in any market, for example: stocks, futures, forex, commodities, etc. Allows you to set the required score for the tower exchange. Allows you to set the font size
BoxChart MT5
Evgeny Shevtsov
5 (7)
Рынок несправедлив, хотя бы потому, что всего лишь 10% игроков управляют 90% капитала. У рядового трейдера мало шансов, чтобы противостоять этим «хищникам». Но выход есть, необходимо всего лишь перейти на другую сторону, необходимо находиться в числе этих 10% «акул», научиться распознавать их намерения и двигаться вместе с ними. Объем - это единственный опережающий фактор, который безупречно работает на любом периоде и любом торговом инструменте. Сначала зарождается и накапливается объем, и толь
The new update makes this indicator a complete tool for studying, analyzing and operating probabilistic patterns. It includes: On-chart Multi-asset percentage monitor. Configurable martingales. Twenty-one pre-configured patterns, including Mhi patterns and C3. An advanced pattern editor to store up to 5 custom patterns. Backtest mode to test results with loss reports. Trend filter. Hit operational filter. Martingale Cycles option. Various types of strategies and alerts. Confluence between patter
Уникальность данного индикатора заключается в алгоритме учёта объёмов: накопление происходит   непосредственно за выбранный период  без привязки к началу дня. Последние бары можно исключить из расчёта, тогда текущие данные будут меньше влиять на  значимые уровни (объёмы),   образованные ранее. Для более точного расчёта по умолчанию используются данные с графика М1. Шаг распределения ценовых объёмов регулируется. По умолчанию правая граница отображения установлена на бар, соответствующий началу и
Forex Volume MT5
KEENBASE SOFTWARE SOLUTIONS
KT Forex Volume shows the buying and selling volume of a currency pair in the form of a colored histogram. The volume is made of buying and selling transactions in an asset. In FX market: If the buying volume gets bigger than the selling volume, the price of a currency pair would go up. If the selling volume gets bigger than the buying volume, the price of a currency pair would go down. Features Avoid the bad trades by confirming them using the tick volume data. It helps you to stay on the si
Segmented Volume MT5
Eduardo Da Costa Custodio Santos
Индикатор сегментированного объема MT5 был создан для облегчения торговли с использованием анализа цен и объема, VSA, VPA, метода Wyckoff и системы Smart Money. Сегментированный объем работает на любом рынке (Crypto, CFD, Forex, Futures, Stocks ...) и работает в любое время графика. Посмотрите, насколько проста ваша интерпретация: # Зеленый: объем намного выше, чем в среднем по рынку. # Темно-розовый: громкость выше среднего. # Синий: положительная нормальная громкость. # Красный: отрицательная
Do you use volume in your reading of the market? Certainly many traders use it, and do not imagine operating without it. The Color Histogram Volume Set indicator allows the user to choose the value that he considers interesting to monitor. When you pass this you will have visual confirmation and if you want you will also have the audible alert that is given by the indicator. Of course, there are other ways to try to find a high volume, such as assessing whether the volume
Supply and Demand Indicator + FREE Currency Strength Meter ADD-ON Looking for a powerful tool that can help you identify the most reactive zones in the forex market? Our supply and demand indicator for MetaTrader 4 and 5 is exactly what you need. With its advanced algorithms and real-time analysis, this indicator helps traders of all experience levels make informed trading decisions. The supply and demand indicator is a cutting-edge tool that helps traders identify areas where buyers and sellers
Visual Depth of Market
Fernando Lahude Ritter
3.5 (6)
Level 2 Book Visualization Indicator Our innovative indicator seamlessly integrates Level 2 order book data onto your trading chart, offering a real-time view of market depth and the dynamics of supply and demand. With its two key features, you can enhance your market analysis and make more informed trading decisions: Biggest Volume Highlight: This input allows traders to instantly identify the price levels with the largest order lots. By highlighting the heaviest concentration of buy or sell or
FREE
To get access to MT4 version please click here . This is the exact conversion from TradingView: " WaveTrend" by LazyBear. This is a light-load processing and non-repaint indicator. All input options are available. Buffers are available for processing in EAs. You can message in private chat for further changes you need. The filling area option is omitted to fit into MT5 graphics.
Description: The Volume Profile displays detailed informations of historical trading activities at certain price levels (Market Profile). Locate the areas with the best prices in the market and get an advantage over other market participants. Features: Customizable Market Profile Shows the "fair" Value Area with 70% of all Volume Shows critical low volume zones Shows VPOC, VAL and VAH Points integrated resource management to reduce the load while working with multiple charts Works on all tim
Weiss Wave with lots of functionality and lightweight. The same can be used both in markets that have access to volume (REAL=Contracts, Tick=Business) or points! You will be able to:     - Analyze the volume of the market by swings made!     - Define the source of the data presented in the graphic, its size and color! Or simply hide this information!     - Define whether or not to show the swings in the graph and how many swings! In addition to setting the trend line color, thi
Wapv Price and volume
Eduardo Da Costa Custodio Santos
Индикатор цены и объема WAPV для MT5 является частью набора инструментов (Wyckoff Academy Wave Market) и (Wyckoff Academy Price and Volume). Индикатор цены и объема WAPV для MT5 был создан, чтобы упростить визуализацию движения объема на графике интуитивно понятным способом. С его помощью можно наблюдать моменты пикового объема и моменты, когда рынок не представляет профессионального интереса. Определите моменты, когда рынок движется по инерции, а не по движению «умных денег». Он состоит из 4 цв
The Volume by Price Indicator for MetaTrader 5 features Volume Profile and Market Profile TPO (Time Price Opportunity). Volume and TPO histogram bar and line charts. Volume Footprint charts. TPO letter and block marker collapsed and split structure charts. Session filtering and grouping. Static, dynamic and flexible range segmentation and compositing methods with relative and absolute visualizations. Graphical layering, positioning and styling options to suit the user's analytic and aesthetic n
This z-score indicator shows the correct z-score of an asset, as it uses the normalized price data for calculation, which is the only correct way. Z-score is only applicable for normal distributed data, therefore not the actual price is considered, but the normalised returns, which were assumed to follow a normal distribution. Returns are mean reverting and assumed to follow a normal distribution, therefore z-score calculation of returns is more reliable than z-score on price, as price is NOT m
Visual Heatmap Book Analyser This indicator monitors the market liquidity and generates colors based on order patterns, quantities, and renewal activities in the book. This allows you to visualize the order flow and identify areas of high and low liquidity and activity. The indicator uses machine learning techniques to analyze the order behavior in the book, enabling it to detect patterns and trends in orders, allowing you to make informed decisions about your trading operations. The color pal
Откройте для себя силу анализа объема с помощью нашего индикатора профиля объема для Metatrader!   /   Версия для MT4 Basic Volume Profile - это индикатор, специально разработанный для ручных трейдеров, желающих оптимизировать свою торговлю. Индикатор Volume Profile - это незаменимый инструмент для любого серьезного трейдера, желающего лучше понять поведение рынка. С помощью нашего инновационного решения вы можете четко и ясно представить, как распределяется объем торгов по ценам. Это позволи
Weis Waves
Flavio Javier Jarabeck
3.15 (26)
The original author is David Weis, an expert in the Wyckoff Method. The Weis Wave is a modern adaptation of the 1930's Wyckoff Method, another expert in Tape Reading techniques and Chart Analysis. Weis Waves takes market volume and stacks it into waves according to price conditions giving the trader valuable insights about the market conditions. If you want to learn more about this subject you can find tons of videos in YouTube. Just look for "The Wickoff Method", "Weis Wave" and "Volume Spread
FREE
Индикатор отображает на графике уровни пиковой активности, образованные свечами с пиковым содержанием объёма, отслеживая корреляцию таких свечей на таймфреймах, от старшего к младшему. Каждый объёмный уровень, в результате, представляет собой некую ключевую проторговку, наиболее важный кластер - внутри месяца, внутри недели, внутри дня, внутри часа и т.д.. Особенности работы индикатора Объёмный уровень приобретает статус Demand (спрос), если ближайший к нему объёмный уровень, находящийся левее
Key level wedge MT5
Presley Annais Tatenda Meck
The   Key level wedge MT5   indicator automatically draws rising wedge pattern and falling wedge pattern for you on the chart. This pattern is really good when used as a confirmation entry at key support & resistance, supply & demand and reversal zones. Advantages  The   Key level wedge MT5   block DOES NOT RE-PAINT, giving you confidence when a signal appears and also helps when looking back.  The   Key level wedge MT5   includes an on/off button on the chart to easily keep the charts cle
Value Chart Candlesticks
Flavio Javier Jarabeck
4.67 (9)
The idea of a Value Chart indicator was presented in the very good book I read back in 2020 , " Dynamic Trading Indicators: Winning with Value Charts and Price Action Profile ", from the authors Mark Helweg and David Stendahl. The idea is simple and the result is pure genius: Present candlestick Price analysis in a detrended way! HOW TO READ THIS INDICATOR Look for Overbought and Oversold levels. Of course, you will need to test the settings a lot to find the "correct" one for your approach.
FREE
Объем и MarketProfile Pro Описание: Индикатор MarketProfile предоставляет точный и детализированный анализ торгового объема по различным уровням цен. Он рассчитывает и отображает профиль объема для каждого торгового дня, помогая вам понять структуру рынка и распределение объема для принятия обоснованных торговых решений. Основные характеристики: Ежедневный анализ объема: Индикатор рассчитывает и отображает профиль объема для каждого торгового дня, позволяя вам легко определить распределение объ
Индикатор "VSA on the FLY" предназначен для быстрого отображения различных параметров Volume Profile / Market Profile. Исходные данные для работы индикатор берет из минутного таймфрейма. Индикатор устанавливается на любой таймфрейм и начинает отображать данные начиная от выбранной левой границы. Этой границей может быть начало дня, недели, торговой сессии, любого часа и т.д. Версия данного индикатора для MetaTrader 4 находится здесь . Доступны следующие входные параметры: Show VWAP . Ото
С этим продуктом покупают
Прежде всего стоит подчеркнуть, что этот торговый индикатор не перерисовывается, не перерисовывает и не отставает, что делает его идеальным как для ручной, так и для роботизированной торговли. Руководство пользователя: настройки, вводы и стратегия. Атомный аналитик - это индикатор ценового действия PA, который использует силу и импульс цены, чтобы найти лучший край на рынке. Оборудованный расширенными фильтрами, которые помогают убирать шумы и ложные сигналы, и повышают торговый потенциал. Испо
The AT Forex Indicator MT5 is a sophisticated trading tool designed to provide traders with a comprehensive analysis of multiple currency pairs. This powerful indicator simplifies the complex nature of the forex market, making it accessible for both novice and experienced traders. AT Forex Indicator uses advanced algorithms to detect trends, patterns and is an essential tool for traders aiming to enhance their forex trading performance. With its robust features, ease of use, and reliable signal
Reversal First Impulse levels (RFI)          INSTRUCTIONS     RUS      -      ENG          Рекомендуем использовать с индикатором - TPSpro  TREND PRO -  Version MT4             Важным ключевым элементом в трейдинге являются зоны или уровни, от которых принимаются решения о покупке или продаже торгового инструмента. Несмотря на попытки крупных игроков скрыть свое присутствие на рынке, они неизбежно оставляют следы. Наша задача заключалась в том, чтобы научиться находить эти следы и правильно их
TPA True Price Action indicator reveals the true price action of the market makers through 100% non-repainting signals strictly at the close of a candle! TPA shows entries and re-entries, every time the bulls are definitely stronger than the bears and vice versa. Not to confuse with red/green candles. The shift of power gets confirmed at the earliest stage and is ONE exit strategy of several. There are available now two free parts of the TPA User Guide for our customers. The first "The Basics"
Currently Price  20% OFF  ( for unlimited use ) Indicator   USER MANUAL , trade setups, solving issues, etc :  Direct Download Here     (  for users only  ) Hello World! Introducing.. SMCpro tool and Indicator for  MetaTrader 5 , a cutting-edge feature designed to revolutionize your trading experience. With innovative ICT Smart Money Concept, you gain unparalleled insight into market dynamics, empowering you to make informed trading decisions like never before. SMC Indicator built on th
Step into the realm of Forex trading with confidence and precision using XQ, a cutting-edge Forex indicator designed to elevate your trading game to unprecedented heights. Whether you're a seasoned trader or just stepping into the world of currency exchange, XQ Forex Indicator empowers you with the insights and signals needed to make informed trading decisions. The signal conditions are a combination of three indicators, and XQ Forex Indicator only display  medium and long-term trends . The ind
All in One package includes the  Oscillator Predictor ,  MACD Predictor ,  Thrust Scanner  and  Advanced Fibonacci  indicators which are mandatory for applying  Dinapoli  trade plans.  Please visit below links for detailed explanations of indicators. Advanced Fibonacci Indicator =>  https://www.mql5.com/en/market/product/107933 Thrust Scanner Indicator =>  https://www.mql5.com/en/market/product/52829 Overbought /Oversold Predictor indicator => https://www.mql5.com/en/market/product/52628 Macd
3 Indicators in 1 indicator Strategy based on price action Made specifically for the best forex currency pairs Can be used in the best time frame of the market at a very reasonable price This indicator is basically 3 different indicatos . But we have combined these 3 indicators in 1 indicator so that you can use 3 indicators at the lowest price. All three strategies are based on price action. But based on different trends. Long term, medium term and short term Attributes : No repaintin
WHY IS OUR FXACCCURATE LS MT5 THE PROFITABLE ? PROTECT YOUR CAPITAL WITH RISK MANAGEMENT Gives entry, stop and target levels from time to time. It finds Trading opportunities by analyzing what the price is doing during established trends. POWERFUL INDICATOR FOR A RELIABLE STRATEGIES We have made these indicators with a lot of years of hard work. It is made at a very advanced level. Established trends provide dozens of trading opportunities, but most trend indicators completely ignore them!
note: this indicator is for METATRADER4, if you want the version for METATRADER5 this is the link:  https://www.mql5.com/it/market/product/108106 TRENDMAESTRO ver 2.4 TRENDMAESTRO recognizes a new TREND in the bud, he never makes mistakes. The certainty of identifying a new TREND is priceless. DESCRIPTION TRENDMAESTRO identifies a new TREND in the bud, this indicator examines the volatility, volumes and momentum to identify the moment in which there is an explosion of one or more of these data a
«Пиранья» - автономная торговая система, определяющая уровни перекупленности и перепроданности на графике. Красная и синяя зоны отображают уровни перекупленности и перепроданности соответственно. Вход в сделку обозначен стрелками: стрелка вниз в красной зоне для "sell" и стрелка вверх в синей зоне для "buy". Уровень Тейк профита обозначен зеленой средней скользящей. Важные особенности: Регулировка уровня Тейк профита при изменении положения зеленой средней скользящей. Возможность усреднения пр
40% СКИДКА НА РОЖДЕСТВО! ПОВЫШЕНИЕ ЦЕНЫ ДО $250 С 1 ЯНВАРЯ! Представляем GoldenGate Entries: Революционное Торговое Решение! Откройте для себя революционный подход к торговле с GoldenGate Entries (GGE), передовым индикатором, разработанным для повышения вашего опыта торговли. GGE предоставляет обширный набор функций, чтобы предоставить пользователям точность и уверенность в их торговых решениях. Пары: Любые (валюты - товары - акции - акции - криптовалюты) Таймфреймы: 15 минут до H1 Ос
ЭТОТ ИНДИКАТОР, ОСНОВАННЫЙ НА ИСКУССТВЕННОМ ИНТЕЛЛЕКТЕ, определяет возможные точки разворота рынка, считывая следы, и ЗАРАНЕЕ сигнализирует о небольших движениях рынка до того, как они произойдут. В отличие от индикаторов цены и объема, которые генерируют «поздние» входы, т. е. когда подтверждение цены или объема уже произошло при изменении направления и, следовательно, часто движение уже закончилось, этот индикатор сигнализирует, основываясь на том, что он читает в след, «КОГДА ДВИЖЕНИЕ ДОЛЖНО
Welcome to the world of SMC (Smart Money Concepts) Trading, where we empower traders with the tools and knowledge to make smarter trading decisions. Our latest addition to our suite of trading tools is the SMC Trading Pro indicator, version 1.0. Key Features: Major Market Structure Identification with BODY break. Order Block must be in Major Swing ( not Small Swing ). Order Block with Fair Value Gap Detection. Order Block in Discount | Premium zone. Filter for only Bullish, Bearish or All Order
Introducing the South African Sniper indicator created by a small group of traders with a few years trading trading the financial market profitably . This is a plug and play indicator that provides you with  BUY and SELL (SNIPER ENTRY) signals with TARGET and trail stops. The indicator Works with all MT5 trading instruments. The indicator uses previous  chart data as receipt to speculate on future market moves.  "The South African Sniper indicator community are very happy with the indicator an
Следуйте тренду.  Да, дождитесь сигнала на вход, будь то покупка или продажа, и входите по цене, а прибыль берется при изменении линии рисования, фиксации прибыли или при появлении противоположного сигнала. Это очень просто и работает на всех. валюты, металлы, индексы и на всех кадрах.   Как войти?  Дождитесь сигнала на покупку или продажу и входите по нему. Зафиксировать или зарезервировать прибыль можно после изменения линии рисунка или появления противоположного сигнала.
Доброго времени суток! Представляю вам торговый технический индикатор для синтетических индексов брокера Deriv. Данный индикатор работает ТОЛЬКО с нижеуказанными индексами: Boom 300 Index Boom 500 Index Boom 1000 Index Crash 300 Index Crash 500 Index Crash 1000 Index Индикатор создан для подачи сигналов на открытие среднесрочных сделок в сторону Спайков. Но вы можете открывать сделки и в противоположную Спайкам сторону, на свой риск. Торговля только на М1. Другие ТФ не гарантируют корректную р
Индикатор формирует входные сигналы по БИНАРНЫМ ОПЦИОНАМ, рисуя стрелку на графике и издавая звуковой сигнал. ВРЕМЯ РАБОТЫ: 6.00 GMT/ 17.00 GMT (не рекомендуется после 17.00 GMT и ночью из-за слишком низкой волатильности и отсутствия объемов) ПАРЫ: EUR/USD (@EU6), GBP/USD (BP6). Таймфреймы: 1,2,3,5,10,15 минут Лучший таймфрейм: 3 минуты СРОК ГОДНОСТИ: 1 свеча Индикатору для работы нужны реальные объемы (без тиковых объемов): он не работает на спотовых парах EUR/USD, GBP/USD ECC, а на
Сложно найти и дефицит по частоте, дивергенции являются одним из самых надежных торговых сценариев. Этот индикатор автоматически находит и сканирует регулярные и скрытые расхождения, используя ваш любимый осциллятор. [ Руководство по установке | Руководство по обновлению | Устранение неполадок | FAQ | Все продукты ] Легко торговать Находит регулярные и скрытые расхождения Поддерживает много известных генераторов Реализует торговые сигналы на основе прорывов Отображает подходящие уровни ст
Trend Trading - это индикатор, предназначенный для получения максимальной прибыли от трендов, происходящих на рынке, путем определения времени отката и прорыва. Он находит торговые возможности, анализируя, что делает цена во время установленных тенденций. [ Руководство по установке | Руководство по обновлению | Устранение неполадок | FAQ | Все продукты ] Торгуйте на финансовых рынках с уверенностью и эффективностью Прибыль от устоявшихся тенденций без проволочек Признать прибыльные откаты,
Это, пожалуй, самый полный индикатор автоматического распознавания гармонического ценообразования, который вы можете найти для платформы MetaTrader. Он обнаруживает 19 различных паттернов, воспринимает проекции Фибоначчи так же серьезно, как и вы, отображает зону потенциального разворота (PRZ) и находит подходящие уровни стоп-лосс и тейк-профит. [ Руководство по установке | Руководство по обновлению | Устранение неполадок | FAQ | Все продукты ] Он обнаруживает 19 различных гармонических цен
Свинг-трейдинг - это первый индикатор, предназначенный для обнаружения колебаний в направлении тренда и возможных разворотов. Он использует базовый подход свинговой торговли, широко описанный в торговой литературе. Индикатор изучает несколько векторов цен и времени для отслеживания направления совокупного тренда и выявляет ситуации, когда рынок перепродан или перекуплен и готов к исправлению. [ Руководство по установке | Руководство по обновлению | Устранение неполадок | FAQ | Все продукты ]
MetaForecast M5
Vahidreza Heidar Gholami
5 (2)
MetaForecast предсказывает и визуализирует будущее любого рынка на основе гармонии в данных о ценах. Хотя рынок не всегда предсказуем, если существует узнаваемый паттерн в ценах, то MetaForecast способен предсказать будущее с наибольшей точностью. По сравнению с другими аналогичными продуктами, MetaForecast способен генерировать более точные результаты, анализируя тренды на рынке. Входные параметры Past size (Размер прошлых данных) Указывает количество баров, которые MetaForecast использует дл
Этот индикатор обнаруживает разворот цены зигзагообразно, используя только анализ ценового действия и канал Дончиана. Он был специально разработан для краткосрочной торговли, без перекраски или перекраски вообще. Это фантастический инструмент для проницательных трейдеров, стремящихся увеличить сроки своих операций. [ Руководство по установке | Руководство по обновлению | Устранение неполадок | FAQ | Все продукты ] Удивительно легко торговать Это обеспечивает ценность на каждом таймфрейме Ре
IVISTscalp5
Vadym Zhukovskyi
5 (5)
Что нового в индикаторе прогнозов iVISTscalp5 (Версия 10)? iVISTscalp5 – это авторская система прогнозов для любого финансового инструмента на неделю вперед (для быстрого скальпинга по уровням времени). iVISTscalp5 – инструмент для простого изучения и понимания финансового рынка. 1)     Индикатор прогнозов iVISTscalp5 полностью переписан на другой язык программирования ( C ++), что ускорило загрузку и обработку данных. Разное графическое отображение прогнозов на графике будет еще проще для п
Инструмент для скальпинга на Deriv Описание: Данный торговый индикатор разработан для трейдеров, специализирующихся на скальпинге. Он предоставляет сигналы для торговли в направлении краткосрочных ценовых движений. Индикатор оптимизирован для работы на таймфрейме М1 и поддерживает индексы Boom и Crash (300, 500, 1000). Особенности: Направление торговли: в сторону краткосрочных ценовых движений. Фильтры и индикаторы: Индикатор объемов реакций: отображает зоны активности. Индикатор тренда: анали
Индикатор Volume Spread Analysis основан на оригинальном методе Volume Spread Analysis. Он был разработан для быстрого и легкого распознавания паттернов VSA. Несмотря на то, что индикатор выглядит очень просто, это самый сложный инструмент из всех, которые мы когда-либо создавали. Это действительно мощный аналитический инструмент, который генерирует очень надежные торговые сигналы. Поскольку он очень удобен и понятен, он подходит для любого типа трейдера, независимо от его опыта.
Noize Absorption Index - is the manual trading system that measures the difference of pressure between bears forces and bulls forces. Green line - is a noize free index that showing curent situation. Zero value of index shows totally choppy/flat market.Values above zero level shows how powerfull bullish wave is and values below zero measures bearish forces.Up arrow appears on bearish market when it's ready to reverse, dn arrow appears on weak bullish market, as a result of reverse expectation.
Introducing the Power Trade Plus indicator designed by a small group of traders with a few years of experience trading the market profitably.  The Power Trade Plus is derived from the Power Trade indicator,  the indicator strive in powerful sniper entries and take profit levels,  with an algorithm that's can determine the markets volatility and Provides entries based on the current market volatility. This indicator is much more effective in stock ,currencies and indices.
Индикатор Gann Squares представляет собой мощный инструмент для анализа рынка, основанный на математических концепциях, представленных W.D. Gann в его статье "Математическая формула для прогнозирования рынка." Этот индикатор включает в себя техники Ганна, связанные с квадратными числами, такими как 144, 90 и 52, а также Квадрат 9. Кроме того, он включает метод по использованию Квадрата 9 в сочетании с каналами и паттерном звезды. Руководство пользователя и использование: Перед использованием это
Другие продукты этого автора
FabFrequency
Fabiano Luiz Roberto
1 (1)
This simple indicator creates a ZigZag based on market frequency. It can be very useful for those who trade TapeReading. Switch between the various timeframes and note that the ZigZag will be maintained, this is due to the method used to create a timeless indicator. Set the main input parameter: nTicks: Number of ticks for frequency inversion The other parameters are for visual aspects only, try them.
FREE
Фильтр:
epadilha
609
epadilha 2022.07.15 18:19 
 

O meu não tá rodando tá congelando tudo

Fabiano Luiz Roberto
639
Ответ разработчика Fabiano Luiz Roberto 2022.07.16 04:21
Olá... quero ajudá-lo a rodar. Te enviei uma mensagem (pelo canal de mensagens) e vamos conversando. Obrigado pelo contato.
Ответ на отзыв
Версия 1.2 2022.07.20
Some performance improvements