• Обзор
  • Отзывы
  • Обсуждение

TradeArray Scalping

Профессиональный торговый индикатор с возможностью двойного входа. Ценные Гладкие Линии Канала в отдельном окне, Линии Тренда как в главном окне, так и отдельное окно и стрелки входа. Подходит для скальпинга на младших таймфреймах. Также он может работать и давать сигналы на старших таймфреймах для более длительных торговых периодов.

НАСТРОЙКИ ИНДИКАТОРА:

1. Сигнальный режим. Есть 2 варианта: Стандартный и Компактный. Если выбрано значение по умолчанию, в главном окне будут отображаться 3 разных кода стрелок. Этот вариант хорош для опытных трейдеров, которые хотят получить больше возможностей для входа. Короткие линии тренда и стрелки на графике являются подсказками к торговым зонам. Вы можете комбинировать свой опыт, например графические паттерны или уровни Фибоначчи. В противном случае выберите Signal Mode: Compact и следуйте предупреждениям. Компактность означает сочетание этих трех стрелок с правильной настройкой.

2. Период тренда. Это период Основного Тренда в Главном окне и тренда в отдельном окне.

3. Трендовый метод. Выберите метод тренда здесь. Это простой, экспоненциальный, сглаженный и линейный вес. Дважды щелкните, чтобы выбрать их.

4. Применяемая цена тренда. Дважды щелкните здесь, чтобы выбрать Прикладную цену тренда.

5. Трендовый фильтр. Более низкое значение будет более сглаженным, и наоборот.

6. Период канала. Это период линии канала в отдельном окне.

7. Метод канала. Это метод канальной линии. (Линия Золотого Рода)

8. Канальный метод. Метод канала (Dot и SlateGray Lines)

9. Фильтр каналов. Фильтр канала. Более низкое значение будет более сглаженным, и наоборот.

10. Отклонение канала. Отклонение канала.

11. Используйте максимальные бары. Максимальное количество баров индикатора для отображения буферов на графике. Если true, задайте значение ниже, иначе индикатор будет отображать буферы на всех барах. Это может привести к замедлению mt4, если вы прикрепите его к нескольким графикам.

12. Максимальные бары. Определите общее количество баров, как указано в пункте 11 выше.

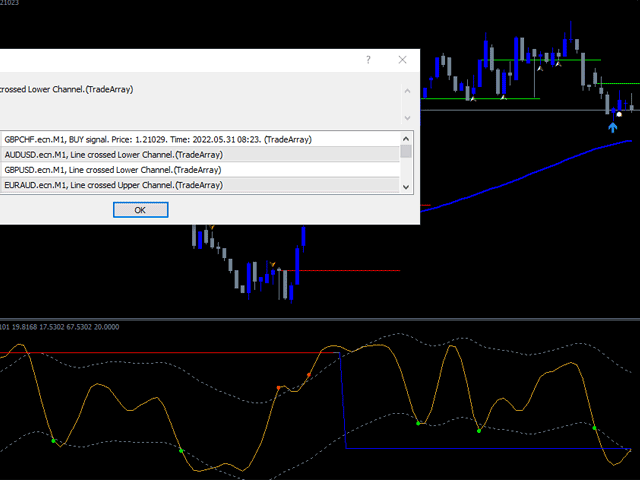
13. Оповещения о пересечении линий верхнего/нижнего каналов. Если это правда, он будет отправлять оповещения каждый раз, когда линии пересекают канал.

14. Всплывающее оповещение. Если true, на графике будут появляться всплывающие оповещения.

15. Мобильное уведомление. Если это правда, он будет отправлять оповещения на mt4 mobile. Необходимо настроить мобильное оповещение.

16. Оповещение по электронной почте. Если это правда, он будет отправлять оповещения по электронной почте. Не забудьте правильно настроить электронную почту.


КАК ТОРГОВАТЬ

Основные правила: короткая горизонтальная линия, тренд в главном окне и тренд в отдельном окне.
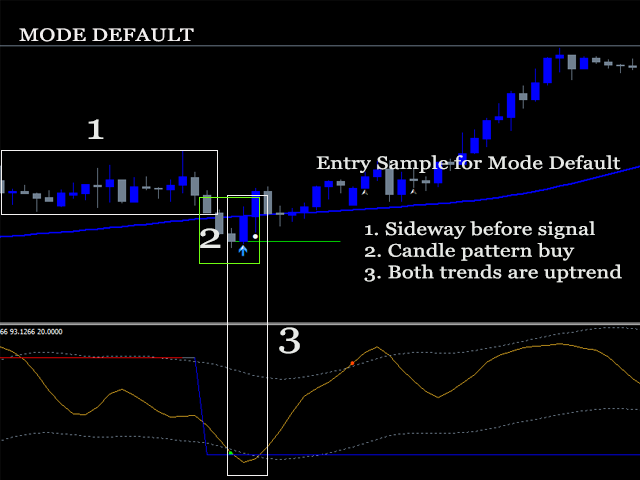
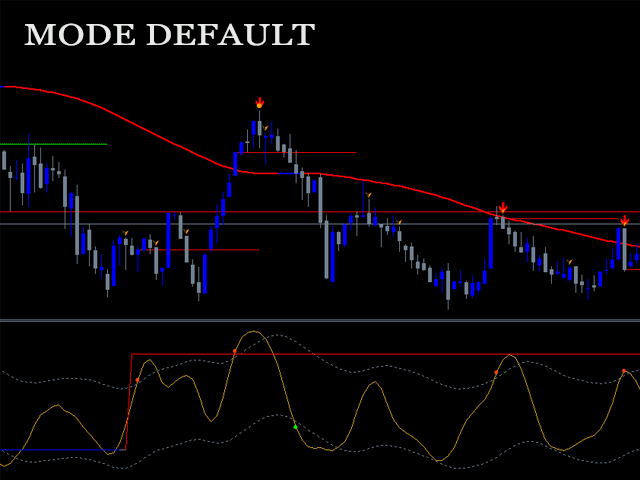
Режим по умолчанию:

Этот режим рекомендуется для опытных трейдеров.

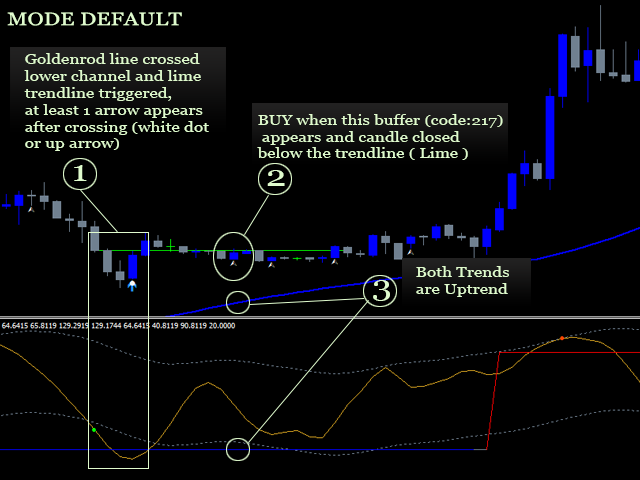
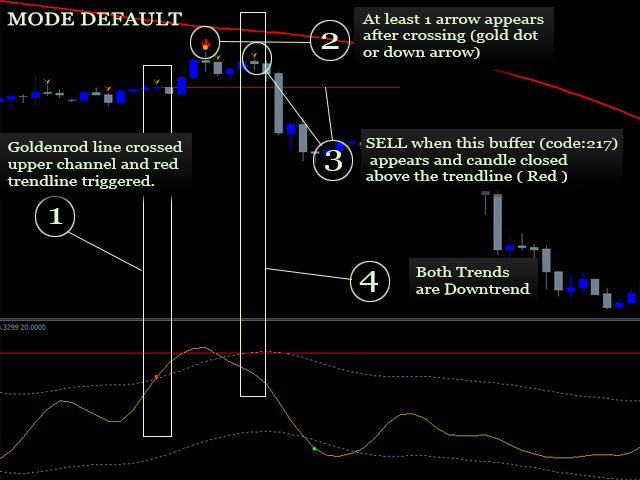
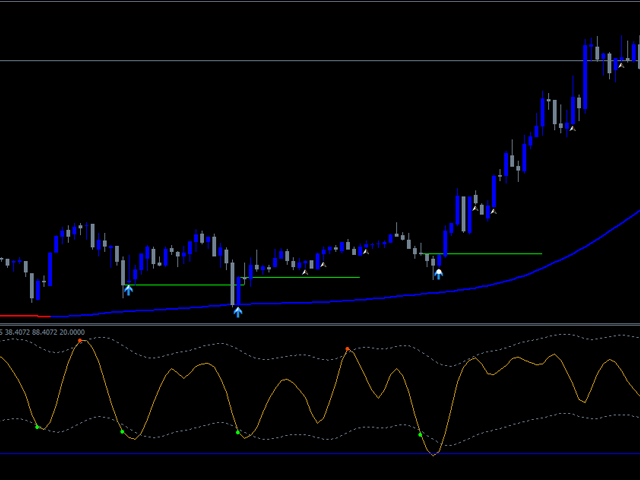
Индикатор будет рисовать короткие линии тренда в главном окне, когда линия золотарника в отдельном окне пересекает нижний/верхний каналы (красный = перекупленность, салатовый = перепроданность). Ожидание появления стрелок в этот момент (точка или стрелка вверх/вниз). Пожалуйста, убедитесь, что тренд отдельного окна и тренд главного окна имеют одинаковое направление (красный = нисходящий тренд, синий = восходящий тренд). Проверьте паттерны более высоких свечей или основные графические паттерны или уровни Фибоначчи, затем откройте позицию, если сработала стрелка 217, и свеча закрылась ниже линии тренда лайма для покупки или закрытие свечи выше красной линии тренда для продажи. Смотрите изображение для более подробной информации.
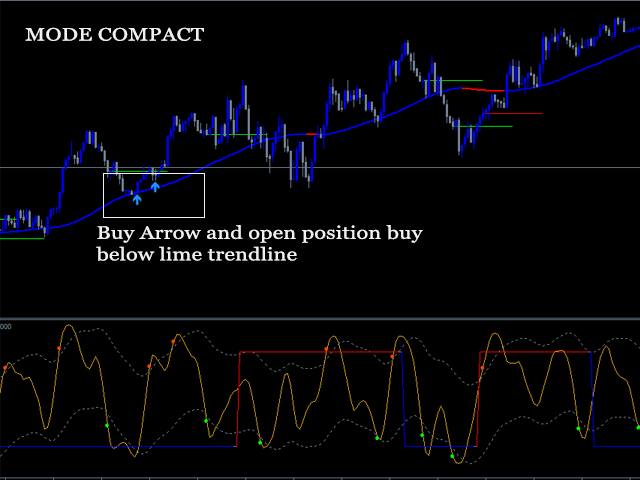
Компактный режим:

Просто установите Signal Mode = Compact и следуйте предупреждениям.


ПРЕДЛОЖЕНИЯ:

1. Азиатско-европейская сессия – лучшее время для торговли.

2. Избегайте торговли на очень высоких новостях или за 2-3 часа до закрытия рынка или вблизи экстремального разрыва свечи.

3. Продолжение тренда или рынок в боковом тренде (маленькие свечи) после смены тренда — лучшие условия для входа.


Note: The description above is translated by google. There might be a translation error. Please contact us in english if you have any questions related with indicator.


Рекомендуем также
Индикатор FiboZag - перенесите индикатор на график и уровни Фибоначчи будут построены автоматически по последнему развороту ZigZag-а. Основное преимущество заключается в корректном построении уровней Фибоначчи и разметке ценовых уровней. Простое, визуальное и эффективное использование. Индикатор не перерисовывается и не запаздывает. Работает на всех валютных парах и на всех таймфреймах.
Supply Demand Zone Pro Indicator works with all products and timeframes. It is using a new calculation method, and now you can select the desired zone on any timeframe! Strongest Zones are already enabled by default This is a great advantage in trading.This indicator has a built in backtester enabled by default, just move the chart. Supply and Demand ? Supply is a price zone where sellers outnumbered buyers and drove the price lower. Demand is a price zone where buyers outnumbers sellers and
Индикатор показывает изменения цены за те же дни в прошлые годы. Требуется таймфрейм D1. Индикатор предсказывает на основе баров D1 на тех же днях прошлых лет относительное изменение цен. Параметры: LookForward - количество дней (баров) для показа "будущих" изменений цен; по-умолчанию - 5; Offset - количество дней (баров) для сдвига назад по истории; по-умолчанию - 0; ShowAverage - переключатель режима; true - показывать среднее для всех 8 прошлых лет и границы стандартного отклонения; false - п
FREE
Classic Fractals indicator for MT4, with additional Trendlines connecting the latest couples of fractals ( fractals are showing highest high, and lowest low on each period) Rules for trendlines: -if new top fractal is below the last one = new resistance line -if new bot fractal is above the last one = new support line -Trendlines can be hidden -Fractals can be hidden Fractal Period = can be both even or uneven number, as it is setting for half (one side) of the bars sequence
Уникальная мультивалютная авторская стратегия, разработана для торговли на временном периоде Н1, что позволяет определять глобальные точки входа в рынок и получать максимальную прибыль по каждой сделке. Точка входа в рынок рассчитывается с помощью множества авторских формул и алгоритмов. Рекомендуем использовать индикатор одновременно на нескольких торговых инструментах. Огромным плюсом Big Deals System является наличие информационной панели, в которой пользователь может увидеть актуальную инфор
Добрый День уважаемые трейдеры!  Вашему вниманию индикатор созданный и работающий на базе трендовика ADX,  для торговли на смене направления движения который учитывает коррекцию и даёт возможность на ней заработать.  Применяю этот индикатор для скальпинга. Рекомендую таймфреймы от 15 ти минутного(М15) до часового (Н1) периодов.  Красный кружок сигнал на продажу- Sell) Зелёный кружок  сигнал на покупку Buy) Чем меньше ваш таймфрейм тем меньше пунктов вы зарабатываете.   Важно выставлять стопы! !В
MetaTrend M4
Vahidreza Heidar Gholami
5 (1)
Meta Trend Indicator is an efficient way to forecast and detect the trend in any market. It reveals the trend, support and resistance levels, volatility and the maximum potential target, all in one indicator. To adapt to the price and to decrease consecutive trend failures, the internal trend detector algorithm studies the market and dynamically chooses the right values for the internal parameters. This indicator is a perfect trend filter for any strategy or expert advisor. Features Super Adapti
Reversals typically refer to large price changes, where the trend changes direction. Small counter-moves against the trend are called pullbacks or consolidations.When it starts to occur, a reversal isn't distinguishable from a pullback. A reversal keeps going and forms a new trend, while a pullback ends and then the price starts moving back in the trending direction. Difference Between a Reversal and a Pullback A reversal is a trend change in the price of an asset. A pullback is a counter-move w
Fibonacci retracement and extension line drawing tool Fibonacci retracement and extended line drawing tool for MT4 platform is suitable for traders who use  golden section trading Advantages: There is no extra line, no too long line, and it is easy to observe and find trading opportunities Trial version: https://www.mql5.com/zh/market/product/35884 Main functions: 1. Multiple groups of Fibonacci turns can be drawn directly, and the relationship between important turning points
BSA indicator is a ZigZag based indicator. This indicator is used to find the reversal level of the price. You can use the existing risk ratio and calculation timeframe in the entries by optimizing them according to your usage preference.  In lower time frames, the indicator can repaint. For healthier results, you can detect the least repainting by observing for a while according to the graphic you will apply.
Average Daily Range (ADR) SR is an indicator which shows how far a currency pair can move in a day. It can be used to find hidden support and resistance levels (SR), estimate effective profit and stop loss targets, and provide short term trade signals from the hidden SR levels. Features Automatically plots on the chat, the top and bottom of the ADR value (i.e. a horizontal channel) which acts as Support and Resistance Levels Automatically calculates the percentage of the ADR reached by the curr
Инновационный индикатор, использующий эксклюзивный алгоритм для быстрого и точного определения тренда. Индикатор автоматически рассчитывает время открытия и закрытия позиций, а также подробную статистику работы индикатора на заданном отрезке истории, что позволяет выбрать наилучший торговый инструмент для торговли. Вы также можете подключить свои пользовательские стрелочные индикаторы к Scalper Inside Pro для проверки и расчета их статистики и прибыльности. Scalper Inside PRO инструкция и настро
Прежде всего стоит подчеркнуть, что этот торговый индикатор не перерисовывается, не перерисовывает и не отставает, что делает его идеальным как для ручной, так и для роботизированной торговли. Руководство пользователя: настройки, вводы и стратегия. Атомный аналитик - это индикатор ценового действия PA, который использует силу и импульс цены, чтобы найти лучший край на рынке. Оборудованный расширенными фильтрами, которые помогают убирать шумы и ложные сигналы, и повышают торговый потенциал. Испо
This   Real Magic Trend   indicator is designed for signal trading. This indicator generates trend signals. It uses many algorithms and indicators to generate this signal. It tries to generate signals from the points with the highest trend potential. This indicator is a complete trading product. This indicator does not need any additional indicators. The indicator is never repainted. The point at which the signal is given does not change.      Features and Recommendations Time Frame
DoAid
Samuel Akinbowale
5 (1)
DoAid DoAid indicator is a simple channel indicator with an advance timeframe correlation board. DoAid indicator: can be used with any instrument provided by your broker and MetaTrader, be it Currency , Commodity ,Stock, or Cryptocurrencies. DoAid indicator   can be used for swing, scalping and day trading. DoAid indicator   is also a multi time-frame indicator {MTF}. DoAid indicator can be used with any timeframe. It does not repaint.It does not repaint. When To Buy if the market
The Breaker Blocks with Signals indicator aims to highlight a complete methodology based on breaker blocks. Breakout signals between the price and breaker blocks are highlighted and premium/discount swing levels are included to provide potential take profit/stop loss levels. This script also includes alerts for each signal highlighted.   SETTINGS   Breaker Blocks Length: Sensitivity of the detected swings used to construct breaker blocks. Higher values will return longer te
Set TP and SL like Financial Institutions Traders' TP expectations do not often occur and their SL often hits when they only rely on primitive indicators like pivot-points and Fibonacci or classic support or resistance areas. There are a variety of indicators for support/resistance levels, whereas they are seldom accurate enough. Classical support/resistance indicators, often present miss levels and are not noteworthy based on current market volatility dynamic. Fibonacci is good but not enou
Perfect for one minutes high trading and scalping. This indicator is very effective for trading on one minutes, in the hour. A combination of moving averages and STOCHASTICS calculation to produce a very convincing signal every hour. Blue colour signals a buy opportunity. Follow the X signs for possible buy points. The Blue average line serves as possible trend direction and support. Red colour signals a sell opportunity. Follow the X signs for possible sell points. The Red average line serves a
VR Cub
Vladimir Pastushak
VR Cub это индикатор что бы получать качественные точки входа. Индикатор разрабатывался с целью облегчить математические расчеты и упростить поиск точек входа в позицию. Торговая стратегия, для которой писался индикатор, уже много лет доказывает свою эффективность. Простота торговой стратегии является ее большим преимуществом, что позволяет успешно торговать по ней даже начинающим трейдерам. VR Cub рассчитывает точки открытия позиций и целевые уровни Take Profit и Stop Loss, что значительно повы
Credible Cross System   indicator is designed for signal trading. This indicator generates trend signals. It uses many algorithms and indicators to generate this signal. It tries to generate a signal from the points with the highest trend potential. The indicator works based on instant price movements. This indicator is a complete trading product. This indicator does not need any additional indicators. The indicator certainly does not repaint. The point at which the signal is given does not
Key level wedge pro
Presley Annais Tatenda Meck
5 (1)
We have combined all of our beloved indicators the likes of: Key level order block , Key level supply and demand , Key level liquidity grab and Key level wedge into one single indicator and dashboard. Whats new Dashboard : There is an easy access dashboard for all your needs. Multi-timeframe button : There is now a multi-timeframe option for Order Blocks and Supply and demand zones, making it easy to see higher timeframe zones easily on the current timeframe by just clicking the desired timefr
Индикатор поддержки и сопротивления для бинарных опционов Этот индикатор разработан специально для торговли бинарными опционами и отлично показывает откаты от уровней поддержки и сопротивления. Сигналы появляются на текущей свече. Красная стрелка, направленная вниз, указывает на потенциальную возможность продажи, а синяя стрелка, направленная вверх, предлагает возможности для покупки. Все, что вам нужно настроить, это цвет сигнальных стрелок. Рекомендуется использовать его на таймфреймах M1-M5,
Provides instant signals on the chart in panel form. Equipped with signal description and trading analysis tools such as drawing auto trendlines, support/resistance area, regression channel, Fibonacci levels, Pivot levels and current signal price, signal time, signal expiry and stoploss recommendation. Also sending alert messages to all available mt4 alert tool. A detailed description panel provides information about where the signal comes from and what indicators are behind the signal. Includin
YK-Fibo Pivot Indicator: Trade Smarter with Fibonacci Pivot Points The YK-Fibo Pivot Indicator is a powerful technical analysis tool that combines the precision of Fibonacci retracements with the insights of Pivot Points. Whether you're a novice or seasoned trader, this indicator empowers you to spot profitable opportunities in the market with ease. Why Choose YK-Fibo Pivot? Pinpoint Support & Resistance: By calculating Fibonacci levels based on the previous day's high, low, and close prices, y
The   True Magic Oscillator   indicator is designed for signal trading. This indicator generates trend signals. It uses many algorithms and indicators to generate this signal. It tries to generate signals from the points with the highest trend potential. This indicator is a complete trading product. This indicator does not need any additional indicators. The indicator is never repainted. The point at which the signal is given does not change.         Features and Recommendations Wor
Promotion $66 lifetime for you. The principle of this indicator is very simple: detecting the trend with Moving Average, then monitoring the return point of graph by using the crossing of Stochastic Oscillator and finally predicting BUY and SELL signal with arrows, alerts and notifications. The parameters are fixed and automatically calculated on each time frame. Example: If you install indicator on EURUSD, timeframe M5: the indicator will detect the main trend with the Moving Average on this
Данный индикатор предназначен для работы на любом ТФ. Программа на основе авторских алгоритмов и математике W.D.Ganna позволяет рассчитать целевые уровни движения цены по трем точкам с высочайшей степенью достоверности. Является прекрасным инструментом для биржевой торговли. Индикатор оснащен тремя кнопками NEW - вызвать треугольник для расчета. DEL - удалить выбранный треугольник. DELS - полностью удалить все построения. Вероятность достижения целей более 80%. Так же индикатор оснащен сигналом
Automated Trendlines
Georgios Kalomoiropoulos
5 (17)
Линии тренда являются наиболее важным инструментом технического анализа в торговле на рынке Форекс. К сожалению, большинство трейдеров рисуют их неправильно. Индикатор Automated Trendlines — это профессиональный инструмент для серьезных трейдеров, который поможет вам визуализировать трендовое движение рынков. Есть два типа линий тренда: бычьи линии тренда и медвежьи линии тренда. В восходящем тренде линия тренда Форекс проводится через самые низкие точки колебания ценового движения. Сое
Уникальная мультивалютная авторская стратегия, одновременно определяющая силу трендов и точки входа в рынок, визуализируя это с помощью гистограмм на графике. Индикатор оптимально адаптирован для торговли на временных периодах М5, М15, М30, Н1. При этом для удобства пользователя по определенной точке всегда появляется точка входа (в виде стрелки), рекомендуемые уровни получения прибыли (TP1, TP2 с текстовыми метками) и рекомендация по установке Стоп Лосс. Уровни получения прибыли (TP1, TP2) авто
VJ Pivot Levels
Vijayaratna Kumar Boda
4.4 (5)
Введение: Какой бы метод торговли вы не использовали, важно знать уровни разворотов (Pivot levels) для того, чтобы обратить все внимание на ваши вхождения и выходы. Данный индикатор был разработан с использованием стандартной классической формулы автоматического построения уровней разворота. Он также основан на торговом диапазоне предыдущего дня, вероятный ожидаемый торговый диапазон текущего дня выделяется другим цветом, для вашей информации. Вывод индикатора: Данный индикатор рисует уровни р
С этим продуктом покупают
Trend Pulse
Mohamed Hassan
5 (3)
Please contact me after purchase to immediately get your PDF strategy + documentation for Trend Pulse !  Official release price of $99  ( 15 / 50 copies left). Next price is $199 . Introducing Trend Pulse , a unique and robust indicator capable of detecting bullish, bearish, and even ranging trends! Trend Pulse uses a special algorithm to filter out market noise with real precision. If the current symbol is moving sideways, Trend Pulse will send you a ranging signal, letting you know that
Получайте ежедневную информацию о рынке с подробностями и скриншотами через наш утренний брифинг здесь, на mql5 , и в Telegram ! FX Power MT4 NG - это новое поколение нашего популярного измерителя силы валют FX Power. Что же предлагает этот измеритель силы нового поколения? Все, что вы любили в оригинальном FX Power ПЛЮС Анализ силы GOLD/XAU Еще более точные результаты расчетов Индивидуально настраиваемые периоды анализа Настраиваемый предел расчета для еще более высокой производительности Спец
ПОЖАЛУЙСТА, ПРОЧТИТЕ ИНФОРМАЦИЮ НИЖЕ ПЕРЕД ПОКУПКОЙ! Apollo Pips PLUS SP – уникальный продукт! ЭТО ДЛЯ ТЕХ, КТО ХОЧЕТ ПОЛУЧИТЬ МОЙ НОВЫЙ ИНДИКАТОР «APOLLO PIPS» + БОНУС «SUPER PACK» С ДОСТУПОМ КО ВСЕМ МОИМ ТОРГОВЫМ ИНДИКАТОРАМ! Покупая продукт Apollo Pips PLUS SP, вы фактически приобретаете абсолютно новую версию моего индикатора Apollo Pips. Эта версия индикатора имеет улучшенный алгоритм и простой в использовании параметр, который дает вам возможность использовать индикатор на любом рынке и в
В НАСТОЯЩЕЕ ВРЕМЯ СКИДКА 26% Лучшее решение для новичка или трейдера-эксперта! Этот индикатор является уникальным, высококачественным и доступным торговым инструментом, поскольку мы включили в него ряд собственных функций и новую формулу. С помощью всего лишь ОДНОГО графика вы можете определить силу валюты для 28 пар Форекс! Представьте, как улучшится ваша торговля, потому что вы сможете точно определить точку запуска нового тренда или возможность скальпирования? Руководство пользователя:
TakePropips Donchian Trend Pro
Eric John Pajarillaga Aldana
4.61 (18)
TakePropips Donchian Trend Pro   (MT4) — это мощный и эффективный инструмент, который автоматически определяет направление тренда с помощью канала Дончиана и предоставляет вам торговые сигналы для входа и выхода! Этот многофункциональный индикатор включает в себя сканер тренда, торговые сигналы, статистическую панель, скринер, торговые сессии и панель истории предупреждений. Он разработан, чтобы предоставить вам торговые сигналы и сэкономить время на анализе графиков! Вы можете скачать руководст
Reversal First Impulse levels (RFI)        INSTRUCTIONS     RUS    -      ENG           Рекомендуем использовать с  индикатором -  TPSpro  TREND PRO -  Version MT5 Важным ключевым элементом в трейдинге являются зоны или уровни, от которых принимаются решения о покупке или продаже торгового инструмента. Несмотря на попытки крупных игроков скрыть свое присутствие на рынке, они неизбежно оставляют следы. Наша задача заключалась в том, чтобы научиться находить эти следы и правильно их интерпретирова
TPSproTREND PrO
Roman Podpora
4.78 (18)
TPSpro TREND PRO   —  трендовый индикатор, который автоматически анализирует рынок и предоставляет информацию о тренде и каждой его смене а также дающий сигналы для входа в сделки без перерисовки! Индикатор использует каждую свечу, анализируя их отдельно. относя к разным импульсам – импульс вверх или вниз. Точные точки входа в сделки  для  валют, крипты, металлов, акций, индексов! Version MT5           ПОЛНОЕ ОПИСАНИЕ ИНДИКАТОРА           Рекомендуем использовать с  индикатором -  RFI LEVELS
В настоящее время скидка 20%! Лучшее решение для новичка или трейдера-эксперта! Эта приборная панель работает на 28 валютных парах. Он основан на 2 наших основных индикаторах (Advanced Currency Strength 28 и Advanced Currency Impulse). Он дает отличный обзор всего рынка Forex. Он показывает значения Advanced Currency Strength, скорость движения валюты и сигналы для 28 пар Forex на всех (9) таймфреймах. Представьте, как улучшится ваша торговля, когда вы сможете наблюдать за всем рынком с пом
Представляем       Индикатор Quantum Trend Sniper   , инновационный индикатор MQL5, который меняет способ определения разворотов тренда и торговли ими! Разработан командой опытных трейдеров со стажем торговли более 13 лет,       Снайперский индикатор Quantum Trend       разработан, чтобы вывести ваше торговое путешествие на новые высоты благодаря инновационному способу определения разворотов тренда с чрезвычайно высокой точностью. ***Купите индикатор Quantum Trend Sniper и получите индикатор
Ultimate Sniper Dashboard
Hispraise Chinedum Abraham
4.85 (27)
Скидка $299! Цены могут вырасти в будущем! Читайте описание ниже! Лучшая система ввода для Ultimate Sniper Dashboard: ПРЕДЕЛЬНЫЕ ДИНАМИЧЕСКИЕ УРОВНИ. (Пожалуйста, проверьте мои продукты) Ultimate Sniper Dashboard работает ТОЛЬКО на реальных рынках из-за ограничений мультивалютного тестирования MT4. Представляем вам Ultimate-Sniper Dashboard! Наша самая лучшая панель, которая содержит HA-Sniper, MA-Sniper и множество специальных режимов. Ultimate Sniper Dashboard - это абсолютный зверь!
BullsEye Signal NoRepaint
Martin Alejandro Bamonte
3 (2)
BullseyeSignal – NoRepaint это сигнал, который, как следует из названия, никогда не перерисовывается ни при каких обстоятельствах. Сигнал подается на той же свече, которую можно увидеть на изображении. Он идеален для высоковолатильных рынков, таких как форекс, криптовалюты, акции, индексы и фьючерсы. Вы увидите только зеленую стрелку для покупки и красную стрелку для продажи, но за ними стоят многие индикаторы, работающие вместе, чтобы обеспечить более упрощенный торговый опыт. Он специально раз
Сейчас 147 долл. США (увеличиваясь до 499 долл. США после нескольких обновлений) - неограниченные учетные записи (ПК или Mac Руководство пользователя + Обучающие видео + Доступ к приватному Discord-каналу + VIP-статус и мобильная версия + Лицензия на 5 ПК с неограниченным количеством аккаунтов и терминалов MT4. Сколько раз вы покупали индикатор торговли с замечательными обратными тестами, доказательствами производительности на живых счетах и зашикарными цифрами и статистикой, но после испол
Способ применения Pair Trading Station Рекомендуется использовать Pair Trading Station на таймфрейме H1 с любой валютной парой. Чтобы получить сигналы на покупку и продажу, следуйте указанным ниже инструкциям по применению Pair Trading Station в терминале MetaTrader. При загрузке Pair Trading Station на график индикатор оценит доступные исторические данные на вашей платформе MetaTrader для каждой валютной пары. В самой начале на графике отобразятся исторические данные, доступные для каждой валют
Step into the realm of Forex trading with confidence and precision using XQ, a cutting-edge Forex indicator designed to elevate your trading game to unprecedented heights. Whether you're a seasoned trader or just stepping into the world of currency exchange,   XQ Forex Indicator   empowers you with the insights and signals needed to make informed trading decisions. The signal conditions are a combination of three indicators, and XQ Forex Indicator only display  medium and long-term trends . The
Introduction to X3 Chart Pattern Scanner X3 Cherart Pattern Scanner is the non-repainting and non-lagging indicator detecting X3 chart patterns including Harmonic pattern, Elliott Wave pattern, X3 patterns, and Japanese Candlestick patterns. Historical patterns match with signal patterns. Hence, you can readily develop the solid trading strategy in your chart. More importantly, this superb pattern scanner can detect the optimal pattern of its kind. In addition, you can switch on and off individu
СЕЙЧАС СКИДКА 31% !!! Лучшее решение для новичка или трейдера-эксперта! Этот индикатор является уникальным, высококачественным и доступным торговым инструментом, поскольку мы включили в него ряд собственных функций и секретную формулу. Всего на ОДНОМ графике он выдает алерты по всем 28 валютным парам. Представьте, как улучшится ваша торговля, ведь вы сможете точно определить точку запуска нового тренда или возможность скальпирования! Построенный на новых базовых алгоритмах, он позволяет е
Cycle Sniper
Elmira Memish
4.44 (39)
NEW YEAR SALE PRICE FOR LIMITED TIME!!! Please contact us after your purchase and we will send you the complimentary indicators to complete the system Cycle Sniper is not a holy grail but when you use it in a system which is explained in the videos, you will feel the difference. If you are not willing to focus on the charts designed with Cycle Sniper and other free tools we provide, we recommend not buying this indicator. We recommend watching the videos about the indiactor and system before pu
Топовый индикатор МТ4, дающий сигналы для входа в сделки без перерисовки! Идеальные точки входа в сделки   для  валют, крипты, металлов, акций, индексов !  Смотрите  видео  (6:22) с примером отработки всего одного сигнала, окупившего индикатор. Версия индикатора для MT5 Преимущества индикатора Сигналы на вход без перерисовки Если сигнал появился, он никуда НЕ исчезает! В отличие от индикаторов с перерисовкой, которые ведут к потере депозита, потому что могут показать сигнал, а потом убрать его.
The AT Forex Indicator MT4 is a sophisticated trading tool designed to provide traders with a comprehensive analysis of multiple currency pairs. This   powerful indicator   simplifies the complex nature of the forex market, making it accessible for both novice and experienced traders. AT Forex Indicator uses   advanced algorithms   to detect trends, patterns and is an essential tool for traders aiming to enhance their forex trading performance. With its robust features, ease of use, and reliabl
Advanced Supply Demand
Bernhard Schweigert
4.9 (314)
Этот индикатор является уникальным, качественным и доступным инструментом для торговли, включающим в себя наши собственные разработки и новую формулу. В обновленной версии появилась возможность отображать зоны двух таймфреймов. Это означает, что вам будут доступны зоны не только на старшем ТФ, а сразу с двух таймфреймов - таймфрейма графика и старшего: отображение вложенных зон. Обновление обязательно понравится всем трейдерам, торгующим по зонам спроса и предложения. Важная информация Для мак
Enigmera
Ivan Stefanov
5 (4)
ЭНИГМЕРА: ядро рынка https://www.enigmera.com Введение Этот индикатор и торговая система представляют собой удивительный подход к финансовым рынкам. ENIGMERA использует фрактальные циклы для точного расчета уровней поддержки и сопротивления. Он показывает подлинную фазу накопления и дает направление и цели.  Система, которая работает независимо от того, находимся ли мы в тренде или в коррекции.  Как она работает? ENIGMERA состоит из трех линий: линии поддержки/сопротивления, линии цели и ли
Представляем       Quantum Breakout PRO   , новаторский индикатор MQL5, который меняет ваш способ торговли в зонах прорыва! Разработанная командой опытных трейдеров с опытом торговли более 13 лет,   Quantum Breakout PRO   предназначена для того, чтобы вывести ваше торговое путешествие на новые высоты благодаря своей инновационной и динамичной стратегии зон прорыва. Quantum Breakout Indicator покажет вам сигнальные стрелки на зонах прорыва с 5 целевыми зонами прибыли и предложением стоп-лос
A top and bottom indicator that can intuitively identify the trend of the band. It is the best choice for manual trading, without redrawing or drifting. How to get this indicator for free: Learn more Price increase of $20 every 3 days, price increase process: 79--> 99 --> 119...... Up to a target price of $1000. For any novice and programming trading friend, you can write the signal into the EA to play freely. Array 3 and array 4, for example, 3>4 turns green, 3<4 turns red. If you don't underst
Gold Channel is a volatility-based indicator, developed with a specific timing algorithm for the XAUUSD pair, which consists of finding possible corrections in the market. This indicator shows two outer lines, an inner line (retracement line) and an arrow sign, where the theory of the channel is to help identify overbought and oversold conditions in the market. The market price will generally fall between the boundaries of the channel. If prices touch or move outside the channel it is a tra
ECM Elite Channel is a volatility-based indicator, developed with a specific time algorithm, which consists of finding possible corrections in the market. This indicator shows two outer lines, an inner line (retracement line) and an arrow sign, where the channel theory is to help identify overbought and oversold conditions in the market. The market price will generally fall between the boundaries of the channel. If prices touch or move outside the channel, it's a trading opportunity. The
Indicator : RealValueIndicator Description : RealValueIndicator is a powerful tool designed specifically for trading on the EURUSD pair. This indicator analyzes all EUR and USD pairs, calculates their real currency strength values, and displays them as a single realistic value to give you a head start on price. This indicator will tell you moves before they happen if you use it right. RealValueIndicator allows you to get a quick and accurate overview of the EURUSD currency pair tops and bottoms,
Индикатор Gann Squares представляет собой мощный инструмент для анализа рынка, основанный на математических концепциях, представленных W.D. Gann в его статье "Математическая формула для прогнозирования рынка." Этот индикатор включает в себя техники Ганна, связанные с квадратными числами, такими как 144, 90 и 52, а также Квадрат 9. Кроме того, он включает метод  по использованию Квадрата 9 в сочетании с каналами и паттерном звезды. Руководство пользователя и использование: Перед использованием эт
Introduction to Chart Pattern MT Chart Pattern MT is a chart pattern scanner to detect the triangle pattern, falling wedge pattern, rising wedge pattern, channel pattern and so on. Chart Pattern MT uses highly sophisticated chart pattern detection algorithm. However, we have designed it in the easy to use with intuitive user interface. Chart Pattern MT will show all the patterns in your chart in the most efficient format for your trading. You do not have to do tedious manual pattern detection an
FX Volume
Daniel Stein
4.61 (36)
Получайте ежедневную информацию о рынке с подробностями и скриншотами в нашем утреннем брифинге здесь, на mql5 , и в Telegram ! FX Volume - это ПЕРВЫЙ и ЕДИНСТВЕННЫЙ индикатор объема, который дает РЕАЛЬНОЕ представление о настроении рынка с точки зрения брокера. Он дает потрясающее представление о том, как институциональные участники рынка, такие как брокеры, позиционируют себя на рынке Forex, гораздо быстрее, чем отчеты COT. Видеть эту информацию прямо на своем графике - это настоящий геймчей
Royal Scalping Indicator M4
Vahidreza Heidar Gholami
4.29 (7)
Royal Scalping Indicator is an advanced price adaptive indicator designed to generate high-quality trading signals. Built-in multi-timeframe and multi-currency capabilities make it even more powerful to have configurations based on different symbols and timeframes. This indicator is perfect for scalp trades as well as swing trades. Royal Scalping is not just an indicator, but a trading strategy itself. Features Price Adaptive Trend Detector Algorithm Multi-Timeframe and Multi-Currency Trend Low
Другие продукты этого автора
It identifies the pivot, support, and resistance price levels of the selected timeframe and then draws lines onto the chart. FEATURES: Option to specify the Timeframe Period in the PivotSR calculation. Option to display the PivotSR of the last candle, of every candle, or of the current candle. Options for displaying labels, line thickness, and line color. PivotSR can be interpreted as reversal levels or past price reactions that can be used as the basis for current price analysis. Some traders b
FREE
It works based on the Stochastic Indicator algorithm. Very useful for trading with high-low or OverSold/Overbought swing strategies. StochSignal will show a buy arrow if the two lines have crossed in the OverSold area and sell arrows if the two lines have crossed in the Overbought area. You can put the Stochastic Indicator on the chart with the same parameters as this StochSignal Indicator to understand more clearly how it works. This indicator is equipped with the following parameters: Inputs d
FREE
Индикатор основан на множестве EMA. Идея состоит в легком отображении нескольких экспоненциальных скользящих средних на одном гнрафике, без необходимости добавлять их по отдельности. В индикатор также встроена линия тренда: она синяя при растущем тренде и красная при падающем тренде. Цвета линий можно поменять в настройках индикатора. В индикаторе 2 внешних параметра. Это параметры периода и сдвига. При их изменении (период и/или сдвиг), остальные параметры подстраиваются автоматически. Подходит
It is a custom non-repaint indicator to identify trade opportunities in swing action as prices move within an upper and lower band. Inspired by the Keltner Channel, the most popular channel Indicator introduced by Chester Keltner. It is different with a Bollinger Bands. It represents volatility using the high and low prices, while Bollinger's studies rely on the standard deviation. The algorithm for this indicator is also available in the EntryMaximator EA. Including the option to use it or not.
FREE
Scanning   Multi Symbols Scalping Signals based on 3 kinds of Market Analysis methods. Trend, Signal, and Reversator. And each method consists of its own multi timeframes algorithm functions. Summarized to become clear signals direction BUY/SELL, including the signals strength scoring and sending message to all available alert tools. Displayed on a User Friendly and customizable Dashboard. Size, colors, coordinates, highlight, hidden/show and more. Base Timeframe: M15. And M5 to Daily to confirm
Provides instant signals on the chart in panel form. Equipped with signal description and trading analysis tools such as drawing auto trendlines, support/resistance area, regression channel, Fibonacci levels, Pivot levels and current signal price, signal time, signal expiry and stoploss recommendation. Also sending alert messages to all available mt4 alert tool. A detailed description panel provides information about where the signal comes from and what indicators are behind the signal. Includin
SignalPinner is a trend line Indicator which can detect market trends early by including three types of signal arrows. Non repaint and trend following. Signals on the strong trend, signals in the beginning of trend and signals with multiple market analysis algorithm as the main signals. Supported by alert notification message to keep you getting signals while on the go. Symbols: Any Timeframes: Any Features Histogram buffers as a sign the trend is started. It can help the trader knowing the ma
Oversold and Overbought Candles, Trendlines, and BUY-SELL arrows in the single Indicator. Built from 8 default MT4 Indicators. Stochastic,RSI,SAR,CCI,RVI,DeMarker,WPR and MA. It is " NON REPAINT " indicator. All buffers do not repaint.  Double Trendline buffers that can also be used to identify sideway market and support resistance area.  Any timeframes and any currency pairs. Parameters: Show Trend . TRUE/FALSE to show trendlines on the chart Follow Trend. If TRUE , Dapitrend will show on
MACD Scanner provides the multi symbols and multi-timeframes of MACD signals. It is useful for trader to find the trading idea quickly and easily. User-friendly, visually clean, colorful, and readable. Dynamic dashboard display that can be adjusted thru the external input settings. Total Timeframes and Total symbols as well as the desired total rows/panel, so it can maximize the efficiency of using the chart space. The Highlight Stars on the certain matrix boxes line based on the selected Scan M
This is the countdown of the last candle Indicator. How much time remains in the current candle of your chart CTime display exactly how many hours, minutes and seconds remain before the current candle closes, and a new one opens. This allows you to be on the ball as soon as the next candle appears It could be useful for a trader who trades with candles as the main attention Available option to change the text color to suit the chart background. This Indicator is related to the system here .
FREE
Индикатор Range Multi Alligators отображает информацию о максимуме и минимуме канала диапазона, а также о тренде, который рисуется в центре канала в виде гистограммы красного и синего цвета. Линии канала диапазона позволяют определять уровни стоп-лосс и тейк-профит. Это трендовый индикатор на основе использования нескольких "Аллигаторов". Запустите индикатор на графике и настройте один или все параметры, при этом все линии будут перемещаться синхронно. Описание настраиваемых параметров Period
Индикатор стохастических свечей Он преобразует стохастический индикатор из отдельного окна в окно графика, рисуя раскрашенные перекупленные свечи. Красный перекуплен, а синий перепродан по умолчанию. Позже вы можете изменить цвет в настройке внешнего индикатора. Это индикатор мульти таймфрейма, который означает, что он может показывать результат появления с другого таймфрейма. Например: если вы установите таймфрейм H1, он будет отображаться свечи с таймфрейма H1 на любой таймфрейм Это будет
Autobot Retracement Code (ARC) A robot trading that works based on retracement strategy while following the market trend.It has  made average profits up to 25% /month that is relatively a High Return of Investment.Real Account proof. Fully automation. Auto Lot sizing, Auto TakeProfit Calculation, Auto StopLoss Calculation. Currently Running on Real account , it has more than 100% growth / 5 months. NEW UPDATE RELEASED, VERSION 3.0  FEATURES on Version 3: FIFO rules Auto LotSize Auto StopLoss
Order Management EA (OME). The software will manage your trades based on 2 options: Magic Number or Order Comment. Both the Trades from the other EA or from Manual Trading. Drawing Stop Loss/Take Profit, Close All the positions, manages Multiple Orders, determining grid range and entry signals automatically.  Sending Martingale Orders, if necessary, that can be turn off/on. Including 2 options lot calculation: Multiplication or Addition.  You install OME in your account, you place order, and it
Strategy – Bollinger Band, Moving Average and Price Actions. Bollinger Bands to identify High-Low Price, Moving Average to identify Trend and Price Action is to synchronize both of them.  SardaFx 4.1 has average holding time 24 hours (1 day) on timeframe H1. It is not a Martingale EA or Averaging EA. The work is simple, BUY and Exit or SELL and Exit. No recurring BUY and or SELL in the same time and the same symbol except you adjust Max BUY/SELL  more than 1,default setting is 1 BUY and 1 SELL.
Some informations on the chart with the single attachment. RangeBorder Buy Sell (RBBS) Non Repaint Indicator will provide trend line, buy sell arrows,reversal arrows, range channel, order exit area,high average price line and low average price line.All arrows and lines don't repaint and not lagging. Once candle closed it won't  repaint. Reading Indicator: 1. Small Stars , Indicates oversold and overbought with certain logic and price may reverse when this small star triggers. Useful to identif
TrendWavePattern  an another way to trade with a harmonic pattern, a maestro classic pattern . I made some improvements and combinations with my own strategy. Trend direction, buy-sell signal ,hi-low area and pivot line. These will be helpful for trader to read the current market condition. So it is not blindly following the pattern itself but also following other informations from the market. Readable chart appearance . Designed to be user friendly even you are a new trader. BUY-SELL zone, Ta
This is MT4 version of StochScanner It scans Stochastic from Multi Symbols and Multi Timeframes and displayed on the dashboard on a single chart. . 4 scanning modes: 1. Mode OverBought/OverSold Indicator scans Overbought and OverSold . OverBought : current stochastic is above level 80 and OverSold : current stochastic is below level 20 2. Mode Signal It means if the previous stochastic is on OverBought or OverSold ( either Main Line and Signal Line ) and the current Main Line cross over the curr
It is an expert advisor that scans the last patterns on defined symbols and timeframes . Multi Symbols /pairs , Multi timeframes .  There are 2 ways to specify symbols : Automatically scan all symbols available on the market watch (true/false) Type any symbols ,separated by comma.   There are also 2 ways to specify timeframes : Automatically scan all timeframes available on mt4 (true/false) Type any timeframes,separated by comma.   Unlimited symbols available in an account and unlimited timefr
GOLDEN RETRACEMENT POWER indicator draws fibonacci levels automatically. Defines the golden entry buy/sell area, support and resistant lines , signals arrows and strength 'Power Bars Level' based on price action . Some indicators also work behind the chart: Stochastic,RSI,MFI,DeMarker and WPR . Fibonacci retracements are a popular form of technical analysis used by traders in order to predict future potential prices in the financial markets. If used correctly, Fibonacci retracements and ratios c
Lemurian Trader is a multi symbols  EA/robot. User can input symbols in the external parameter separated by comma. Only need to place on the single chart, no need to open multiple chart,no limited symbols as long the symbol is available on the market watch. Sweeping signals from timeframe M15 to H4 on each symbol to find the best high/low price while it also keeps to follow the trend. Lower TF M15 as a signal and higher(M30,H1,H4) to indentify trend and high low. It means whatever timeframe we p
RSI Scanner Plus Indicator scans RSI values in multiple symbols and timeframes. Plus trend line buffer on the chart.  Features: -Trend Line :  We add trend line on the chart in the hope it help you to see current trend on the chart while following oversold and overbought  from RSI. This is additional feature in the indicator. We consider that following the trend is very important in trading. -Changeable Panel Display :  Change the value of Max.Symbols/Panel and  the indicator will adjust the d
TrendScanner XTra scans market trends from Multi Symbols and Multi Timeframes with extra additional Entry Point Signals arrow on the current chart. Features: -Entry Point SIgnals :  This is additional feature in the indicator. No repaint arrows. The Trading system in the single indicator. MTF Trend informations and Entry Signals. In order to make it easier for trader to get trading moments from a single chart and  deciding entry time.  -Changeable Panel Display :  Change the value of Max.Symbo
PullbackMatrix provides the key information of the trading transactions when it finds the right market moment based on its built-in logic algorithm. The high accuracy signals including Trading Symbol, Entry Price, Entry Time, TakeProfit, Stoploss, and more. And that's all will be available instantly in your chart panel, drawing the position lines and also sending signal notification to email, mobile phone, and screen popup. More important is that also saves signals into a .csv file which is usef
Non-repaint indicator    to identify trade opportunities in swing action as prices move within an upper and lower band. Inspired by the Keltner Channel, the most popular channel Indicator introduced by Chester Keltner. It is different with a Bollinger Bands. It represents volatility using the high and low prices, while Bollinger's studies rely on the standard deviation. Customized by adding the trends exactly in the middle line, arrows when price cross over the outer lines and Fibonacci Levels L
Provides Regression Channel on the current chart. Combined by Trend of Moving Averages and Multi timeframes Oscillator Indicators: CCI, RSI, Stochastic, and MACD with specific working logic . It could make us easier to identify swing high-low as an entry point, the retracement area while following the current trend. Consists of 2 types of signal, main and secondary. The main signal will draw very clearly triangle and lines on the chart with the word " BUY" or 'SELL'. and the secondary is the sta
It could help to calculate Risk-Reward easily before placing a BUY-SELL position. TradeSizeCalculator is a Multi-Tasking Calculator. It will calculate the others when we define the value in one of the columns. Stoploss, risk percentage, risk-money, lot size, take-profit , reward-money, and reward-ratio. Depending on which value is changed. All values in the columns are editable. Also, we can get those calculation results by drag-drop the stop-loss/take-profit line. Parameter: The inputs below ar
It has 3 capabilities at once and can be adjusted according to needs. Full Auto, Semi-Auto, or Warning Signals only. You can choose it by setting the parameters provided. Built to help Traders work much easier than doing it manually. Sharpen the accuracy of market analysis performed by a Trader by only executing in certain price areas and adjustable signal parameters. Features Ability to manage trading management, including automatically determining stop loss/take profit, calculating lot size ba
GU Spot is a One Shot One Kill EA. A  Scalping EA   for GBPUSD .   No Martingale, No Averaging, No Grid or other high-risk strategies.  Working with up to the best 100 trading signals algorithm from various Trading Systems. The combination of Price Action, High Low, Trend, Range Levels, Pullback /  Retracement and Reversal. This is Fully Automatic Trading Robot . High Accuracy Entry Signals and protected by a proper Money Management. A tight Stop Loss with SL:TP ratio 1:3 by default, Trailing an
All in one Indicator. Multiple market analysis tools. Non-Repaint Oscillator signals, Trend lines, Price channel, Fibonacci levels, Support and Resistance, Regression, Pivot levels, Candle Strength and Oversold/Overbought line detector. Includes buttons to hide or show. Advanced algorithms to detect important reversal points and draw trend lines or shapes automatically in appropriate areas. A simple and professional chart display, user friendly and easier to understand for faster and accurately
Фильтр:
Нет отзывов
Ответ на отзыв