• Обзор
  • Отзывы (1)
  • Обсуждение (15)
  • Что нового

RSI Divergence Scanner MT4

5

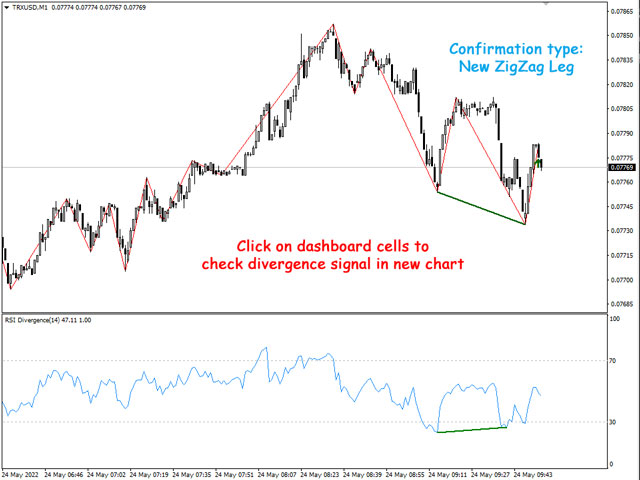
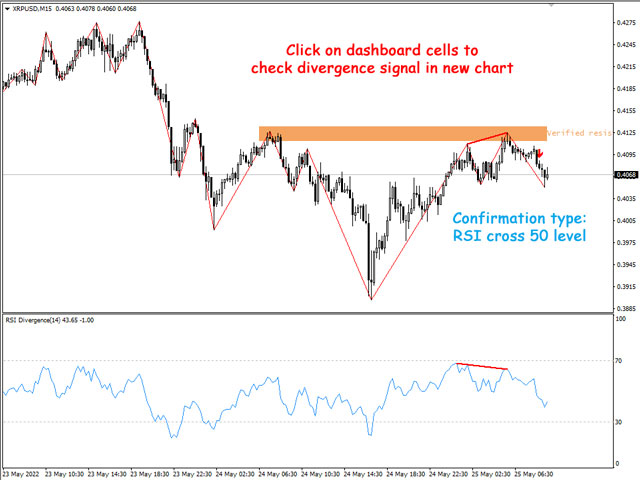
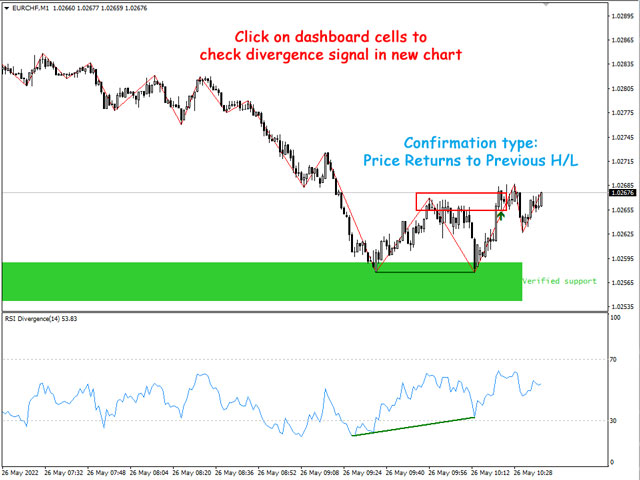
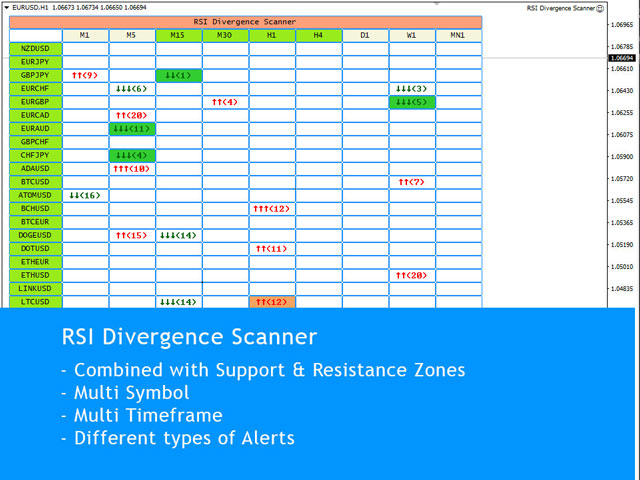
RSI Divergence Scanner is a multi-timeframe and multi-symbol dashboard and alert that checks all timeframes and symbols to find divergences between price chart and RSI indicator.

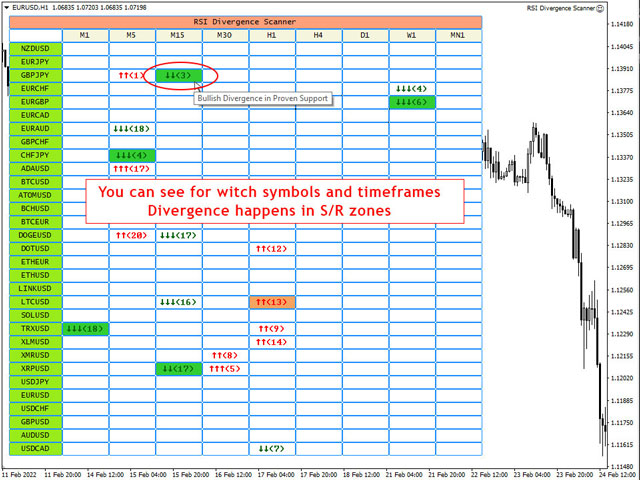
This divergence scanner is integrated with support and resistance zones so you can check the RSI divergences in the most important areas of the chart to find trend reversals in the price chart.

Download demo version (works on M 1,M5,M30,W1 timeframes)

Full description of scanner parameters -> click here.

How to get the most from the scanner -> read this article.

Using RSI divergences alongside other technical tools like price action, candlestick patterns and support resistance zones gives reliable signals for possible trend reversals.

If you are using RSI Divergence in your trading strategy, this scanner helps you find the best opportunities to trade without spending much time in front of your system.

RSI Divergence Scanner Features:

  • Scanner finds both regular (classic) and hidden divergences
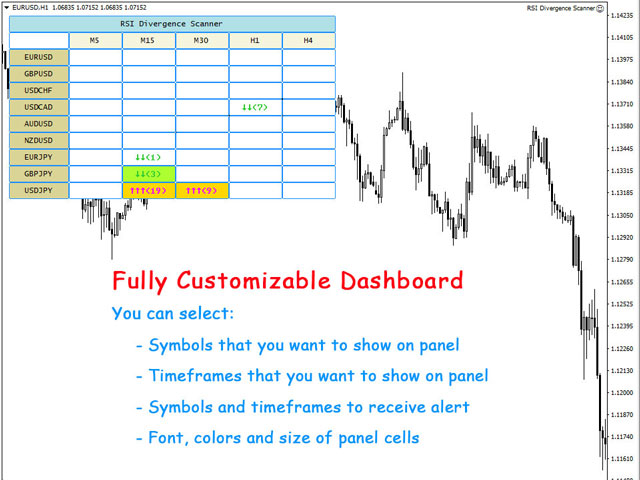
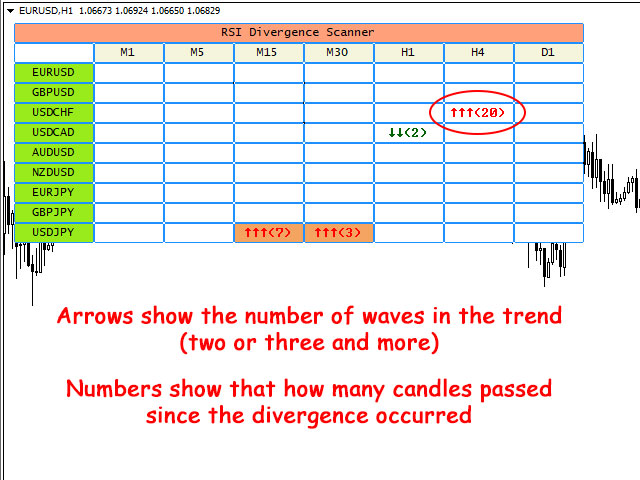
  • Run the dashboard on one chart and see the RSI Divergence for all selected symbols and timeframes.
  • You can set the scanner to only search for divergences that occur in overbought/oversold levels (you can set levels in parameters).
  • The panel shows that how many candles passed since the divergence occurred.
  • The panel shows the number of trend waves (2 or 3 and more) that leads to the divergence. 
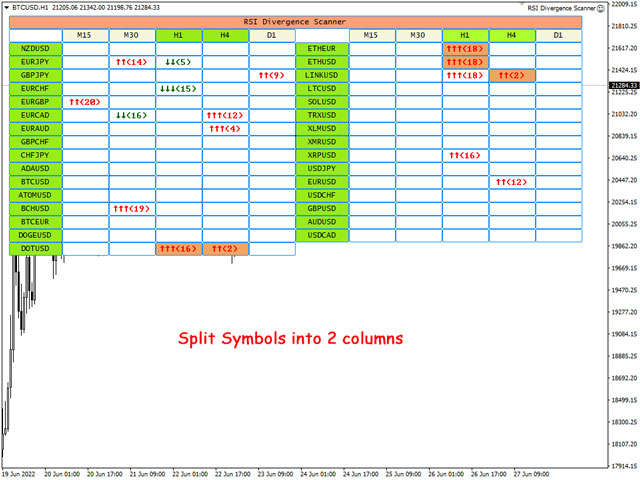
  • You can split the symbols into 2 or 3 columns to show more symbols on the chart
  • When you click on table cells, you can see the S/R zone, divergence line and divergence arrow on the opened price chart.
  • You can separate symbols into multiple dashboards with different parameters for each dashboard (for example for different markets).
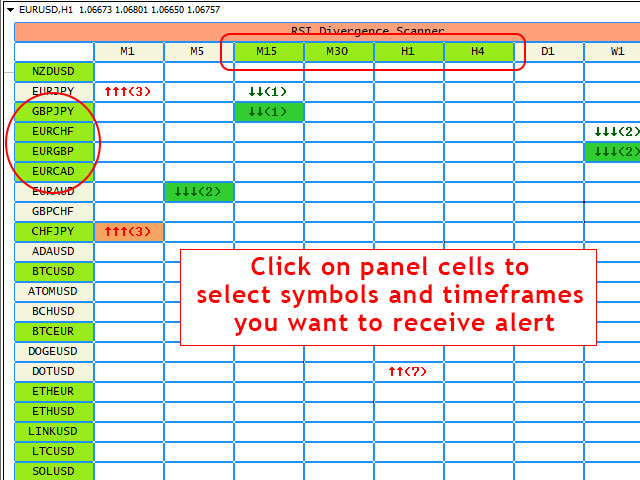
  • You can enable/disable alerts for symbols and timeframes directly from the scanner dashboard.
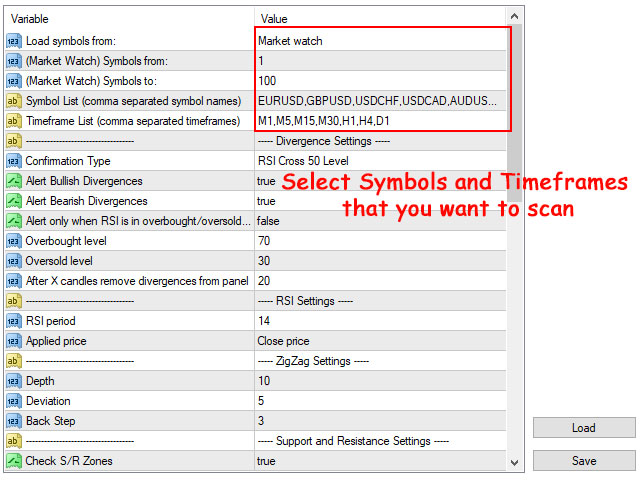
  • Scanner works in all markets (Forex, Stocks, Indices, Commodities, Crypto ...), you can write the symbol names in the settings (comma separated) or simply set the scanner to read the symbols from market watch.

Different confirmations for divergences

There are 6 confirmation option for RSI divergences that you can select in input parameters:

  • Candlestick Patterns
  • RSI line cross 50 level
  • Price returns to previous H/L
  • Changing the color of Heiken Ashi indicator
  • Strong Reversing Candle (may not happen)
  • Immediate alert without confirmation

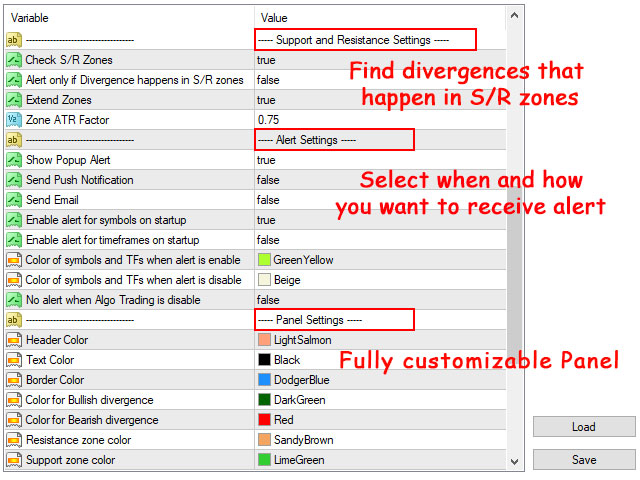
Integrated with support and resistance zones

  • You can set the scanner to only receive alerts for RSI divergences that are inside the support and resistance zones.
  • You can see witch RSI divergences happen in support resistance zones through cell colors.
  • You can set the parameters for support and resistance zones in scanner input parameters.
  • Support and resistance zones are calculated based on shved supply and demand indicator that you can download for free from this link (scanner doesn't need it).

Different Alert Types:

You can enable the following alerts at the same time in the scanner settings.

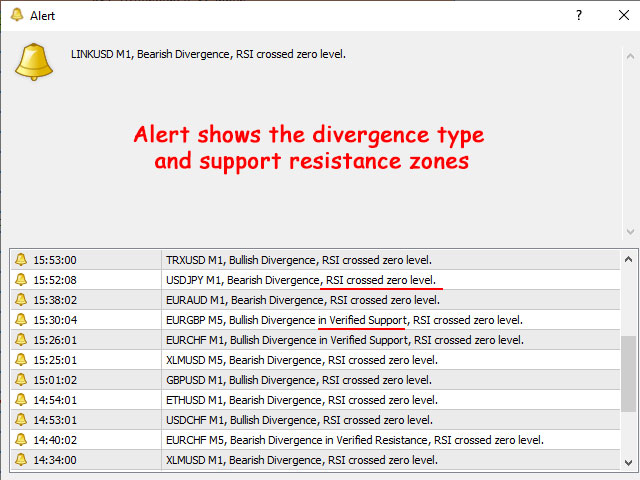
  • Show Pop Up Alert: Show alert window when scanner alert triggers.
  • Send Push Notification: Send push notification to mobile phone when scanner alert triggers. (You should set metatrader Notifications options)
  • Send Email: Send email when scanner alert triggers. (You should set metatrader Email options)

Notes:

  • RSI Divergence Scanner uses ZigZag indicator to determine trend direction and HH/LL of the price, you can change the ZigZag parameters in the indicator's input window.
  • You can add the free RSI Divergence Indicator to your default chart template, so when you click on the dashboard cells, you can see the divergence on the opened chart (dashboard doesn't need the indicator to run).
  • Dashboard works smoothly for 70 symbols and all 9 timeframes on an average PC, you can add more symbols when you reduce the number of timeframes.
  • If there are many symbols in the market watch, in the first run of the scanner on the chart it may take some time to load the history data for all timeframes of all symbols.
  • If you don't want to find RSI divergences on W1 and MN1 timeframes, don't load them on the dashboard. Charts must have at least 300 candles for checking the trend and finding the divergences.
  • Dashboard updates every 1-minute candle open time, run it on more volatile symbols like EURUSD and BTCUSD to receive new price ticks faster.

Отзывы 1
Behzad Mohebali
81
Behzad Mohebali 2022.11.27 06:35 
 

An excellent and efficient tool Along with a professional and committed developer.

Hoping to add more features to this tool.

good luck

Рекомендуем также
Индикатор определяет и отображает на графике гармоничный паттерн Акула согласно схеме, приведенной на скриншоте. Выделение паттерна производится по вершинам индикатора ZigZag (включен в ресурсы, не требует дополнительной установки). В момент распознавания паттерна выводится сообщение во всплывающем окне, отправляются оповещения на мобильное устройство и электронный почтовый ящик. Индикатор выделяет не только завершенную фигуру, но и момент ее формирования. На этапе формирования фигура отображает
**  All Symbols  x  All Timeframes  scan just by pressing scanner button ** *** Contact me  to send you instruction and add you in "Wolfe Wave Scanner group" for sharing or seeing experiences with other users. Introduction: A Wolfe Wave is created with five-wave patterns in price. It shows supply and demand and a fight towards a balance price. T hese waves of price actions can help traders identify the boundaries of   the trend . Also  It helps forecast how the price will move in the near future
Индикатор отображает на графике сигналы согласно стратегии Билла Вильямса. Демо версия индикатора имеет такие же функции, как и платная, за исключением того, что может работать только на демо-счете. Сигнал "Первый мудрец" формируется, когда появляется разворотный бар с ангуляцией. Бычий разворотный бар - у которого более низкий минимум и цена закрытия в верхней его половине. Медвежий разворотный бар - более высокий максимум и цена закрытия в нижней его половине. Ангуляция образуется, когда все
FREE
Introducing the Consecutive Green/Red Candle Alert Indicator for MT4 - Your Trend Spotting Companion! Are you ready to take your trading to the next level? We present the Consecutive Green/Red Candle Alert Indicator, a powerful tool designed to help you spot trends and potential reversals with ease. Whether you're a new trader looking for clarity in the market or an experienced pro seeking additional confirmation, this indicator is your trusted companion. Key Features of the Consecutive Green/Re
FREE
Chart Patterns Detect 15 patterns (Ascending Triangle, Descending Triangle, Rising Wedge, Falling Wedge, Bullish Flag, Bearish Flag, Bullish Rectangle, Bearish Rectangle Symmetrical triangle, Head and Shoulders, Inverted Head and Shoulders, Triple top, Triple Bottom, Double Top, Double Bottom) Use historical data to calculate the probability of each pattern to succeed (possibility to filter notification according to the chance of success) gives graphic indication about the invalidation level and
This product is a part of  ON Trade Waves Patterns Harmonic Elliot Wolfe you can test free version on EURJPY from this link  Wolf Waves Indicator Откройте для себя Wolf Waves - ваш идеальный инструмент для торговли! Вы ищете мощный инструмент для легкой идентификации Wolf Waves на любом временном интервале? Дальше смотреть не надо! Наш индикатор Wolf Waves делает это легко. Вот почему он идеально подходит именно вам: Основные характеристики: Автоматическое обнаружение: Наш индикатор Wolf Wav
Это объединение нескольких осцилляторов в единую систему дивергенции, что создает впечатление более надежного индикатора дивергенции. Он основан на нескольких валютах и ​​лучше всего работает на таймфрейме 15 минут и выше. Каждый раз, когда генерируется сигнал, он показывает предупреждение пользователю. Он более идеален в сочетании с другими индикаторами ценового действия или торговыми системами.
MACDivergence MTF
Pavel Zamoshnikov
4.29 (7)
Развитие идей, заложенных в популярный индикатор MACD: Находит и наглядно отображает классические и обратные дивергенции (три способа обнаружения дивергенций). Выделяет на индикаторе разными цветами тренд вверх, вниз. Два метода определения тренда: а) MACD пересекает уровень 0 (классический сигнал); б) MACD пересекает свою среднюю (ранний сигнал). Индикатор мультитаймфреймовый - может показывать данные MACD других таймфреймов. Два способа отрисовки индикатора: классическая гистограмма и линия. З
Основан на Волнах индикатора MACD со стандартными параметрами Наносит Уровни Фибоначчи по двум последним Волнам MACD, по положительной и отрицательной соответственно, если в текущий момент по индикатору MACD закончилась отрицательная Волна - то цвет зеленый, если в текущий момент по индикатору MACD закончилась положительная Волна - то цвет красный. Критерий окончания Волны- два тика с другим знаком по MACD. Наносит Трендовые линии по четырем последним Волнам MACD. Хорошо работает с экспертом  Fi
Ловец трендов: Стратегия Ловец трендов с индикатором оповещения - это универсальный инструмент технического анализа, который помогает трейдерам определять рыночные тренды и потенциальные точки входа и выхода. Он представляет собой динамичную стратегию Ловец трендов, адаптирующуюся к рыночным условиям для четкого визуального представления направления тренда. Трейдеры могут настраивать параметры в соответствии со своими предпочтениями и уровнем риска. Индикатор помогает в идентификации тренда,
FREE
*This is TradingView indicator converted to mql4* The SuperTrend V indicator is a popular technical analysis tool used to identify trends and potential trend reversals in financial markets. It is based on the concept of the SuperTrend indicator but incorporates additional features and variations. The SuperTrend V indicator uses a combination of price action and volatility to determine the trend direction and generate trading signals. Here are the key components and features of the indicator:
Данный индикатор является бесспорным лидером среди индикаторов. И для этого утверждения есть веская причина. Индикатор строит очень качественный канал в котором формирует сигналы на вход! Что является идеальной стратегией для трейдера, поскольку трейдер всегда колеблется при выборе стратегии для работы. То есть данный индикатор позволит вам решить дилемму выбора работы по тренду или в канал, поскольку совмещает эти две основные концепции. Работа с индикатором очень проста - вы просто реагируете
Индикатор показывает сигналы на покупку и продажу в соответствии с определением торговой зоны, данным Биллом Вильямсом. Прост в использовании и интерпретации Избегает флета Детерминистский индикатор с четкими правилами Не перерисовывается Доступны все типы алертов Согласно Биллу Вильямсу, торговля в пределах зоны позволяет максимизировать/удвоить/утроить прибыль при движении рынка в нужную сторону, а именно, когда импульс, ускорение и цена подтверждают сильный тренд или период ускорения. Распола
MACD Divergence MT4
KEENBASE SOFTWARE SOLUTIONS
KT MACD Divergence shows the regular and hidden divergences build between the price and oscillator. If your trading strategy anticipates the trend reversal, you can include the MACD regular divergence to speculate the potential turning points. And if your trading strategy based on the trend continuation, MACD hidden divergence would be a good fit. Limitations of KT MACD Divergence Using the macd divergence as a standalone entry signal can be a risky affair. Every divergence can't be interpr
Индикатор торговой платформы MetaTrader 4, RSI TrendLine Divergency Message - три в одном, в отличие от стандартного имеет систему оповещений об изменении рыночной ситуации, состоящую из сигналов: Пересечение Главной линией уровней крайних зон и уровня 50%; Пересечение Главной линией Трендовой линии в окне индикатора; Дивергенция на последнем баре. Параметры экстремальных, среднего уровней и зон дивергенции - настраиваемые. Параметры Language – выбрать русский/английский язык; Options – настро
Индикатор показывает сигналы, основанные на терминальном осцилляторе RSI на графике. Есть возможность отфильтровывать повторяющиеся (залипшие) сигналы. Здесь RSI используется для поиска сигналов на разворот. Рекомендуется в качестве точки входа по свинг-стратегии и торговли от уровней. Доступен мультивалютный дэшборд. С его помощью вы можете легко переключаться между графиками. В обсуждениях продукта вы можете предложить алгоритм, в который хотите встроить дэшборд. Входные параметры.
FREE
Free automatic fibonacci - это индикатор, который автоматически строит коррекции Фибоначчи, основываясь на количестве баров, выбранных в параметре BarsToScan. Линии Фибоначчи автоматически обновляются в реальном времени при появлении новых максимальных и минимальных значений среди выбранных баров. В настройках индикатора можно выбрать уровни, значения которых будут отображены. Также можно выбрать цвет уровней, что позволяет трейдеру прикреплять индикатор несколько раз с разными настройками и цве
FREE
Робот скальпер для таймфрейма M5. Торгует на валютной паре GBPUSD. Этот робот был специально разработан компанией профессиональных трейдеров для торговли на фунте стерлинге. Робот примерно открывает от 5 до 15 торговых сделок каждый день. Лучше всего торгует с брокерами у которых низкий спред по GBPUSD до 10 пунктов. Рекомендуемы минимальный депозит для старта от 500$ и больше. Преимущества: не использует мартингейл. не сеточник. каждая сделка имеет стоплосс. профессиональный бот специально для
Это инновационный индикатор измерения силы валют от INFINITY является незаменимым помощником для скальперов и трейдеров торгующих в долгую. Система анализа Силы/слабости валют давно известна и применяется на рынке ведущими трейдерами мира. Любая арбитражная торговля не обходится без этого анализа. Наш индикатор легко определяет силу базовых валют по отношению друг к другу. Он выводит линейные графики по всем или по текущей паре валют, позволяя проводить мгновенный анализ и поиск наиболее сил
FREE
Чарльз Генри Доу полагал, что если средние промышленный и транспортные индексы будут двигаться в одном направлении, произойдет значительный экономический сдвиг. Вкратце, данный индикатор основан на теории Доу. Он создает индекс практически любого рыночного символа. Например: индексы евро, британского фунта, японской иены, швейцарского франка, золота, новозеландского доллара, австралийского доллара, канадского доллара. Господин Доу не считал, что только его идеи должны использоваться для прогнози
Indicator without redrawing Divergent MAX The DivirgentMAX indicator is a modification based on the MACD. The tool detects divergence based on OsMA and sends signals to buy or sell (buy|sell), taking into account the type of discrepancies detected. Important!!!! In the DivirgentMAX indicator, the optimal entry points are drawn using arrows in the indicator's basement. Divergence is also displayed graphically. In this modification of the MACD, the lag problem characteristic of its predecessor i
Forex Indicator "MACD with Trend ZigZag" for MT4 MACD   indicator itself is one of the most popular tool for trend trading "MACD with Trend ZigZag" is excellent for using   with Price Action entries or in combination with other indicators Use this indicator to select most accurate entry signals: - If MACD is above 0 (green color) and ZigZag line is upward - search only for Buy Price Action patterns -  If MACD is below 0 (pink color) and ZigZag line is downward - search only for Sell Price Action
Данный сканер показывает значения тренда известного индикатора SuperTrend для множества инструментов (до 30) и 8 таймфреймов. Уведомляет о смене направления тренда в терминале MetaTrader 4, по email и push-уведомлением. Это бесплатная версия индикатора SuperTrend Scanner Бесплатная версия работает только на EURUSD и GBPUSD! Важная информация Для максимального использования потенциала сканера прочитайте полное описание (на английском языке): www.mql5.com/en/blogs/post/718074 Бесплатная версия
FREE
Прежде всего стоит подчеркнуть, что этот торговый индикатор не перерисовывается, не перерисовывает и не отставает, что делает его идеальным как для ручной, так и для роботизированной торговли. Руководство пользователя: настройки, вводы и стратегия. Атомный аналитик - это индикатор ценового действия PA, который использует силу и импульс цены, чтобы найти лучший край на рынке. Оборудованный расширенными фильтрами, которые помогают убирать шумы и ложные сигналы, и повышают торговый потенциал. Испо
Divergence is one of the vital signals that depicts the upcoming price reversal in the market. KT Stoch Divergence shows the regular and hidden divergences build between the price and stochastic oscillator. Limitations of KT Stoch Divergence Using the Stochastic divergence as a standalone entry signal can be risky. Every divergence can't be interpreted as a strong reversal signal. For better results, try to combine it with price action and trend direction. Features Marks regular and hidde
Shark Surfer - индикатор нового поколения, который использует хорошо зарекомендовавшую себя торговлю по тренду. Подходит как для скальпинга, так и для средне- и долгосрочной торговли. Shark Surfer проанализирует выбранную вами валютную пару и нарисует место рекомендуемого входа в сделку, тейк-профит и стоп-лосс. Shark Surfer подходит для торговли по всем валютным парам и на всех таймфреймах. Имеет email и push-уведомления о появившихся торговых сигналах. Торговой стратегией индикатора является п
Индикатор сочетает разворотные паттерны "Двойное дно" и "Двойная вершина" с индикатором определения расхождения между графиком цены и осциллятором Momentum. Особенности С легкостью определяет сильные сигналы разворота Позволяет использовать паттерны "Двойное дно" и "Двойная вершина" и сигналы расхождения Momentum вместе или по отдельности Получайте уведомления по электронной почте и/или на мобильное устройство при обнаружении сигнала Можно использовать пользовательские цвета Индикатор не перер
Supreme TrendHisto — это трендовый индикатор, который подает сигналы нисходящего и восходящего тренда. Индикатор действует как гистограмма, индикатор не перерисовывается/обратно не рисуется/задерживается. Стратегия Сделка на покупку: пересечение гистограммы выше 0,65, мы открываем сделку на покупку, а для выхода вы можете либо выйти, когда гистограмма достигнет уровня 0,70, либо выйти при достижении уровня 0,70. Сделка на продажу: пересечение гистограммы ниже -0,65, мы открываем сделку на
FX Flow   indicator can be used as an anticipator of the next trend, preferably confirmed by Price Action or another oscillator (RSi, Stochastic ..). It takes the money flows of the major currencies USD EUR GBP AUD NZD CAD CHF JPY into account, and processes them. Excellent tool for indices, but also for correlations between currencies. Works on each timeframes.  Blue line: Bull market Yellow line: Bear market Note : if the indicator opens the window, but does not draw lines, load the histo
С этим продуктом покупают
Trade Assistant MT4
Evgeniy Kravchenko
4.43 (180)
Помогает рассчитать риск на сделку, простая установка нового ордера с помощью линий, управление ордерами с функциями частичного закрытия, 7 типов трейлинг-стопа и другие полезные функции. Внимание приложение не работает в тестере стратегий.  Инструкция, Описание, Скачать демо Функция Линии   - отображает на графике линию открытия, стоп-лосс, тейк-профит. С помощью этой функции легко установить новый ордер и увидеть его дополнительные характеристики перед открытием. Управление риском   -  
Добро пожаловать в Trade Manager EA — лучший инструмент для управления рисками, предназначенный для упрощения, точности и эффективности торговли. Это не просто инструмент для размещения ордеров; это комплексное решение для удобного планирования торгов, управления позициями и усиленного контроля над рисками. Независимо от того, начинающий вы трейдер, опытный специалист или скальпер, нуждающийся в быстром исполнении, Trade Manager EA адаптируется к вашим потребностям и работает с любыми активами:
Custom Alerts - это универсальный инструмент для мониторинга нескольких рынков, который выявляет перспективные сетапы по всем восьми основным валютам (USD, CAD, GBP, EUR, CHF, JPY, AUD и NZD), а также GOLD (XAU), всем 28 парам Forex и GOLD на основе этих валют, и до семи индексов, таких как US30, UK100, WTI, Bitcoin и т.д. Он полностью настраивается. Инструмент собирает данные с наших индикаторов FX Power, FX Volume и IX Power и уведомляет вас о важных событиях.   Перед началом работы вам нео
Exp COPYLOT CLIENT for MT4
Vladislav Andruschenko
4.69 (62)
Копировщик позиций/сделок/ордеров для MetaTrader 4 ( Для копирования на терминал MetaTrader 4 ). Копирует сделки, позиции, ордера с любых счетов, в том числе и счетов, открытых по инвест паролю. Один из лучших копировщиков сделок COPYLOT  МТ4 - МТ4, МТ5 - МТ4 для версии  COPYLOT MT4  ( или  МТ4 - МТ5  МТ5 - МТ5 для версии COPYLOT MT5)  на сегодняшний день. Версия МТ5 Полное описание +DEMO +PDF Как купить Как установить    Как получить файлы журналов   Как тестировать и оптимизировать   
Tired of complex order placement and manual calculations? Trade Dashboard is your solution. With its user-friendly interface, placing orders becomes effortless, by a single click, you can open trades, set stop loss and take profit levels, manage trade lot size, and calculate risk to reward ratios, allowing you to only focus on your strategy. Say goodbye to manual calculations and streamline your trading experience with Trade Dashboard. Download  Demo Version  right now. You can find  Details
The product will copy all telegram signal to MT4   ( which you are member  ) , also it can work as remote copier.  Easy to set up, copy order instant, can work with almost signal formats, image signal, s upport to translate other language to English Work with all type of channel or group, even channel have "Restrict Saving Content", work with  multi channel, multi MT5 Work as remote copier: with signal have ticket number, it will copy exactly via ticket number. Support to backtest signal. How to
Mentfx Mmanage
Anton Jere Calmes
5 (15)
The added video will show you the full functionality, effectiveness, and simplicity of this trade manager. Drag and Drop Trade Manager. Draw your entry and have the tool calculate the rest. Advanced targeting and close portions of a trade directly available in tool (manage trades while you sleep). Market order or limit order on either side with factored spread. Just draw the entry, the tool does the rest. Hotkey setup to make it simple. Draw where you want to enter, and the stop loss, the tool c
Копируйте сигналы из любого канала, участником которого вы являетесь (в том числе частного и ограниченного), прямо на свой MT4. Этот инструмент был разработан с учетом потребностей пользователей и предлагает множество функций, необходимых для управления и мониторинга сделок. Этот продукт представлен в простом в использовании и визуально привлекательном графическом интерфейсе. Настройте свои параметры и начните использовать продукт в течение нескольких минут! Руководство пользователя + Демо  |
TradePanel MT4
Alfiya Fazylova
4.9 (86)
Trade Panel — это многофункциональный торговый помощник. Приложение содержит более 50 функций для ручной торговли, и позволяет автоматизировать большую часть торговых действий. Перед покупкой вы можете протестировать Демоверсию на демо-счете. Демоверсия здесь . Полная инструкция здесь . Торговля. Позволяет совершать основные торговые операции в один клик: Открытие отложенных ордеров и позиций. Открытие сетки ордеров. Закрытие отложенных ордеров и позиций. Переворот позиций (закрыть BUY открыть S
Копируйте сигналы из любого канала, участником которого вы являетесь (без необходимости использования токена бота или разрешений администратора, прямо на ваш MT4. Он был разработан с учетом потребностей пользователей и предлагает множество необходимых вам функций. Этот продукт представлен в простом в использовании и визуально привлекательном графическом интерфейсе. Настройте свои параметры и начните использовать продукт в течение нескольких минут! Руководство пользователя + Демо  |   Версия M
Копир->Удобное и быстрое взаимодействие с интерфейсом, пользователи могут использовать его сразу       ->>>> Рекомендуется использовать на компьютерах Windows или VPS Windows Функции: Разнообразные и персонализированные настройки копирования сделок: 1. Различные режимы лота могут быть установлены для различных источников сигналов. 2. Различные источники сигналов могут быть установлены для прямого и обратного копирования сделок. 3. Сигналы могут быть установлены с комментариями. 4. Следует ли ка
Summer 40% discount ($149 -> $88) Everything for chart Technical Analysis indicator mt4 in one tool Draw your supply demand zone with rectangle and support resistance with trendline and get alerts to mobile phone or email alert -  Risk reward indicator Video tutorials, manuals, DEMO download   here .  Find contacts on my   profile . 1.   Extended rectangles and trendlines Object will be extended to the right edge of the chart when price will draw new candles on chart. This is rectangle extend
Equity Protection EA
CARLOS ALBERTO VALLOGGIA
5 (3)
Equity Protection EA MT4 Общие характеристики: Полный контроль над результатами торговой сессии. Контролирует общий результат для всех валютных символов, индексов, металлов, акций и т. Д. Контроль осуществляется над глобальным капиталом. Закройте все сделки по всем символам при достижении уровня прибыли или убытка. Изменяемые конфигурации как в количестве, так и в процентах. Защита результатов глобальным трейлинг-стопом. Запись достигнутых результатов за сессию (большее и меньшее эквити). Все р
Помощник: Trade Assistant-MT4 (нажмите, чтобы загрузить) Trade Assistant-MT5 (нажмите, чтобы загрузить) Пожалуйста, внимательно прочтите инструкцию по эксплуатации. Основы: Быстрое открытие и закрытие позиций, открытие и закрытие позиций в один клик, размещение ордеров в один клик Торговля по линии розыгрыша Авто сл/тп Закрыть символы Прибыль защищена Переместить SL Защитить Трейлинг SL Контроль рисков по счету Тень Ордена Автоматическое добавление заказов Автоматическое закрытие орде
Trade Manager, который поможет вам быстро входить и выходить из сделок, автоматически рассчитывая риск. Включает функции, которые помогут предотвратить чрезмерную торговлю, торговлю из мести и эмоциональную торговлю. Сделками можно управлять автоматически, а показатели эффективности счета можно визуализировать в виде графика. Эти функции делают эту панель идеальной для всех трейдеров, занимающихся ручной торговлей, и помогают улучшить платформу MetaTrader 4. Многоязычная поддержка. Версия MT5  |
Layer Master Toolbox
Peter Andrew Thomas
5 (3)
GRID TRADING - Layer Master tool kit is the ultimate, easy to use trading toolkit makes it simple to layer grids of Orders over any entry level. This toolkit will make it simple and fast to Open / Enter and Manage your grid trades on MT4. Every function is simple - but clicking and dragging the order zone - you define an area you want your orders, then you can quickly drag the SL and TP levels to where you want them. Hit one button and your orders are sent!!!  Features: It is capable to send h
Grid Manual MT4
Alfiya Fazylova
4.72 (18)
Grid Manual — это торговая панель для работы с сеточными стратегиями. Утилита универсальная, имеет гибкие настройки и понятный интерфейс. Работает с сеткой ордеров не только в сторону усреднения убытков, но и в сторону наращивания прибыли. Трейдеру не нужно создавать и сопровождать сетку ордеров, это сделает утилита. Достаточно открыть ордер и Grid manual автоматически создаст ему сетку ордеров и будет сопровождать его до самого закрытия. Полная инструкция и демо-версия здесь . Основные особенно
Ultimate No Nonsense FX Backtester - You can Run Forward Test Simulation with this tool! Do Not Download the Demo Here, Please Read Below! Step by Step Manual Guide PDF for this backtester PDF List of Commands(Shortcuts) for this backtester Ultimate NNFX Backtester is a powerful utility tool that significantly reduces the length of backtesting process for NNFX followers.  As well as for Forex traders that operates their entries and exits at the close of a candle and manage the risk using A
The product will copy all  Discord  signal   to MT4   ( which you are member  ) , also it can work as remote copier.  Easy to set up. Work with almost signal formats, support to translate other language to English Work with multi channel, multi MT4. Work with Image signal. Copy order instant, auto detect symbol. Work as remote copier: with signal have ticket number, it will copy exactly via ticket number. How to setup and guide: Let read all details about setup and download Discord To MetaTrade
Take a Break
Eric Emmrich
5 (26)
The most advanced news filter and drawdown limiter on MQL market NEW: Take a Break can be backtested against your account history! Check the " What's new " tab for details. Take a Break has evolved from a once simple news filter to a full-fledged account protection tool. It pauses any other EA during potentially unfavorable market conditions and will continue trading when the noise is over. Typical use cases: Stop trading during news/high volatility (+ close my trades before). Stop trading when
Unlimited Trade Copier Pro - это мощный инструмент для удаленного копирования сделок между несколькими счетами MetaTrader 4/MetaTrader 5, расположенными удаленно друг от друга, по сети интернет. Это идеальное решение для провайдеров сигналов, которые хотят поделиться своей торговлей с другими трейдерами по всему миру. Один поставщик может копировать сделки на неограниченное количество счетов-получателей, а один получатель также может копировать сделки неограниченного количества провайдеров. Пост
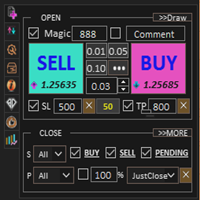
DOWNLOAD DEMO VERSION INSTRUCTIONS  -  https://www.mql5.com/ru/blogs/post/758419 В ТЕСТОВОМ РЕЖИМЕ   (в тестере) функционал панели   НЕ АКТИВЕН . Мы обеспечили только визуальное отображение самой панели. Критически важен инструмент, способный мгновенно рассчитать объем позиции или риск на основе заданного уровня стоп-лосса, как для профессиональных трейдеров, так и для новичков. Торговая утилита TRADE PRO предоставляет быстрые и точные расчеты, помогая вам принимать решения в условиях огранич
On the occasion of the first days of publishing and attracting first customers, a 50% discount $120 for first 10 user (3 license left) Next price is $160 > $200 > $240 Don't forget to send a message after buying (not renting) to add you to our VIP group for free. Live OrderBoook, Another high-level tool by Ziwox Order Book An order book is an electronic list of buy and sell orders for a specific asset, organized by price level. It provides real-time data on market depth, showing the amount o
VirtualTradePad mt4 Extra
Vladislav Andruschenko
4.88 (57)
Торговая Панель для торговли в 1 клик.  Работа с позициями и ордерами!  Торговля с  чарта  (график) или с  клавиатуры . С помощью нашей торговой панели Вы можете торговать   в один клик с графика   и совершать торговые операции в   30   раз быстрее стандартного управления в MetaTrader.  Автоматические расчеты параметров и функции, которые облегчают жизнь трейдеру и помогают трейдеру вести свою торговую деятельность в разы быстрее и удобнее. Графические подсказки и полная информация по торговым
DrawDown Limiter MT4
Haidar, Lionel Haj Ali
5 (8)
Drawdown Limiter EA You are in the right place if you were searching for Drawdown control, Drawdown limiter, Balance protection, Equity Protection or Daily Drawdown Limit related to Prop Firm, FTMO, or Funded account trading, or if you want to protect your trading account. Have you suffered from controlling your drawdown when trading funded accounts? This EA is meant for you. Prop firms usually set a rule called “Trader Daily Drawdown”, and if it is not respected, you are disqualified.  I am an
News Trapper EA
Noha Mohamed Fathy Younes Badr
4.86 (14)
Hi, all.  News trapper EA It is an expert for trading news very safe expert  Automated Trading on the news of the economic calendar. It shows stable trading during last 10  years. EA doesn't use dangerous technologies like martingale, grid. The Expert is very simple to use.      sale will end after 48 h how to install it     and set files     read the blog         after purchase contact me to add you to   VIP   channel  The program contains flexible settings for trading on the news of the econ
Агент Trade Copier предназначен для копирования сделок между несколькими счетами/терминалами MetaTrader (4/5). С помощью этого инструмента вы можете выступать в роли поставщика (источника) или получателя (назначения). Все торговые действия будут копироваться от провайдера к получателю без задержки. Этот инструмент позволяет копировать сделки между несколькими терминалами MetaTrader на одном компьютере с молниеносной скоростью копирования менее 0,5 секунды. Руководство по установке и вводу агент
Comprehensive on chart trade panel with the unique ability to be controllable from mobile as well. Plus has a library of downloadable configuration, e.g. exit rules, extra panel buttons, pending order setup and more. Please see our product video. Works with all symbols not just currency pairs. Features On chart panel plus controllable from free app for Windows, iPhone and Android Built-in script engine with library of downloadable configuration, e.g. add 'Close All Trades in Profit' button, exit
Strategy Builder offers an incredible amount of functionality. It combines a trade panel with configurable automation (covert indicators into an EA), real-time statistics (profit & draw down) plus automatic optimization of SL, TP/exit, trading hours, indicator inputs. Multiple indicators can be combined into an single alert/trade signal and can include custom indicators, even if just have ex4 file or purchased from Market. The system is easily configured via a CONFIG button and associated pop-up
The Expert Advisor will help you forward all pop-up alert with screenshot from  MetaTrader 4 to Telegram channel/ group, also forward all notifications to Telegram. Parameters  -  Telegram Bot Token - create bot on Telegram and get token.  -  Telegram Chat ID  - input your Telegram user ID,  group / channel ID  -  Forward Alert - default true, to forward alert.  -  Send message as caption of Screenshot - default false, set true to send message below Screenshot  How to setup and guide  - Telegram
Другие продукты этого автора
RSI divergence indicator finds divergences between price chart and   RSI   indicator and informs you with alerts (popup, mobile notification or email). Its main use is to find trend reversals in the chart. Always use the divergence indicators with other technical assets like support resistance zones, candlestick patterns and price action to have a higher possibility to find trend reversals. Three confirmation type for   RSI   divergences: RSI   line cross 50 level Price returns to previous H/L C
FREE
RSI Divergence Scanner is a multi-timeframe and multi-symbol dashboard and alert that checks all timeframes and symbols to find regular and hidden divergences between price chart and RSI indicator. This divergence scanner is integrated with support and resistance zones so you can check the RSI divergences in the most important areas of the chart to find trend reversals in price chart. Download demo version   (works on M4,M5,M6,M12,H3,H8 timeframes) Full description of scanner parameters ->   cli
25% off. Original price: $40 Stochastic Scanner is a multi symbol multi timeframe Stochastic dashboard that monitors the indicator for price entering and exiting overbought and oversold in up to 28 symbols and 9 timeframes. Download Demo here  (Scans only M1 and M5) Settings description   here MT5 version   here Stochastic Scanner features: Signals price entering and exiting the overbought and oversold zones. Monitors up to 28 customizable instruments and 9 timeframes at the same time. You
40% off. Original price: $50 Advanced Bollinger Bands Scanner is a multi symbol multi timeframe Bollinger bands dashboard that monitors and analyzes the Bollinger Bands indicator from one chart. This panel scans the Bollinger bands indicator in up to 28 configurable instruments and 9 timeframes for price overbought/oversold, price consolidation (Bollinger bands squeeze), and consolidation breakout (squeeze break)  with a deep scan feature to scan all market watch symbols (up to 1000 instrumen
MACD divergence indicator finds divergences between price chart and MACD indicator and informs you with alerts (popup, mobile notification or email) . Its main use is to find trend reversals in the chart. Always use the divergence indicators with other technical assets like support resistance zones, candlestick patterns and price action to have a higher possibility to find trend reversals. Three confirmation type for MACD divergences: MACD line cross zero level Price returns to previous H/L Crea
FREE
40% off. Original price: $50 Ichimoku Trend Finder is a multi symbol multi timeframe trend dashboard that helps traders to monitor and identify potential market trends from one chart. This panel scans the Ichimoku Kinko Hyo indicator in 28 configurable instruments and 9 timeframes for classic Ichimoku trend signals with a deep scan feature to scan all market watch symbols (up to 1000 instruments!).     Download Demo here  (Scans only M1 and M6) Settings description   here MT4 version   here
RSI divergence indicator finds divergences between price chart and RSI   indicator and informs you with alerts (popup, mobile notification or email). Its main use is to find trend reversals in the chart. Always use the divergence indicators with other technical assets like support resistance zones, candlestick patterns and price action to have a higher possibility to find trend reversals. Three confirmation type for RSI   divergences: RSI   line cross 50 level (doesn't repaint) Price returns to
FREE
MACD Divergence Scanner is a multi-timeframe and multi-symbol dashboard and alert that checks all timeframes and symbols to find regular and hidden divergences between price chart and MACD indicator. This divergence scanner is integrated   with support and resistance zones so you can check the MACD divergences in the most important areas of the chart to find trend reversals in the price chart. Download demo version   (works on M4,M5,M6,M12,H3,H8 timeframes) Full description of scanner parameters
Ichimoku Trend Alert is the Ichimoku Kinko Hyo indicator with Alerts and signal filters. Ichimoku Trend Alert features: Optional check of Ichimoku cloud, Tenkan sen(Conversion Line), Kijun sen(Base Line), Senkou span A, Senkou span B, and Chikou span relative to price, and more. Popup, email, and phone notification alerts for selected symbols and timeframes. There are 9 classic Ichimoku trend filters you can enable/disable in settings: Price/Cloud Order:   Checks the price position relative
FREE
40% off. Original price: $50 Support and Resistance Dashboard for MT4 is a multi-timeframe and multi-symbol scanner and alert system that finds S/R zones and pivot points for all timeframes and symbols and alerts when price has interaction with them. If you are using support and resistance (or supply and demand) zones in your trading strategy, this dashboard and its alert and filtering system is a big time saver for you. Download demo version   (works on M 1,M5,M30,W1   timeframes) Full descrip
50% off. Original price: $60 Candlestick Pattern Scanner is a multi-timeframe and multi-symbol dashboard and alert system that checks all timeframes and currency pairs for different candlestick patterns that are formed in them. Scanner is integrated with support and resistance zones so you can check the candlestick patterns in the most important areas of the chart to find breakout and reversal patterns in the price chart. Download demo version   (works on M1,M5,M30,W1 timeframes) Read the full
Moving Average Trend Alert is a triple MA indicator that helps traders to identify potential market trends based on 3 MAs alignment and crossover. Moving Average Trend Alert features: Customizable short-term, medium-term, and long-term MAs. Option to filter signals based on a minimum distance between moving averages to avoid premature MAs alignment. Optional Filter of signals with RSI indicator overbought/oversold levels. Optional Filter of signals with ADX indicator. Popup, email, and phone n
FREE
40% off. Original price: $50 Moving Average Trend Scanner is a multi symbol multi timeframe triple MA crossover dashboard that helps traders to monitor, and identify potential market trends from one chart. This panel scans 3 moving averages in up to 28 configurable instruments and 9 timeframes for triple moving average alignment and moving average crossover  with a deep scan feature to scan all market watch symbols (up to 1000 instruments!). Download Demo here  (Scans only M1 and M5) Settin
40% off. Original price: $50 Support and Resistance Dashboard for MT5 is a multi-timeframe and multi-symbol scanner and alert system that finds S/R zones and pivot points for all timeframes and symbols and alerts when price has interaction with them. If you are using support and resistance (or supply and demand) zones in your trading strategy, this dashboard and its alert and filtering system is a big time saver for you. Download demo version   (works on M4,M5,M6,M12,H3,H8 timeframes) Full desc
40% off. Original price: $50 Moving Average Trend Scanner is a multi symbol multi timeframe triple MA crossover dashboard that helps traders to monitor, and identify potential market trends from one chart. This panel scans 3 moving averages in up to 28 configurable instruments and 9 timeframes for triple moving average alignment and moving average crossover with a deep scan feature to scan all market watch symbols (up to 1000 instruments!).   Download Demo   here   (Scans only M1 and M6) Sett
50% off. Original price: $60 Support and Resistance zones indicator for MT4 is a multi-timeframe panel and alert that finds support and resistance zones and pivot points for all timeframes of MetaTrader 4 and gives alert when price has interaction with them. Download demo version (works on GBPUSD, EURJPY and NZDUSD symbols) Read the full description of scanner parameters in the blog page . Many unique features in one indicator: Integrating support and resistance zones and pivot points in one
25% off. Original price: $40 RSI Scanner is a multi symbol multi timeframe RSI dashboard that monitors Relative Strength Index indicator for price entering and exiting overbought and oversold in up to 28 symbols and 9 timeframes. Download Demo here  (Scans only M1, M5 and M10) Settings description   here MT4 version   here RSI Scanner features: Signals RSI entering and exiting the overbought and oversold zones. Monitors 28 customizable instruments and 9 timeframes at the same time. Supports
50% off. Original price: $60 Ichimoku Assistant is a multi-timeframe panel and alert system that scans all timeframes for multiple rules related to different ichimoku strategies. The Ichimoku indicator has 5 different lines, including Tenkan-sen, Kijun-sen, Senku Span A, Senku Span B and Chikou Span. This scanner checks the status of these lines compared to each other and gives alerts based on your selected rules. If you are using ichimoku kinko hyo in your trading strategy, this scanner and it
MACD divergence indicator finds divergences between price chart and MACD indicator and informs you with alerts (popup, mobile notification or email). Its main use is to find trend reversals in the chart. Always use the divergence indicators with other technical assets like support resistance zones, candlestick patterns and price action to have a higher possibility to find trend reversals. Three confirmation type for MACD divergences: MACD line cross zero level Price returns to previous H/L Creat
FREE
50% off. Original price: $60 Candlestick Pattern Scanner is a multi-timeframe and multi-symbol dashboard and alert system that checks all timeframes and currency pairs for different candlestick patterns that are formed in them. Scanner is integrated   with support and resistance zones so you can check the candlestick patterns in most important areas of the chart to find breakout and reversal patterns in the price chart. Download demo version   (works on M4,M5,M6,M12,H3,H8 timeframes) Read the f
50% off. Original price: $60 Order Manager is a trade assistant and trade copier with a money manager that helps traders open, modify and close manual trades and also copy their trades between multiple accounts in the most simple way to help them focus more on their market analysis and open orders with just a few clicks. Download Demo here  (It only works on demo accounts) Full guide   here MT5 version here Order Manager features: Works on all instruments such as currency pairs, indexes, CF
Ichimoku Trend Alert is the Ichimoku Kinko Hyo indicator with Alerts and signal filters. Ichimoku Trend Alert features: Optional check of Ichimoku cloud, Tenkan sen(Conversion Line), Kijun sen(Base Line), Senkou span A, Senkou span B, and Chikou span relative to price, and more. Popup, email, and phone notification alerts for selected symbols and timeframes. There are 9 classic Ichimoku trend filters you can enable/disable in settings: Price/Cloud Order: Checks the price position relative to
FREE
50% off. Original price: $375 Reward Multiplier is a semi-automatic trade manager based on pyramid trading that opens additional orders with the running profit of your trades to maximize return exponentially without increasing the risk. Unlike other similar EAs, this tool shows potential profit/loss and reward to risk ratio before even entering the first trade! Download Demo here  (starting lot is fixed at 0.01) Guide + tips here MT5 version   here You only open the first order. When your
Moving Average Trend Alert is a triple MA indicator that helps traders to identify potential market trends based on 3 MAs alignment and crossover. Moving Average Trend Alert features: Customizable short-term, medium-term, and long-term MAs. Option to filter signals based on a minimum distance between moving averages to avoid premature MAs alignment. Optional Filter of signals with RSI indicator overbought/oversold levels. Optional Filter of signals with ADX indicator. Popup, email, and phone n
FREE
Reward Multiplier is a semi-automatic trade manager based on pyramid trading that opens additional orders with the running profit of your trades to maximize return exponentially without increasing the risk.Unlike other similar EAs, this tool shows potential profit/loss and reward to risk ratio before even entering the first trade! Download full version here  ( In the mini version. Starting lot is fixed at 0.01 (or minimum allowed lot size ) Guide + tips here MT4 version   here You only open the
FREE
Advanced Indicator Scanner is a multi-symbol multi-timeframe scanner that works with hundreds of custom indicators available across the web including mql5 website market and codebase indicators. Advanced Indicator Scanner features: Scans your indicator in 28 customizable instruments and 9 timeframes. Monitors up to 2 lines(buffers) of an indicator. Showing of indicator value on buttons. You can choose between 3 alert modes:  Single symbol and timeframe Multiple timeframes of a symbol Multipl
Reward Multiplier is a semi-automatic trade manager based on pyramid trading that opens additional orders with the running profit of your trades to maximize return exponentially without increasing the risk. Unlike other similar EAs, this tool shows potential profit/loss and reward to risk ratio before even entering the first trade! Download full version here  ( In the mini version. Starting lot is fixed at 0.01 (or minimum allowed lot size ) Guide + tips here MT5 version   here You only open the
FREE
50% off. Original price: $60 Triangle Finder is a multi symbol multi timeframe dashboard that monitors and finds symmetrical triangle pattern in 28 symbols and 9 timeframes with a deep scan feature to scan all market watch symbols (up to 1000 instruments!). Download Demo here  (Scans only M1 and M5) Settings description   here MT5 version   here Triangle Finder features: Realtime monitoring of 28 customizable instruments and 9 timeframes at the same time. Deep scan mode to scan all market w
25% off. Original price: $40 RSI Scanner is a multi symbol multi timeframe RSI dashboard that monitors Relative Strength Index indicator for price entering and exiting overbought and oversold in up to 28 symbols and 9 timeframes. Download Demo here  (Scans only M1 and M5) Settings description   here MT5 version   here RSI Scanner features: Signals RSI entering and exiting the overbought and oversold zones. Monitors 28 customizable instruments and 9 timeframes at the same time. You can choos
40% off. Original price: $50 ATR Scanner Pro is a multi symbol multi timeframe volatility scanner that monitors and analyzes Average True Range indicator value in up to 28 symbols and 9 timeframes in 3 modes : ATR value:   As a volatility dashboard it shows the ATR indicator value in all pairs and timeframes and signals when the ATR value reaches a maximum or minimum in a given duration. Short term ATR/Long term ATR ratio:  It shows ratio of 2 ATRs with different periods. It's useful in detec
Фильтр:
Behzad Mohebali
81
Behzad Mohebali 2022.11.27 06:35 
 

An excellent and efficient tool Along with a professional and committed developer.

Hoping to add more features to this tool.

good luck

Ответ на отзыв
Версия 6.3 2023.11.02
+ Stochastic indicator confirmation type added to the scanner. By selecting this option, divergence will confirm when Stochastic lines cross each other. You also can choose that lines cross must be in overbought or oversell levels.
+ "Confirm with Candlestick Patterns before other confirmations" option added to the scanner, by enabling it the divergences must first be confirmed by candlestick patterns, then confirm by selected confirmation type.
+ The option “Mark divergences that happen after a long trend” added to the dashboard (for “Check trend length for regular divergences” parameter).
+ Minor bug fixes and improvements.
Версия 6.1 2023.10.10
+ Average body filter (for 2-bar and 3-bar patterns) and average height filter (for 1-bar patterns) parameters added to the dashboard, by enabling these filters you can set the dashboard to show only divergences that confirm by big size candlestick patterns.
+ Now you can use dashboard signals in your EAs. If you set the dashboard to show the divergences in new charts, then you can use the divergence information embedded in the Arrow name in your EA.
- Fixed a bug that caused the dashboard to sometimes show invalid divergences on dashboard startup.
Версия 6.0 2023.08.30
+ A parameter added to the scanner to use a second ZigZag indicator for detecting more divergences. Enabling this parameter slows down the scanner, so use it if you are loading a limited number of symbols and timeframes in the dashboard.
+ Minor bug fixes and improvements.
Версия 5.9 2023.08.02
+ Bug fixes and improvements.
Версия 5.8 2023.07.05
+ Dashboard startup time has been reduced, it loads faster when attached to the chart or changing input parameters.
+ An option added to the dashboard to not remove the failed divergences from the dashboard, it is useful when you want to practice the divergence trading.
+ Now you can choose what information to see on the dashboard cells: “Divergence type,candles passed” or “Divergence type, divergence direction,candles passed” or “Compact detailed info”.
+ Improvement in candlestick pattern confirmation rules.
+ Minor changes and improvements.
Версия 5.7 2023.06.12
+ Piercing, Dark Cloud and Harami patterns added to the candlestick pattern confirmation for divergences.
! Fixed a problem in MA filters, now filter direction parameters must work correctly.
Версия 5.6 2023.06.07
+ Improvement in divergence detection rules.
+ Improvement in MA filters, now you can set for each filter to be applied to which type of divergence (regular, hidden or both), also the filters can be reversed separately.
Версия 5.4 2023.05.29
+ Now you can filter divergences with 2 Moving Average indicators from same or upper timeframes, you can set timeframe and period of these MAs separately for each timeframe of the dashboard.
+ You can reverse the Moving Average filters and find divergences that are in the opposite direction of the MA.
+ Minor improvements.
Версия 5.3 2023.05.20
+ Candlestick patterns (7 pattern) added to "Confirmation type" parameter, with this option divergence will be confirmed if a candlestick pattern forms after it. This option is experimental and will be removed if it doesn't work as expected.
+ Minor bug fixes and improvements.
Версия 5.2 2023.04.01
Fixed a bug in changing the cell colors for S/R zones in the previous update.
Версия 5.1 2023.02.23
+ Added Moving Average indicator filter, you can now set the scanner to find divergences based on the direction of the moving average and/or the position of the divergence relative to the MA.
- Fixed a bug in loading symbols from the symbol list when the symbol names have lowercase letters.
Версия 5.0 2023.02.22
+ Now you can set the scanner to only find divergences that happen at the end of a long trend.
+ Two new confirmation type ("Changing the color of Heiken Ashi indicator" and "Strong Reversing Candle") added to the scanner and "New zigzag leg" confirmation type removed from the scanner.
+ Two filters (and their parameters) added for detecting the strong reversing candle.
+ You can choose to show the divergence lines and arrow on the opened charts with custom chart template (don't forget to add the RSI divergence indicator to the chart template and save it).
+ Minor improvements and bug fixes.
Версия 4.0 2023.01.14
+ "Max. divergence pullback percent (Fibonacci retracement)" option added to the scanner, with this option you can set the maximum acceptable percent for the last pullback in the trend.
+ "Min. length ratio (last wave/previous wave)" options added to the scanner, with this parameter you can define the minimum acceptable length of the last wave of the trend compared to the length of the wave before it.
+ "Max. length ratio (last wave/previous wave)" options added to the scanner, with this parameter you can define the maximum acceptable length of the last wave of the trend compared to the length of the wave before it.
+ "Min. time ratio (last wave/previous wave)" parameter added to the scanner, with this parameter you can define the minimum acceptable duration of the last wave of the trend compared to the duration of the wave before it.
+ "Max. time ratio (last wave/previous wave)" parameter added to the scanner, with this parameter you can define the maximum acceptable duration of the last wave of the trend compared to the duration of the wave before it.
+ Improving the dashboard appearance.
- Fixing a bug where sometimes the dashboard didn't send immediate alert for new divergences.
Версия 3.6 2022.12.21
- "Min. divergence pullback percent (Fibonacci retracement)" option added to the scanner, this option helps to filter out divergences caused by small pullbacks in the trend.
- "Cell background color" option added for the dashboard.
Версия 3.5 2022.12.07
+ You can select for each symbol to alert only bullish or bearish divergences by clicking on its cell on dashboard.
+ Panel cells show the strength of divergences (weak, medium, strong).
+ Panel cells show when divergence happens in RSI oversold/overbought levels (by showing O letter in the cell).
+ You can see divergence lines for both price and RSI indicator when checking divergences in new charts.
+ You can see nearest support and resistance zones when checking divergences in new charts to see the price distance to S/R levels.
Версия 3.4 2022.10.29
+ A parameter added to enabling alerts for selected timeframes on startup of dashboard.
Версия 3.3 2022.10.03
+ Added an option to receive alert immediately after divergence detected by scanner (before any confirmation, this may create repeated alerts).
+ Added a parameter to automatically open divergence chart after detecting the divergence, without clicking on dashboard cell.
+ Now you can split the symbols into 3 columns for showing more symbols in the dashboard on a single chart.
Версия 3.1 2022.09.04
+ Finding hidden divergences added to the scanner.
+ Now you can load a custom chart template when clicking on the dashboard cells.
! Fixed a bug in showing the zones when MetaTrader starts up.
! Minor bug fixes and improvements.
Версия 2.2 2022.06.28
Fixed a bug in splitting symbols into 2 columns.
Версия 2.1 2022.06.27
The option “Split symbols in 2 columns” added to the parameters, now you can show more symbols in the dashboard on a single chart.